The increase in trading in oil stocks is mostly associated with 2009.3 However, there is still the possibility that with a clear momentum in oil prices between 2004 and 2008, some commercial traders may have built up stocks as either hedged (contango and carry trade) or uncovered speculative positions.4 . 2015) attributes the contango in oil markets in the second half of the 2000s to financialization. Thus, the financing may have supported speculation in the physical market by encouraging contango and carry trading.
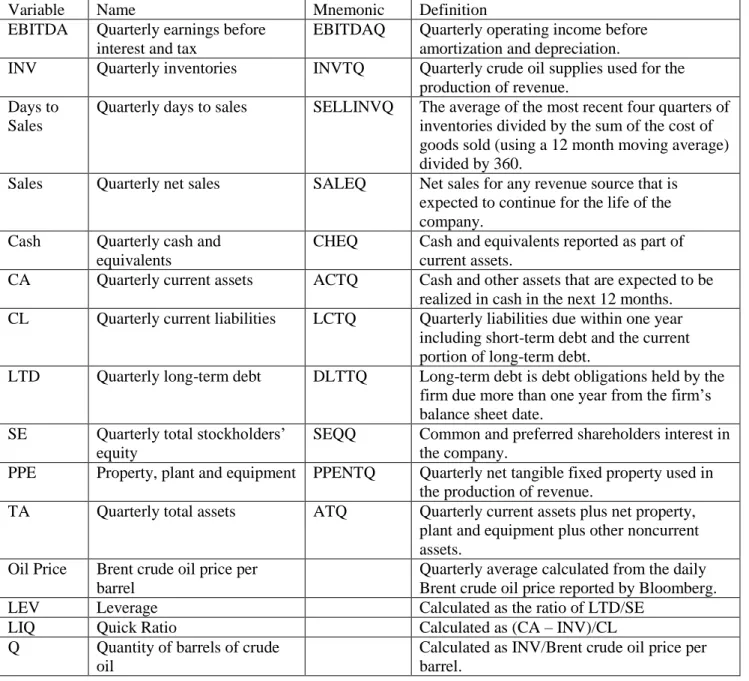
Method 3 uses a predictive model of operating profit using the number of barrels of oil, measured as inventory divided by the price of crude oil per barrel, as an explanatory variable for the pre-speculation period (1990Q4 to 2004Q3) and the speculation period. (2004Q4 to the second quarter of 2008), with the latter determined by the structural break in the price of oil. As with the literature exploring the impact of financial speculators (see Section 1), the evidence regarding the impact of inventories on price is also mixed. PPE Property, plant and equipment PPENTQ Net quarterly net fixed property used in the production of income.
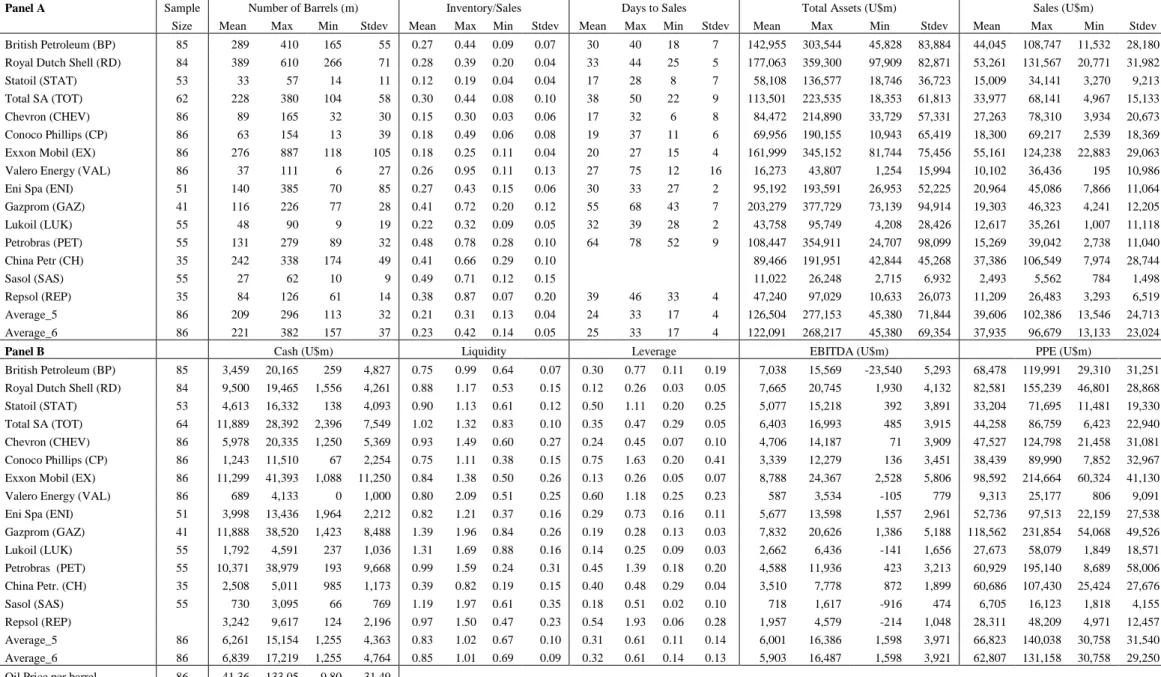
The heterogeneity in the sample is also evident from the summary statistics for the controls. In particular, Repsol reports a high leverage ratio of 1.93 compared to only 0.02, the minimum in the sample disclosed by Sasol. The summary statistics confirm the heterogeneity in the firms sampled across the various control, inventory and performance measures reported.
Overall, the summary statistics in Table 2 highlight the heterogeneity in the scaled inventory, days to sale, sales, and operating profitability of the firms in our sample.
Methodology
ISPI (Index of Scaled Physical Inventories)
During our study period, firms experience a range of very high and very low cash holdings in their current assets. Likewise, firms demonstrate very high and extremely low levels of liquidity (measured using the quick ratio).8 China Petroleum reports a minimum liquidity measure of 0.19 compared to Valero's high of 2.09. Average leverage, measured as long-term debt divided by total shareholders' equity, is typically below 50% during the study period; however, firms hold very high and very low levels of long-term debt to total equity.
Gazprom has the highest dollar investment in PPE for the period with a maximum value of $231,854 million invested in physical assets. Further exploration of individual company data will allow us to examine the heterogeneity of company behavior regarding inventory holding and oil price speculation. 15 𝑉𝑖,𝑡𝑆 = (𝐼𝑖,𝑡⁄𝑆𝑖,
The ISPI measures the average level of scaled physical inventories based on each of the n oil companies included in the average value, as shown in equation (2). The first method we use to investigate the research question is a descriptive evolution of the ISPI over time, together with an examination of the ISPI ± 1 standard deviation of ISPI to capture the heterogeneity of behavior in ISPI over time to investigate. As a second measure of oil company inventories, we also examine days to sale.9 This measure is already calibrated to take into account the size of companies based on sales.
Structural Breakpoint Tests
16 oil price breakpoints with the company's breakpoints to identify periods when inventories indicate speculative behavior in the pre-2008 oil price run-up.
Profit Model Using Inventory as an Explanatory Variable
Descriptive Results
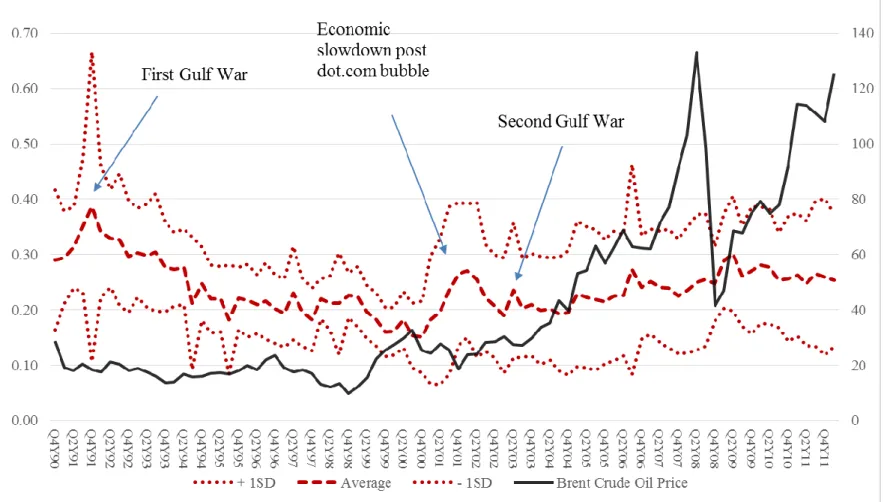
The chart shows the ISPI measure ± 1 standard deviation for the 13 oil companies over the entire sample period. The left axis reports the ISPI measure and the right axis reports the price of a barrel of crude oil. The width of the band measuring the standard deviation on either side of the ISPI measure widens after the fourth quarter of 2000.
19 Figure 1b: Descriptive results for ISPI ± 1 SD measured by inventory scaled by sales for the five companies with continuous data Figure 1a shows data for all 13 companies in the sample, but since data for most of these is incomplete, it is possible that that ISPI is biased by a company's inclusion in the index. As a robustness exercise, we therefore calculate the ISPI for the five companies with continuous stock-to-sales data throughout the entire analysis period (86 quarters, see table 2). This corresponds to Figure 1a for days on sale for 12 of the 13 companies (Petrobras was omitted as it was an outlier in terms of days on sale).
Because inventory and sales data are incomplete for many firms11, it is possible that the ISPI measure shown in Figure 1a is biased by inclusion in the firm index. This is again consistent with a subset of companies holding larger oil inventories in anticipation of rising crude prices. To shed light on which of these trades may have been important in the stockpiling, we plot in Figure 2 the forward spread (monthly letter futures minus 9-month futures) against the ISPI over the period of interest (Q4Y03 and Q1Y12). .
11 This is due to the fact that some companies report semi-annually rather than quarterly during the sample periods. In the second period, Q3 2008 to Q1 2011, contango is caused by the collapse of near futures and spot prices after the global financial crisis. Moreover, in the first case, inventories were rising when global oil supply was assumed to be tight, while in the second case, the increase in the ISPI will reflect a supply glut.
It can therefore be suggested that in the first period the contango and carry trade exacerbated the oil price rise, while in the second period it served to bring the spot and futures market back into balance. Furthermore, the ± one standard deviation of ISPI highlights the heterogeneity of oil companies' behavior in the period leading up to the oil price increase. Next, we formally test for significant discontinuities in the inventory holding for each firm and the ISPI-scaled inventory.
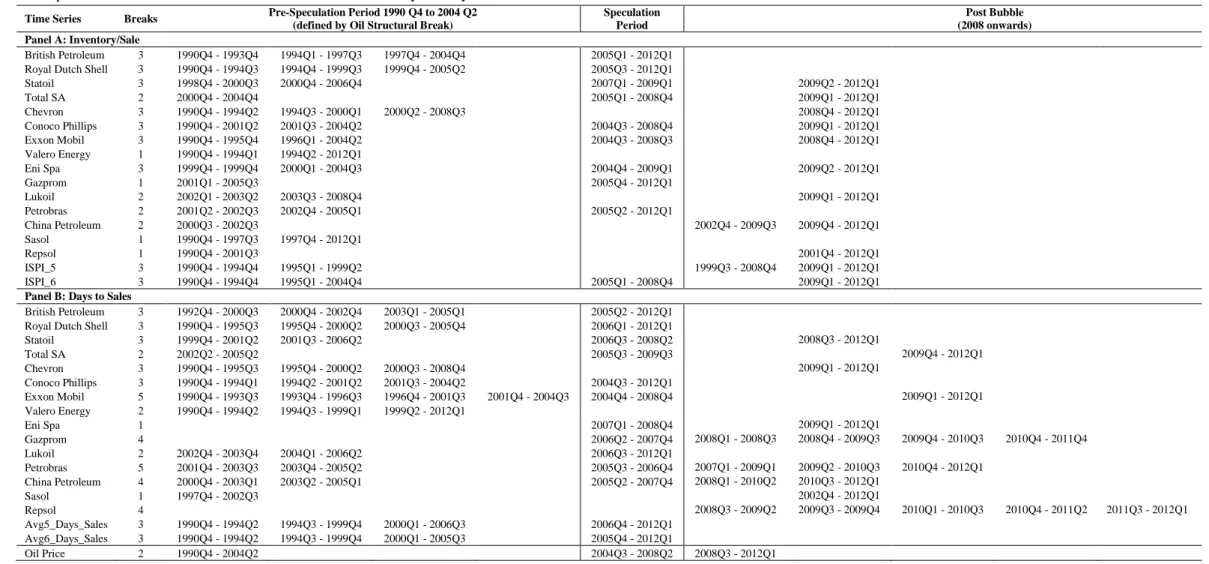
This table reports the results of the Bai-Perron structural break tests using the global information measure for individual company time series and the ISPI time series based on the five (ISPI_5) and six (ISPI_6) largest oil companies in the sample with data available in each term. The following graphs show the change in Inventory/Sales (IS) and days to sales (DS) measures for each of the oil companies showing a significant structural break in the time series of the scaled inventory data over the sample period.
Structural Breaks
34 China, Sasol and Repsol show no sign of a structural break during the speculation period based on the measure of inventory to sales. Structural break analysis confirms the heterogeneity in inventory behavior by different commercial traders. In contrast, companies without structural or negative discontinuities show no evidence of speculative behavior.
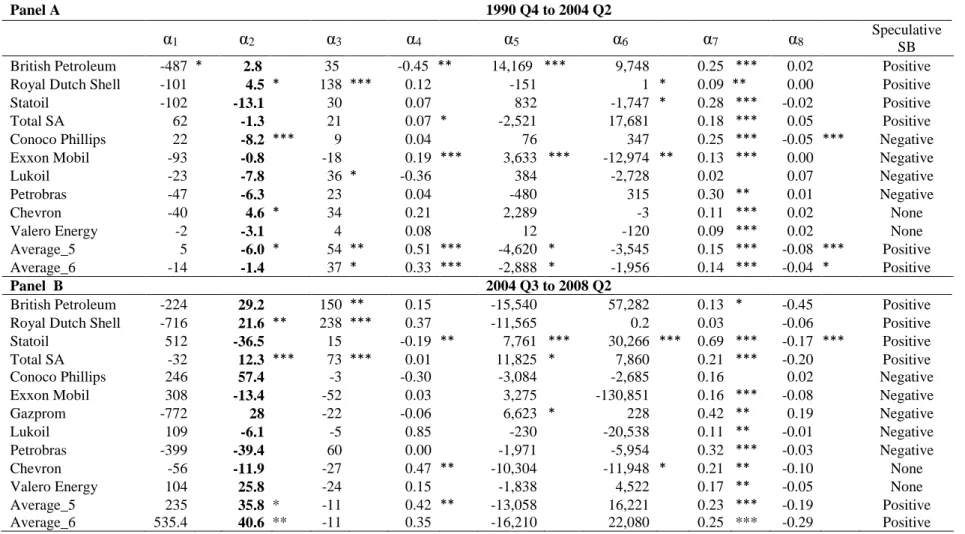
Operating Profit Model 14
35 It is also worth noting that Gazprom and Valero both have a positive 𝛼2 coefficient, consistent with H4, but neither of these coefficients is significant.15. The 𝛼2 coefficient for Total switches from negative to positive when moving from the pre-speculation to the speculation period. The results show that in the case of Royal Dutch Shell, Total and Average_6 the positive relationship between change in EBITDA and the amount of inventory held appears to be substantial.
However, as the price of oil increases, the relationship between profitability and inventories turns from negative to positive and becomes stronger for traders who experience a positive structural break in inventories after the market momentum begins. Note that there is insufficient data to estimate models for China Petroleum, Eni, Repsol and Sasol in both periods. Where Q is the number of barrels of crude oil determined from inventory data on the balance sheet, P is the price of crude oil, cash is the value of cash and cash equivalents disclosed in current assets, LIQ is the quick ratio, LEV is the ratio of long-term debt to total equity , sales is revenue shown in the income statement and PPE is the value of property, plant and equipment disclosed in the balance sheet.
Conclusions
We report some evidence of conversion in the coefficients for the change in the quantity of inventory variable over the two periods. There are also consistent but statistically insignificant sign changes in the sensitivity of the amount of oil held by firms to changes in operating profitability measured by EBITDA. The conclusion based on these models is that switching did not materially affect performance, except for the cases of Royal Dutch Shell and Total.
To conclude, our evidence from ISPI (Figures 1a, 1b and 1c) and structural breakdowns strongly suggests that at least some oil companies were involved in speculative activity, although this does not represent indisputable 'smoking gun' evidence that they did this - The possibility remains that other factors have caused the increase in the number of individual inventories. For example, the lengthening of supply chains could be a plausible alternative explanation, and it seems that this could explain the positive structural break for Statoil, which started distributing oil beyond Europe in the relevant period. Overall, our results are very consistent with the evidence presented in Kaufmann (2011) and thus add to the 'sniff test' that physical market speculation may have contributed to price increases between 2004 and 2008.
We thank the participants at the 39th IAEE International Conference (Bergen, Norway, 2016), the international conference on Not all oil price shocks are equal: Disentangling demand and supply shocks in the crude oil market.