http://researchcommons.waikato.ac.nz/
Research Commons at the University of Waikato
Copyright Statement:
The digital copy of this thesis is protected by the Copyright Act 1994 (New Zealand).
The thesis may be consulted by you, provided you comply with the provisions of the Act and the following conditions of use:
Any use you make of these documents or images must be for research or private study purposes only, and you may not make them available to any other person.
Authors control the copyright of their thesis. You will recognise the author’s right to be identified as the author of the thesis, and due acknowledgement will be made to the author where appropriate.
You will obtain the author’s permission before publishing any material from the thesis.
Deposit characteristics and dynamic processes of large volume pyroclastic density currents of the Taupo
Volcanic Zone approaching and entering the sea
A thesis
submitted in partial fulfilment of the requirements for the degree
of
Master of Science (Research) in Earth Sciences at
The University of Waikato by
Mia Ani Richmond
2022
Abstract
Pyroclastic density currents (PDCs) entering the sea are a rare but dynamic phenomenon that cause significant change to the topography and bathymetry of coastal and island arc settings. Very little is known about their complex behaviour and depositional processes, as observation of such an event is uncommon and conducting experiments that simulate PDCs is challenging. A better understanding of this phenomena can aid in future volcanic monitoring and hazard management around coastal and oceanic settings.
This study combines both field observations and laboratory experiments of PDCs entering the sea.
Case studies around North Island, New Zealand of pre-historic pyroclastic deposits found near the coast focused on, the Rotoiti Ignimbrite that originated from the Okataina Volcanic Centre (Pacific Coast Highway between Matata and Maketu; Mimiha Road near Matata), and the Ongatiti Ignimbrite (Glenbrook Beach, Waiuku; Kihi Road, inland of Kawhia Harbour) from the Mangakino Volcanic Centre. At each location, field observations were recorded, and samples collected, followed by grainsize and texture analysis in the laboratory (scanning electron microscopy, laser diffraction particle size analysis, dry sieving). Laboratory experiments that simulated small-scale PDCs generated by a column collapse mechanism and a dam-break mechanism into a flume were conducted.
The Ongatiti Ignimbrite at Glenbrook Beach presented flow-water interaction features through soft sediment deformations such as dewatering structures, flame structures, and thin beds of convoluted laminae. The Rotoiti Ignimbrite at Mimiha Road showed distinctive crossbedding. Both examples highlighted PDC processes after entry into the water. The Rotoiti and Ongatiti ignimbrites along the Pacific Coast Highway and Kihi Road, respectively presented typical subaerial ignimbrites that had travelled long distance overland and were still undergoing significant deposition near the coastline. The flume experiment demonstrated that PDCs segregate into two parts when entering the water, (1) a dilute overflow cloud, and (2) a dense underwater current. The entrance of pyroclastic ash material into water also generated a wave. Underwater obstructions will affect a submergent current by significantly decreasing its height and runout distance.
Acknowledgements
Firstly, a very big thank you to my supervisor Dr Adrian Pittari who has been a great help in several ways. For being my right-hand man in the field through rain, wind, sun, and the sticky mud, for navigating me around bumps in the road, and for helping proofread and edit all my work. I am very grateful for Adrian’s time and guidance through this all.
Secondly, a thank you to laboratory technician Annette Rodgers who has assisted me and all my needs in the laboratory. Anette’s here-to-help attitude never went unnoticed. I am very grateful for her door always being open.
A massive thank you to my family, especially my parents, for always being there when I needed them. For always listening and understanding and providing never ending support. I couldn’t have done this without their contributions and encouragement.
This research has been partially funded by The University of Waikato Masters Research Scholarship and the Terry Healy Memorial Scholarship.
Lastly, a warm thank you to my partner Ethan. I well and truly couldn’t have made it to the finish line without his comfort and cheering me on every step of the way. I am very lucky to have Ethan’s kindness and intellect by my side.
Table of Contents
Abstract ... i
Acknowledgements ... ii
Table of Contents ... iii
List of Figures... vi
List of Tables ... ix
Chapter 1 - Introduction ...1
1.1 Background ...1
1.2 Aim and Objectives ...2
1.3 Methods ...2
1.4 Outline ...2
Chapter 2 – Literature Review ...4
2.1 Introduction ...4
2.2 Pyroclastic Flows and Ignimbrites ...4
2.3 Plumes & Turbidity Currents ...5
2.4 New Zealand Volcanism ...6
2.4.1 Ongatiti Ignimbrite...7
2.4.2 Volcaniclastic Turbidities at Mahia Peninsula ...9
2.4.3 Rotoiti Ignimbrite ... 10
2.5 Global Examples of Pyroclastic Flows Entering the Sea ... 11
2.5.1 Green Tuff of the Pantelleria Trough ... 11
2.5.2 Krakatau ... 12
2.5.3 Kikai Caldera ... 14
2.5.4 Pyroclastic deltas in Montserrat... 15
2.6 Modelling Pyroclastic Flows ... 16
2.6.1 Flume Experiments ... 17
2.6.2 PDC simulator at Massey University ... 18
2.6.3 Simulating the Mount Peleé Eruption of 1902 ... 19
2.6.4 Simulating tsunamis generated by PDCs ... 20
2.7 Conclusion ... 22
Chapter 3 – NZ Case Studies ... 23
3.1 Introduction ... 23
3.2 Methods ... 23
3.2.1 Site Investigation ... 24
3.2.2 SEM Imaging ... 25
3.2.3 Grainsize by Laser Diffraction Particle Size Analysis ... 25
3.2.4 Grainsize by Dry Sieving ... 26
3.3 Rotoiti Ignimbrite along the Bay of Plenty Coast... 26
3.3.1 Site 1A: Pacific Coast Highway ... 28
3.3.2 Site 1B: Mimiha Road ... 32
3.3.3 Grainsize and Textural Analysis ... 33
3.4 Ongatiti Ignimbrite in the Waiuku Inlet ... 34
3.4.1 Site 2: Glenbrook Beach ... 35
3.4.2 Grainsize and Textural Analysis ... 40
3.5 Ongatiti Ignimbrite in Kawhia ... 42
3.6 Conclusion ... 45
Chapter 4 – Experimental Studies ... 46
4.1 Introduction ... 46
4.2 Methods ... 46
4.2.1 Flume ... 47
4.3 Desktop Analysis of the Bay of Plenty Coastline ... 49
4.4 Column Collapse Experiment ... 50
4.4.1 Column Collapse Results ... 50
4.5 Dam Break Experiment ... 54
4.5.1 Dam Break Results ... 55
4.6 Obstruction Run ... 57
4.7 Conclusion ... 59
Chapter 5 - Discussion ... 61
5.1 Introduction ... 61
5.2 Case Studies ... 61
5.2.1 Flows Approaching the Sea ... 61
5.2.2 Flows Entering the Sea... 63
5.3 Experimental Studies ... 65
5.4 Connecting Field Observations to Experimental Studies ... 67
5.5 Cascading Hazards ... 68
5.6 Limitations ... 69
5.7 Further Research ... 69
Chapter 6 - Conclusion ... 71
References... 73
Appendices ... 80
Appendix 1 – Dry Sieving ... 81
Appendix 2 – Laser Particle Diffraction Analysis ... 85
Appendix 3 – Desktop Analysis for Slope ... 86
Appendix 4 – Experimental Raw Data ... 88
List of Figures
Figure 2.1 – Volcanic centres of North Island, New Zealand (GNS Science, n.d.). ...6 Figure 2.2 – Map showing extent of Ongatiti from the MVC (Cooper & Wilson, 2014). ...8 Figure 2.3 - Sketch of primary monomagmatic volcaniclastic turbidite (Schneider et al., 2001). 10 Figure 2.4 - Map showing extent of the Rotoehu ash and Rotoiti ignimbrite sourced from OVC (Hopkins et al., 2021). ... 11 Figure 2.5 - Sketch of the emplacement process of pyroclastic flows transitioning into the sea and into turbidity currents (Mandeville et al., 1996). ... 13 Figure 2.6 – Map showing location of the Tar River and White River deltas in Montserrat (Google, n.d.-a) ... 16 Figure 2.7 – Diagram of flume tank used for turbidity current experiments (Khavasi et al., 2012).
... 17 Figure 2.8 – Schematic diagram of the PELE facility used for pyroclastic flow simulations (Lube et al., 2015). ... 18 Figure 2.9 – Results of the 1902 Mount Peleé pyroclastic flow simulation produced (Gueugneau et al., 2020). ... 20 Figure 2.10 – A schematic diagram of the different mechanisms associated with pyroclastic flows entering the sea (Watts & Waythomas, 2003). ... 21 Figure 3.1 - Map showing locations of case studies observed in the field (Google, n.d.-d). ... 24 Figure 3.2 – Composite stratigraphic column of the Rotoiti Breccia (Burt et al., 1998). ... 27 Figure 3.3 – Map showing locations of Site 1A and Site 1B visited for this field study (Google, n.d.-e). ... 28 Figure 3.4 – Photographic image of a large-scale deposit of Rotoiti Ignimbrite observed from Pikowai Campground along the Pacific Coast Highway [37o51’24.11” S / 176039’56.78” E]. ... 29 Figure 3.5 – Stratigraphic column of the lower unit of the Rotoiti ignimbrite observed at Site 1A.
... 30 Figure 3.6 – Photograph of the lower portion of the Rotoiti ignimbrite at Site 1A. PCZ = pumice concentration zone. ... 31
Figure 3.7 – Photograph of the entire outcrop observed at Site 1B (Mimiha Road). ... 32 Figure 3.8 – Close up image of crossbedding within the Rotoiti Ignimbrite at Site 1B. ... 33 Figure 3.9 – Scatter plot of the grain size distribution of Sample 1 collected from Site 1A. ... 33 Figure 3.10 – (a) SEM image of a pumice particle from Sample 1 collected at Site 1A, (b) SEM image of pumice vesicles from Sample 1 collected at Site 1A, (c) SEM image of fine ash particles and blocky crystals from Sample 1 collected at Site 1A, including small pumice fragments and lithics. ... 34 Figure 3.11 - Map showing location of Site 2 along Glenbrook Beach (Google, n.d.-b). ... 35 Figure 3.12 - Stratigraphic column of Ongatiti Ignimbrite showing multiple flow units and underlying and overlying sedimentary units at Site 2 ... 36 Figure 3.13 - Sketch of outcrop observed at Site 2. ... 37 Figure 3.14 – (a) Photograph of load casts observed along the contact of mud Unit 4 and base of ignimbrite Unit 1 at Site 2, (b) Photograph of dewatering structures observed within ignimbrite Unit 1 (lower) at Site 2, (c) Photograph of convoluted laminae observed within ignimbrite Unit 1.
... 38 Figure 3.15 - Photograph of ignimbrite Unit 1 (upper) showing the contact between very coarse ash and pumice unit. ... 39 Figure 3.16 - Photograph of ignimbrite Unit 2 (lower) at Site 2. ... 39 Figure 3.17 - a) SEM image of pumice particles within Sample 3 collected at Site 2, b) SEM image of angular particles (crystals, lithics) within Sample 4 collected at Site 2, c) SEM image of pumice particle within Sample 4 collected at Site 2, d) SEM image of pumice... 40 Figure 3.18 - Scatter plot of the grain size distribution of Sample 13 collected near Site 2, along Glenbrook Beach. ... 41 Figure 3.19 - Grain size distribution using laser diffraction particle analysis on Samples 3-5 and Samples 10-11 collected from Site 2. ... 41 Figure 3.20 - Map showing location of Site 3 (Google, n.d.-c). ... 43 Figure 3.21 - a) Photograph of pumice, lithics, and mottle components within the Ongatiti unit observed at Site 3, b) Photograph of large-scale deposits of the Ongatiti Ignimbrite at Site 3. .... 44 Figure 3.22 - Scatter plot of the grain size distribution of Sample 20 collected near Site 3. ... 45 Figure 4.1 – Diagram of wavemaker flume tank used for the experiments. ... 48
Figure 4.2 – Diagram of the flume tank with the dam insert used for the dam-break flow experiments. ... 48 Figure 4.3 – Diagram of the flume tank with the PVC column used for the ash collapse experiments. ... 48 Figure 4.4 - Map of approximate cross-section area used for experimental basis (birds eye view) (Bay of Plenty Regional Council, n.d.). ... 50 Figure 4.5 –Timeseries images of the underwater current produced during experimental Run 1.1.
... 51 Figure 4.6 - Timeseries images of the cloud produced during experimental Run 1.1. ... 52 Figure 4.7 –Timeseries images of the underwater current produced during experimental Run 1.2.
... 53 Figure 4.8 – Timeseries images of the cloud produced during experimental Run 1.2. ... 53 Figure 4.9 – Graph of current length versus current height for underwater currents from Runs 1.1 to 1.3. ... 54 Figure 4.10 – Timeseries images of the current produced during experimental Run 2.1. ... 55 Figure 4.11 – Timeseries images of the cloud produced during experimental Run 2.2 ... 56 Figure 4.12 - Graph of current length versus current height for underwater currents from Runs 2.1- 2.2 ... 56 Figure 4.13 – Photograph of ash remaining on slope above the water line during experiment .... 57 Figure 4.14 – Timeseries images of the underwater moving around an obstruction in experimental Run 3.1 (birds eye view). ... 58 Figure 4.15 – Timeseries of the underwater current moving past an obstruction in experimental Run 3.1 (side view). ... 59 Figure 4.16 – Photograph of layers deposited by all six experimental runs... 59 Figure 5.1 – Schematic diagram of pyroclastic flows entering the sea at a low angle of incidence (Cas & Wright, 1991). ... 63 Figure 5.2 – Sketch of load structures described by (Tinterri et al., 2016) ... 64
List of Tables
Table 2.1 - Characteristics, deposition, and emplacement process descriptions of different flow units associated with the 7.3 Ka Kikai caldera, Japan eruption compiled from (Maeno & Taniguchi, 2007)... 14 Table 2.2 - Different eruptions associated with the Tar River delta in Montserrat, notes compiled from (Hart et al., 2004). ... 15 Table 2.3 - Different eruptions associated with the White River delta in Montserrat, notes compiled from (Hart et al., 2004). ... 15 Table 2.4 - Parameters of pyroclastic flows from adopted eruptions, notes compiled from (Novikova et al., 2011). ... 22 Table 3.1 - Median, mean, and sorting values for samples 3-5 and 10-11 collected from Site 2. 42 Table 4.1 - Table displaying the depths, distances, and slopes within the Bay of Plenty Northeast of Mimiha Road using data provided by the Bay of Plenty Regional Council. ... 49 Table 4.2 - Descriptive statistics of all the three underwater currents from runs 1.1 to 1.3. ... 54 Table 4.3 - Descriptive statistics of the two underwater currents from runs 2.1 and 2.2 ... 57
Chapter 1 Introduction
1.1 Background
Pyroclastic density currents (PDCs) are one of the most catastrophic volcanic hazards. PDCs can travel at speeds up to 700 km/h, transporting gas and volcanic material of temperatures at up to 800oC, altering the land they interact with. These violent currents pose great hazards to all that surround their volcanic centre, with many of those volcanic centres being in coastal and island settings. Pyroclastic density currents entering the sea is a rarely observed but impactful phenomenon. Just like PDCs on land, the commonality and destructiveness associated with these currents hinder our full understanding of their dynamics and behaviour.
One major gap in knowledge on PDCs entering the sea is whether these submarine currents behave similarly to those in subaerial environments; alongside this, what are the physical characteristics of the PDCs that drive these differences. It is known that subaerial PDCs behave differently based on their particle concentration, flow volume, and surrounding topography. These characteristics can determine how fast or far a flow can travel, which can determine the extent of its destructiveness.
New Zealand resides on the continental setting known as Zealandia which straddles the Indo- Australian Plate and Pacific Plate boundary. With that, the geological evolution of New Zealand is a complex and dynamic product of tectonic and volcanic activity. New Zealand is well-known for its volcanism, from historic accounts of the 25.5 ka Oruanui super-eruption at the Taupo Volcanic Centre (Bemmels et al., 2022) and recent accounts such as the 2019 Whakaari eruption. Many eruption events that have taken place within New Zealand were explosive eruptions generating PDCs, with some of those entering the sea. These instances are pre-historic with no known recent events recorded. Due to this, many of these events only preserve records that stop at the shoreline. The coastal environment is also a complex setting, with many areas experiencing high rates of change due to high energy erosional and depositional conditions.
To better understand New Zealand specific events of PDCs entering the sea, field studies of pre-historic deposits and their potentially unique characteristics are informative, as well as experimental studies on simulations of flows entering the water and their potentially unique behaviour. Engaging in both field and experimental studies will advance our knowledge and aid in future volcanic and coastal hazard assessments.
1.2 Aim and Objectives
The aim of this thesis was to determine specific PDC processes as they pass the coastline and enter the sea in the New Zealand setting by linking field and experimental studies. The objectives developed to achieve the aims of this thesis were:
• Identify and describe the characteristics and components of ignimbrites near the New Zealand coast,
• Observe and describe the characteristics and components of pyroclastic-ash laden PDCs on crossing air-water interface and continuing underwater,
• Determine the physical processes of PDCs entering the sea, by reconciling field and laboratory findings and apply to the New Zealand context.
1.3 Methods
The methods undertaken to achieve the objectives of this thesis include field and laboratory case studies and laboratory experiments. Four sites around North Island, New Zealand with pyroclastic flow outcrops were explored, including outcrop sketching, stratigraphic logging, sample collection, photographic collection, and note taking. Samples collected from the field were brought to the laboratory for analysis. Laboratory analysis methods include grain size through dry sieving, laser diffraction particle size analysis, and scanning electron microscopy (SEM) imaging. Several experiments were undertaken using a flume to simulate pyroclastic ash-laden PDCs underwater. Detailed descriptions of the methodologies used for both the field and laboratory portion of this project can be found within Chapters 3 and 4.
1.4 Outline
Chapter 2 is a literature review that covers PDCs and ignimbrites, turbidity currents, volcanism in New Zealand, and in a global context with several examples or occurrences of
pyroclastic flows entering the sea. Chapter 2 also reviews literature that covers physical and computational modelling of PDCs alone, into the sea, and turbidity currents.
Chapter 3 covers case studies of ignimbrites around New Zealand that are near the coastal environment. Case study areas include the Bay of Plenty coast, Kawhia, and Waiuku. Chapter 3 describes observations made at each site and results from laboratory analysis. Background information relating to the study area and ignimbrite are reviewed, methods used in the field and laboratory are described, and results from both the site investigation and laboratory analysis are presented.
Chapter 4 covers experimental studies carried out in a flume tank using pyroclastic ash material collected from the field. The location basis of the experiment is discussed, methods used to simulate a flow in a flume are described, limitations of the experiment are discussed, and the results of various runs are presented.
Chapter 5 is a discussion on the results from the case studies, experimental studies, and an interpretation on how aspects from both studies may connect. Further discussion is made about associated hazards and potential effects to the coastal environment from pyroclastic flows entering the sea. Recommendations for future research are also given.
Chapter 6 is a conclusion on the key findings from the discussion.
Chapter 2
Literature Review
2.1 Introduction
Chapter 2 is a review on literature relevant to the topic of this thesis. The chapter begins with an overview on volcanism, with attention to PDCs and ignimbrites, and an overview on plumes and turbidity currents. These topics tie into the distinct process of PDCs travelling into the sea. The chapter will then discuss several examples of this process occurring in New Zealand and around the world. Finally, the chapter reviews computational and laboratory studies on the entry of PDCs into sea, or water.
2.2 Pyroclastic Flows and Ignimbrites
Pyroclastic density currents are ground-hugging mixtures of hot ash, gas and pyroclasts produced from explosive volcanic eruptions (e.g., Palladino, 2017). These currents are typically generated from an eruption plume collapse. When an explosive volcanic eruption occurs, a vertical column of volcanic material known as an eruption plume disperses volcanic material into the atmosphere. When the density of the vertical column exceeds the density of the surrounding atmosphere the eruption column will collapse, creating a gravity driven current known as a pyroclastic density current. Other generation mechanisms for PDCs include dome collapse, direct blasts, or boiling over (Palladino, 2017). PDCs are known for their highly destructive behaviour and are considered to be one of the most hazardous natural phenomena, with temperatures reaching up to 800oC and speeds up to 700 km/h. PDCs can be broken into two end member types based on particle concentration: pyroclastic flows and pyroclastic surges. Pyroclastic flows are long-lived steady currents with a high particle concentration. Pyroclastic surges are short-lived turbulent currents with a low particle concentration (Wohletz & Sheridan, 1979). This difference in particle concentration can affect how they transport and deposit material. Pyroclastic surges deposit material through suspended sedimentation across the landscape including along hills and ridges, while pyroclastic flows deposit material as a concentrated dispersion through valleys, rivers, and channels (Browne & Gardner, 2005). The material deposited by pumice-rich pyroclastic
flows is known as an ignimbrite. Ignimbrites can be found as unconsolidated material (non- welded) or consolidated (welded) rock. Welded ignimbrites are produced when the material is hotter than 535oC. High temperatures enable the ash and rock to compact and meld together. Both consolidated and unconsolidated ignimbrites are primarily composed of volcanic ash, pumice, and lithics (USGS, 2019).
2.3 Plumes & Turbidity Currents
A plume, also known as a column, can occur in several geological or environmental settings.
Examples of vertical columns include volcanic plumes, hydrothermal plumes, submarine plumes, and lake plumes (Woods, 2009). Examples of horizontal columns include river plumes and turbidity currents. These examples represent the dynamic environmental process of a flow or fluidal body moving through another. Plumes come in a range of shapes and sizes, encompassing different physical phases, but those relevant to this paper are horizontal turbulent columns affected by density differences within dry land and coastal sea environments, i.e., density currents.
Horizontal plumes are classified based on their particle concentration. Dilute river plumes are long-lived density currents that occur at the coastal ocean zone where a river meets the sea (Woods, 2009). River plumes introduce a flux of sediment from the terrestrial environment to the shallow marine. This introduction of particle-laden freshwater into a typically stratified saltwater setting promotes mixing, which can influence coastal dynamic processes and ecosystems. Turbidity currents are seafloor-hugging flows of a high concentration driven by density differences of suspended sediment (Hage et al., 2019).
Turbidity currents bring sediment from the terrestrial and shallow marine environment to the deep marine. Generation mechanisms for turbidity currents include slope failures (e.g., slips and slides), or river plumes breaking a sediment concentration threshold, occasionally known as a plunging hyperpycnal flow (Hage et al., 2019).
As mentioned, PDCs are high concentration gas-particulate flows that transport hot pyroclasts (e.g., pumice, glass shards, lithics, crystals) and gas at high speeds over great distances. These significant flows heavily modify the geomorphology and surface features of
their surrounding environment. Similarly, the behaviour of large-scale river plumes and marine turbidity currents permit modification to their surrounding subaqueous environment.
2.4 New Zealand Volcanism
The North Island of New Zealand experiences frequent volcanic activity, and much of North Island geology is of volcanic origin. New Zealand extends over the Australian-Pacific plate boundary. Along the west coast of the South Island is a transform boundary, known as the Alpine Fault. To the east of the North Island is a convergent boundary, known as the Hikurangi-Kermadec Trench, where the Australian plate is subducting under the Pacific plate. This subduction zone is what controls the various volcanic arcs of the North Island, of which the Taupo Volcanic Zone (TVZ) has been the most active in recent times. This zone extends from Mount Ruapehu in the southwest, to Whakaari, also known as White Island in the northeast as shown in Figure 2.1. (GNS Science, n.d.). The TVZ is famously known for producing explosive pyroclastic eruptions, such as the 25.5 ka Oruanui eruption of the Taupo Volcanic Centre (Bemmels et al., 2022). This eruption deposited approximately 320 km3 of pyroclastic flow deposits and 420 km3 of fall deposits, reaching many regions of New Zealand and other countries (Manville & Wilson, 2010).
Figure 2.1 – Volcanic centres of North Island, New Zealand (GNS Science, n.d.).
Three examples within New Zealand are reviewed here, 1) the Ongatiti Ignimbrite, 2) volcaniclastic turbidities at Mahia Peninsula, and 3) the Rotoiti Ignimbrite. The Ongatiti Ignimbrite and Rotoiti Ignimbrite are both products of significant historic volcanic eruptions that have spread pyroclastic material across the North Island and coastlines. The case study at Mahia is a unique case of historic PDCs transitioning into subaqueous turbidity currents.
2.4.1 Ongatiti Ignimbrite
The Waiuku Tephra and Ongatiti Ignimbrite are both deposits generated from pyroclastic density currents originating from the Mangakino Volcanic Centre (MVC) of the TVZ. The MVC is the oldest rhyolitic caldera volcano in the TVZ. The largest eruptions generated from the MVC occurred during 1.68 to 1.53 Ma and 1.12 to 0.95 Ma which produced voluminous pyroclastic flows and falls that travelled all around the North Island, New Zealand, and deposited material as far as the east (e.g., Bay of Plenty, Hawkes Bay) and west coast (e.g., Port Waikato), several hundred kilometres away from source (Krippner et al., 2010). Both the Waiuku Tephra and Ongatiti Ignimbrite have been found in the Port Waikato region. The Ongatiti Ignimbrite has also been identified as the Oparau Tephra in the Kawhia region.
The Waiuku Tephra dated 1.00 ± 0.03 Ma (Alloway et al., 2010) is a correlative tephra of the Kidnappers Ignimbrite. The Waiuku Tephra has been identified at several locations, but the focus here is on the three- to nine-metre-thick deposits found at Mission Bush and the southeast region of the Waiuku River inlet. Here the Waiuku Tephra has been described as two units: (1) an upper flow unit and (2) lower surge unit. The upper flow unit presents a transitional material, reflecting the transition of a hot, gas-supported flow into a cooler, water-supported flow (Alloway et al., 2010), described as a hyper-concentrated flow deposit.
A hyper-concentrated flow, in this case, is described as an intermediate flow or deposit that typically consists of both water and volcaniclastic material. Moreover, it is a transitional process distinct from debris flows and water-stream flows (Pierson, 2005). The lower surge unit is stratified with three distinct subunits, a basal subunit and two overlying cross-bedded horizons with local dune structures. Between the basal subunit and overlying subunits are flame structures or water escape structures. This suggests that the hot surge travelled over a wet ground which resulted in rapid cooling and transitioning from a degassing process to a
dewatering process (Alloway et al., 2010). Rip-up clasts and charred wood have also been noted within the surge unit.
The Ongatiti Ignimbrite has been dated at 1.21 ± 0.09 Ma (Houghton et al. 1995). It is one of the largest, by volume, ignimbrites from the MVC, therefore it has been identified in many areas of the Waikato and Auckland region. The focus here is the 3.8 m thick deposit found at Glenbrook Beach. Glenbrook Beach is located on the west side of the Waiuku River inlet.
The Ongatiti Ignimbrite has also been described as two units: (1) lower volcaniclastic mass flow unit and (2) upper redeposited unit. The lower volcaniclastic mass flow unit includes de-watering structures amongst pinkish grey, poorly sorted, massive, pumice-rich, coarse sandy ash. The Ongatiti Ignimbrite shows no evidence of a surge-like unit, unlike the Waiuku Tephra (Alloway et al., 2010). The Oparau Tephra is a correlative tephra of the Ongatiti Ignimbrite found in the Kawhia district. The Oparau tephra has been described as a massive greyish white unit that is strongly weathered (Kirkman, 2012). The extent of the Ongatiti Ignimbrite across the North of Island can be seen in Figure 2.2 below.
Figure 2.2 – Map showing extent of Ongatiti from the MVC (Cooper & Wilson, 2014).
2.4.2 Volcaniclastic Turbidities at Mahia Peninsula
The Mahia Peninsula is located along the eastern margin of the North Island, extending seaward between Poverty Bay and Hawke Bay. Volcaniclastic turbidities are sea-bottom deposits from turbidity currents composed of volcaniclastic material. Volcaniclastic material includes all clastic or fragmented volcanic particles regardless of their fragmentation process (e.g., pyroclastic, hydroclastic). Several volcanoclastic turbidities from the Miocene Epoch occur in the Mahia Peninsula. Schneider et al. (2001) looked at these different turbidities with the aim to distinguish the deposits and their origin.
The volcaniclastic turbidities found within the marine Miocene deposits at Mahia were broken up into three categories: (1) primary monomagmatic turbidites, (2) secondary monomagmatic turbidites, and (3) secondary multimagmatic turbidites (Schneider et al., 2001). These Miocene volcanic deposits are products from the Coromandel Volcanic Zone (CVZ). Fission-track ages have dated the deposits at 9 to 7.2 Ma which coincides with the beginning of rhyolitic volcanism in the CVZ, around 10 to 7 Ma (Shane et al., 1998). The primary monomagmatic turbidites are a result of subaerial pyroclastic flows entering the sea, transforming the flow into a subaqueous gravity flow. The primary monomagmatic turbidites are composed of magmatic and phreatomagmatic particles. The secondary monomagmatic turbidites are a result of successive eruptions reworking some of the already deposited volcaniclastic material. These are composed of the same magmatic material as the primary turbidites but contain no phreatomagmatic particles. The secondary multimagmatic turbidites are a result of remobilization of volcaniclastic material from multiple eruptions events and differ from the monomagmatic turbidites as they are composed of a heterogenous composition while the monogenetic turbidites are largely homogenous in their vitric and crystal components (Schneider et al., 2001). Moreover, there are no phreatomagmatic particles in the secondary multimagmatic turbidites.
The dynamics of the pyroclastic flows that produced these mono- and multimagmatic turbidites are quite unique. For the primary monomagmatic turbidites, Schneider et al. (2001) have suggested that movement of the pyroclastic flow into the sea would have generated steam explosions from the hot, particle-water interaction prompting secondary hydroclastic quenching. The mix of steam explosions and flows entering the sea leads to the replacement
of gas with water within the flow. This process increases the density of the flow, transforming the subaerial pyroclastic flow into a subaqueous volcaniclastic gravity flow. Figure 2.3 below displays a sketch of a primary monomagmatic volcaniclastic turbidite.
Figure 2.3 - Sketch of primary monomagmatic volcaniclastic turbidite (Schneider et al., 2001).
2.4.3 Rotoiti Ignimbrite
The Rotoiti Ignimbrite, also known as the Rotoiti Breccia, is a non-welded rhyolitic ignimbrite and the most recent major ignimbrite from the Haroharo Caldera complex of the Okataina Volcanic Centre (Walker, 1979). This covers an approximate area of 850 km2 (Schmitz & Smith, 2004). The estimated, and commonly accepted, age of this deposit is 45.2
± 8.2 ka (Buhay et al., 1992), but Wilson et al. (2010) have suggested an older age of 64 ± 4 ka. Therefore, the absolute age of this deposit remains controversial. The Rotoiti Ignimbrite is unique as it stretches more than 30 km north from the Haroharo complex towards the Bay of Plenty coast (Walker, 1979). The ignimbrite is comprised of several flow units that total an approximate thickness of 50 to 100 m (Nairn, 1981). The thickness of the ignimbrite varies locally, but generally the deposit is thickest near source and thins towards shore. The deposit extends a 10 km front along the Bay of Plenty coast, between Matata and Maketu townships (Walker, 1979). The ignimbrite has been described as a loosely compacted pumice breccia with interstratified ash bed units, known as the Rotoehu Ash (Nairn, 2012). The Rotoehu Ash is a widely dispersed rhyolitic ash deposit (Hopkins et al., 2021). The extent of these deposits can be found in Figure 2.4.
Figure 2.4 - Map showing extent of the Rotoehu ash and Rotoiti ignimbrite sourced from OVC (Hopkins et al., 2021).
2.5 Global Examples of Pyroclastic Flows Entering the Sea
Globally, there have been approximately 1,400 different active volcanoes in the past 10,000 years (Smithsonian Institution, 2022). Volcanoes commonly occur along or near convergent or divergent plate boundaries, and less commonly in hot spot regions, but many volcanoes globally exist in submarine settings. Explosive volcanism producing pyroclastic density currents with the potential to flow into the sea can occur in any of these regions if there is an active volcanic area and a marine basin within reasonable proximity. Four examples are reviewed here, (1) Green Tuff, (2) Krakatau, (3) Kikai Caldera, and (4) Montserrat. These examples present different scenarios of pyroclastic flows entering the sea under different processes.
2.5.1 Green Tuff of the Pantelleria Trough
The Green Tuff is a product of a large explosive eruption from the complex stratovolcano, Pantelleria Island. The Green Tuff has been given a radiocarbon age range of 43 to 47 ± 2 ka, making it the youngest major eruption of Pantelleria, producing a 20 m thick ignimbrite,
and covering almost the entire island and surrounding Ionian Sea. The total estimated area is 85 km2. Anastasakis and Pe-Piper (2006) focused on a volcaniclastic interval found 12 m below the floor of Pantelleria Trough, located southeast of Pantelleria Island. The study identified this volcaniclastic deposit formed as a result of a pyroclastic flow from the major eruption travelling into the sea which is consistent with the Green Tuff. The volcaniclastic interval is 18 m thick consisting of three major parts: (1) lower massive unit, (2) middle massive unit, and (3) turbidite unit (Anastasakis & Pe-Piper, 2006). The lower and middle units were the result of hyper-concentrated flows, or cool water-saturated flows, transformed from hot-gaseous pyroclastic flows which occurred when the pyroclastic flow entered the sea. Both massive units are fine grained and poorly sorted. These hyper-concentrated flows were high density flows with suppressed turbulence but sufficient energy to travel over 40 km. The lower unit has a low biogenic content suggesting the unit had flowed into the trough from the Pantelleria fault valley. The upper unit has a much higher biogenic content suggesting a different flow path through potentially more varied terrain contributing to the increased biogenic content. The turbidite unit is well sorted with strong grain size gradation suggesting a single turbidity current flow developed from the co-ignimbrite ash cloud (Anastasakis & Pe-Piper, 2006).
2.5.2 Krakatau
Krakatau volcano is a predominately submerged caldera erecting three islands along the rim, located in the Sunda Strait, Indonesia. Krakatau volcano is well-known for its 1883 eruption, which has been considered one of the most violent volcanic eruptions in recorded history (Agustan et al., 2012). This event in its entirety was quite complex and distinct due to different dramatic phases, including the production of several large tsunamis and mud rain.
May 20, 1883 was the most explosive eruption phase, which generated several subaqueous pyroclastic flows and surges that flowed over and into the surrounding sea, travelling at speeds >100 km/h and extending distances up to 80 km from the caldera (Carey et al., 1996).
This phase formed the present-day caldera and small island group. The flows and surges from this phase affected a total area of 4,000 km2, including the nearby islands of Sebesi, Sebuku and Legoendi, as well as the south coast of Sumatra and north coast of Java. Most deposits found at these nearby locations are a result of the pyroclastic flows that travelled over the sea. Carey et al. (1996) suggests those flows were able to travel over the sea due to high
temperatures vaporizing the water below, expanding the flow, increasing the turbulence, and decreasing the friction of the flow, allowing them to continue travelling at high speeds and decreased deposition rates. This suggestion is supported by the textural characteristics of the deposits being comparable to flow deposits rather than fall deposits (Carey et al., 1996). The thickest deposits are largely subaqueous, found within a 15 km radius of the caldera from subaerial flows travelling directly into the sea to depths of 40 m below sea level (Mandeville et al., 1996). These deposits have been mostly described as a massive, poorly sorted unit composed of lapilli to block sized pumice and lithics with a silty to sandy ash matrix.
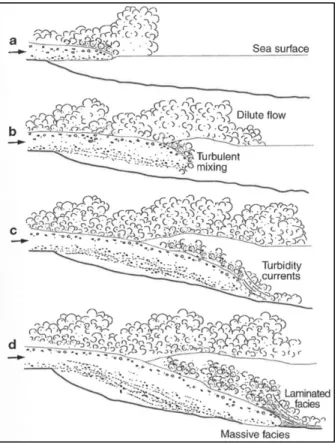
Another, less common deposit has been described as a laminated, well sorted unit composed of vitric-enriched silty ash (Mandeville et al., 1996). Both deposits have been described as representing the basal components of the flow. Initially, the subaerial flows travelled over the sea but later sunk due to water-saturation and cooling transitioning into a high- concentration turbidity current which deposited as a poorly sorted massive unit. The laminated facies were deposited from more dilute, low-concentrated density currents generated from the shear stress along the flow boundary. Figure 2.5 below is a sketch that portrays the emplacement process for the described deposits of the Krakatau example.
Figure 2.5 - Sketch of the emplacement process of pyroclastic flows transitioning into the sea and into turbidity currents (Mandeville et al., 1996).
2.5.3 Kikai Caldera
Kikai caldera is found on the north end of the Ryuku Islands, Japan. Kikai caldera was formed from one of the largest volcanic eruptions of the Holocene, occurring 7.3 ka, with a volcanic explosivity index (VEI) value of 7 out of 8. This eruption produced four major units (a) plinian fallout, (b) intraplinian pyroclastic flows, (c) climatic pyroclastic flows, and (d) co- ignimbrite fall. Kikai caldera is a mostly submerged caldera approximately 17 km wide and 20 km long exposed subaerially as two islands along the rim. Maeno and Taniguchi (2007) explore deposits on these two islands to interpret the processes of the 7.3 ka eruption. Unit C, representing the climatic pyroclastic flows, marks the start of magma-water interaction.
The study suggests that these flows behaved similarly to those at Krakatau, with voluminous pyroclastic flows travelling into and over the sea. Unit C has been broken into three sub-units C1, C2 and C3. Moreover, C3 has been further broken into C3a, C3b and C3c due to lateral variations, marking the start of the caldera collapse. Table 2.1 describes the different characteristics and suggested emplacement processes for Unit C (Maeno & Taniguchi, 2007).
Table 2.1 - Characteristics, deposition, and emplacement process descriptions of different flow units associated with the 7.3 Ka Kikai caldera, Japan eruption compiled from (Maeno & Taniguchi, 2007).
Unit Description Depositional Setting Emplacement Process
C1 Non-welded, mostly stratified facies, lithic-rich, fines-poor, inverse to normal grading (~5 m thick)
Topographic lows, proximal areas
Segregated dense flows
C2 Weakly welded, stratified faces, lithic-rich (>5 m thick)
Topographic lows, proximal areas
Ash and pumice rich flows
C3a Massive, extremely fines-poor, lithic rich (up to ~10 m thick)
Near-vent area Flow over sea
C3b Massive, lithic-rich layer (~a few metres thick)
Near-vent to distal areas Flow into sea
C3c Massive, pumice-ash rich layer (up to 30 m thick)
Higher elevations, distal areas Initial dilute, stratified flow into an expanded, turbulent flow over sea
Crystal content increases, Lithic content decreases
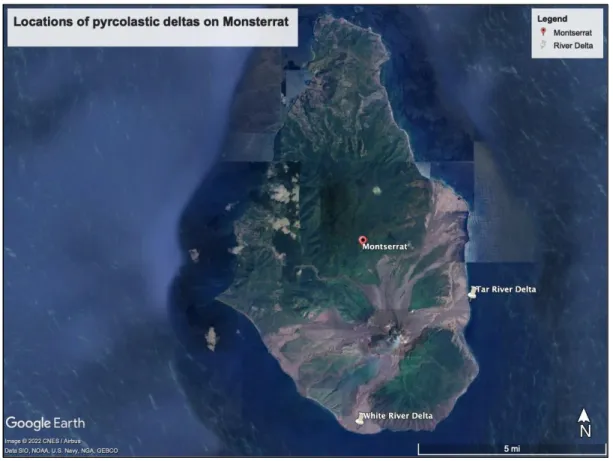
2.5.4 Pyroclastic deltas in Montserrat
Soufriere Hills volcano is a stratovolcano complex that is located on the southern portion of Montserrat Island, West Indies. This volcano has been quite active in recent times, with its most recent eruption occurring in 2013. From November 1995 to July 1998, numerous explosive eruptions of the Soufriere Hills volcano, Montserrat produced pyroclastic flows.
Many of these pyroclastic flows reached the coast and flowed into the sea, resulting in the production of two pyroclastic deltas at the Tar and White River deltas. Table 2.2 and Table 2.3 share details of those numerous eruptions and their contribution to the development of the deltas.
Table 2.2 - Different eruptions associated with the Tar River delta in Montserrat, notes compiled from (Hart et al., 2004).
Date Volume of material deposited in the sea (DRE) Notes
12-May-96 N/A Pyroclastic flow entered the sea
28-Jul-96 N/A Partial dome collapse event
12-Aug-96 N/A Partial dome collapse event
3-Sep-96 N/A Partial dome collapse event
17-Sep-96 ~5.2x10⁶ m3 Large collapse events that entered the sea
16-Jan-97 N/A Partial dome collapse event with large
pyroclastic flows
20-Jan-97 N/A Partial dome collapse event with large
pyroclastic flows 3-Jul-98 6x10⁶ m3 to the delta 10x106 m3 outside the delta Collapse event
Table 2.3 - Different eruptions associated with the White River delta in Montserrat, notes compiled from (Hart et al., 2004).
Date Volume of material deposited in the sea (DRE) Notes
Oct/Sept-97 N/A Pyroclastic flow entered the sea
4/6-Nov-97 6x10⁶ m3 to the delta Sustained collapses
26-Dec-97 ~60x106 m3 Major debris avalanche and PDC
Hart et al. (2004) compared historical bathymetry data with newly collected data to estimate the extent and volume of these flows. The main findings were that the influx of pyroclastic material added an extra area of 1 km2 to the island of Montserrat, with a total volume of 73x106m3 DRE (dense rock equivalent). The total areas (and volumes) of the Tar and White River deltas are 0.64 km2 (55x106 m3 DRE) and 0.46 km2 (18x106 m3 DRE) respectively
(Hart et al., 2004). Areas outside of the deltas that contain pyroclastic flow deposits cover an additional area of 6.25 km2. Although seemingly small, these flow deposits and deltas cover a large portion of the volcano and island. Figure 2.6 below is an aerial image of Montserrat Island from Google Earth, presenting the extent of the deltas (Google, n.d.-a).
Figure 2.6 – Map showing location of the Tar River and White River deltas in Montserrat (Google, n.d.-a)
Trofimovs et al. (2006) further investigated these pyroclastic deltas through core samples.
This study incorporated the more recent and largest 2003 eruption, which generated an additional deposition of 2.15x10⁶ m3 DRE into the sea. This eruption was generated from a dome collapse, like the 1996 to 1998 events, with two major phases, each phase producing large pyroclastic lobes. The cores revealed that the pyroclastic flows of the Soufriere Hills volcano mixed rapidly at the sea entrance depositing coarse, poorly sorted, fines-depleted material in proximal areas via hyper-concentrated flows, and finer, well-sorted material via turbidity currents with distance (Trofimovs et al., 2006).
2.6 Modelling Pyroclastic Flows
Modelling volcanic eruptions has become essential for volcanological studies in the past decade. Results gained from modelling volcanic eruptions give insight into the dynamics of
pyroclastic density currents, eruptive sequences, buried topography or bathymetry, eruption intensity, deposit lithologies, and cascading hazards. From numerical models to laboratory trials, various methods have been adopted by different researchers. Recent studies have helped improve our understanding of eruptions of the past, which in turn help us better prepare for potential eruptions in the future. Improving our understanding and preparation techniques has become increasingly important as the world has witnessed catastrophic events such as the 1980 Mount St. Helens eruption in the US, and the 1991 Mount Pinatubo eruption in the Philippines.
Alongside volcanic eruption and flow modelling, it is also relevant to consider experiments related to turbidity currents and plumes. Modelling turbidity currents in a laboratory can help to understand correlations between sediment size and sorting, and density current characteristics (e.g., size, behaviour).
2.6.1 Flume Experiments
One of the most common methods used to model gravity or density currents, specifically turbidity currents, is through laboratory experiments using a flume. Alongside those laboratory experiments, numerical and computational modelling can be used to support lab studies, as well as field observations. A flume tank is an artificial tank or channel, filled with water, accompanied with necessary components depending on the experiment. Example components include a slope, a supply tank holding the material for the current, a tube or pipe that feeds the material into the tank, an additional catch tank or outlet, and measuring devices.
Khavasi et al. (2012) generated turbidity currents in the lab using these components, as shown in Figure 2.7.
Figure 2.7 – Diagram of flume tank used for turbidity current experiments (Khavasi et al., 2012).
Other ways to feed material into a flume tank to simulate a current are through other gravity or density driven mechanisms. An example of this is using a vertical barrier, known as the
‘lock gate’ to separate the test material or water from the control or main water of the tank.
This method can be known as a lock exchange, or dam-break flow. Shin et al. (2004) generated gravity currents in a flume using the lock exchange method. In their experiment, two fluids, one being denser than the other were separated in a flume tank using a lock gate.
During the tests, the barrier was lifted, promoting the denser fluid to flow into the lighter fluid along the bottom the tank as a density current.
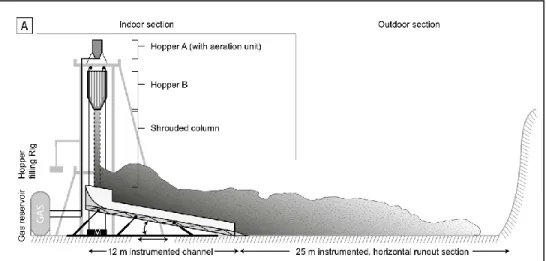
2.6.2 PDC simulator at Massey University
PELE (Pyroclastic flow eruption large-scale experiment) is an international eruption simulation facility located at Massey University in Palmerston North, New Zealand. PELE is used to study the dynamics of PDCs. This facility is unique as there are few experiments on pyroclastic density currents conducted at this scale. The research undertaken at the PELE facility outreaches studies conducted at other medium to large scale experiments around the world. PELE simulates pyroclastic density currents by producing a controlled gravitational collapse, simulating an eruption column collapse, consisting of hot gas and volcanic particles.
This is done by transporting the volcanic material in a vertical elevator to a vertical drop of 7 m height and travelling onto a 12 m long inclined channel and dispersed onto the ground (Brosch et al., 2021). These experiments have generated PDCs with speeds ranging from 7 to 30 m s-1 and run out distances >35 m (Lube et al., 2015). Figure 2.8 below presents a schematic diagram of PELE.
Figure 2.8 – Schematic diagram of the PELE facility used for pyroclastic flow simulations (Lube et al., 2015).
PELE can generate currents characteristic of both dilute surge-like PDCs and pyroclastic- flow like PDCs. The surge-like currents developed a thin basal layer overlain by a thick, turbulent suspension. The flow-like currents developed a thick basal layer overlain by a thinner upper ash cloud surge (Lube et al., 2015).
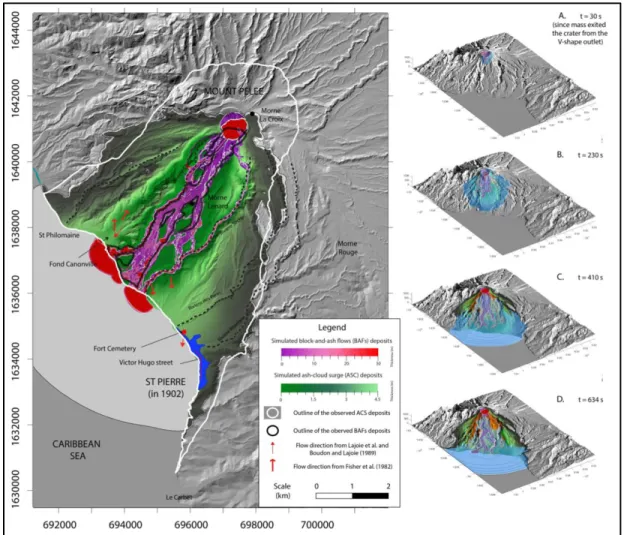
2.6.3 Simulating the Mount Peleé Eruption of 1902
On the 8th of May 1902, a major explosive eruption took place on Mount Peleé. This eruption produced pyroclastic density currents that killed almost 30,000 people and destroyed nearly the entire city of Saint Pierre (Gueugneau et al., 2020). This event was significant in initiating major studies on the behaviour of pyroclastic density currents. Since the event, several theories have been made about the types of currents produced from the eruption and how the dynamics of those currents were able to cause great destruction. Gueugneau et al. (2020) used the numerical model VolcFlow to simulate the pyroclastic density currents produced from the eruption. VolcFlow is geophysical modelling system used to reproduce the simulation of isothermal geophysical flows, like pyroclastic flows (Kelfoun & Vallejo Vargas, 2016). The parameters of the model were supported with data extracted from the field. The study found that a pyroclastic block-and-ash flow and associated ash-cloud surge were most likely to have been produced from the eruption, where the block-and-ash flow stayed confined to the local river valley system and the ash-cloud surge spread over a greater distance. Once the ash- cloud surge met the sea it spread laterally towards the northern plains and city of Saint Pierre.
One third of the total volume of the deposit from the currents was placed in the sea, a significant amount that has not been reported before. For the block-and-ash flow, the simulation showed once the flow entered the sea it produced large lobes. This is an error in the model as the sea surface is given an elevation of 0 m which causes a break in slope allowing the material to thicken at the break (Gueugneau et al., 2020). With the VolcFlow model it is challenging to simulate the behaviour of a flow into the sea, but the main findings are that an ash-cloud surge, a typically dilute current, will flow over the sea surface and spread, as described previously in this literature review. Figure 2.9 displays the most accurate simulation of the eruption based on field deposits.
Figure 2.9 – Results of the 1902 Mount Peleé pyroclastic flow simulation produced (Gueugneau et al., 2020).
2.6.4 Simulating tsunamis generated by PDCs
PDCs produced on islands or near coastal settings have the potential to flow into the sea.
When a PDC enters the sea, it is very possible for a wave to generate. A well-known and well-studied example as previously discussed is the 1883 Krakatau event, where a tsunami generated by a pyroclastic flow created more destruction than the eruption itself. Due to the energetic and dense nature of PDCs, significant water displacement or transfer of energy can occur when a flow enters the sea. Other generation mechanisms for tsunamis from PDCs include steam explosion, plume pressure, and plume shear (Watts & Waythomas, 2003).
Figure 2.10 demonstrates those different mechanisms.
Figure 2.10 – A schematic diagram of the different mechanisms associated with pyroclastic flows entering the sea (Watts & Waythomas, 2003).
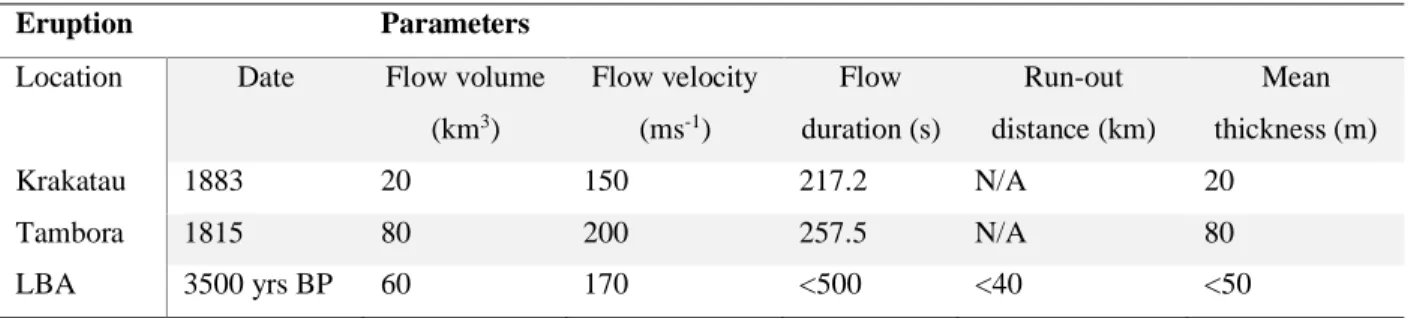
Examples of tsunamis generated by PDCs occurred during the Late Bronze Age Eruption (LBA) of Thera, Greece. Thera is an island in the Aegean Sea which is better known as the modern-day island of Santorini. The LBA eruption was a violent Plinian eruption that took place c. 3500 yrs BP. Sedimentary deposits found in proximity to the volcano have shown evidence of tsunami inundation and volcanic pumice produced from the eruption (Dominey- Howes, 2004). Novikova et al. (2011) modelled the tsunami using pyroclastic flows as the generation mechanism. The tsunami was simulated using the numerical model GEOWAVE which can simulate a variety of wavelengths with their resulting wave breaking and run-up.
The pyroclastic flows were modelled as solid blocks with dimensions of width, thickness, and length, producing a bulk density which enters the water with a given density and constant depth (Novikova et al., 2011). Parameters of the pyroclastic flow were adopted from other large, comparative eruptions (e.g., Krakatau 1883, Tambora 1815) shown in Table 2.4 below.
Table 2.4 - Parameters of pyroclastic flows from adopted eruptions, notes compiled from (Novikova et al., 2011).
Eruption Parameters
Location Date Flow volume
(km3)
Flow velocity (ms-1)
Flow duration (s)
Run-out distance (km)
Mean thickness (m)
Krakatau 1883 20 150 217.2 N/A 20
Tambora 1815 80 200 257.5 N/A 80
LBA 3500 yrs BP 60 170 <500 <40 <50
The results of the study showed that tsunamis generated from 50 m thick pyroclastic flows produced tsunamis up to 29 m in height, and inundation distances from 250 to 450 m on Crete, a Greek island located ~115 km south from Thera. Thinner pyroclastic flows (~1 m) produced smaller waves around 4 m (Novikova et al., 2011).
2.7 Conclusion
It is evident that the complex event of a PDC entering the sea is not uncommon. Through historic to present day events, this complexity has occurred in several areas of the world.
These events have caused significant change to the topography and bathymetry of coastal and island arc settings. The deposits produced from these events are different to typical ignimbrites as the dynamics of these flows are different than typical on-land, dry flows.
Scientific understanding of PDCs entering the sea has improved with study and time but there is still much to learn. Steam explosions, heightened fragmentation, and hyper-concentrated flows can all be generated from pyroclastic flow-water interaction. Decoupling or separation of a PDC entering the sea is common, as well as a change in flow velocity, shape, and components. These unique attributes have led to other related hazards with one example being tsunamis. A better understanding of PDCs entering into sea may aid in future volcanic monitoring and prediction of changes to coastal and oceanic settings, as well as volcanic hazard management.
Chapter 3 NZ Case Studies
3.1 Introduction
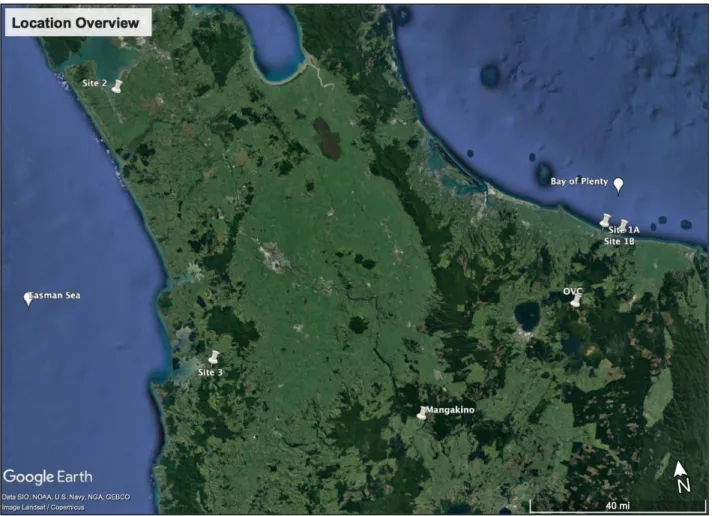
This chapter explores examples of PDCs in the field at four locations: (1A) Pacific Coast Highway, Bay of Plenty [37°50'30.80"S/176°37'36.42"E], (1B) Mimiha Road, near Matata, Bay of Plenty [37o52’04.21”S/176o41’34.35”E] (2) Glenbrook Beach, Waiuku township [37o09’58.27’S/174o43’12.23’E] and, (3) Kihi Road, Hauturu west of Kawhia harbour [38°5'37.77"S/174°56'12.90"E]. Along the Pacific Coast Highway, between Pukehina and Matata there are several road cutting outcrops and coastal cliffs exhibiting the Rotoiti Ignimbrite sourced from the Okataina Volcanic Centre (OVC). The Rotoiti Ignimbrite is also presented along Mimiha Road just off the Pacific Coast Highway. Along Glenbrook Beach beside the Waiuku River inlet is an outcrop exhibiting the Ongatiti Ignimbrite sourced from the Mangakino Volcanic Centre. Along Kihi Road, near Hauturu is a road cutting that also exhibits the Ongatiti Ignimbrite. Both ignimbrites are sourced from significant pyroclastic flows, that span over a great area of land before reaching the sea. The aim of the field studies is to characterize deposits with either unique pyroclastic flow-water interaction features, or of pyroclastic flows about to the enter the sea. These case studies are to provide local context to the experimental studies in Chapter 4.
3.2 Methods
The methods used include both field observations and sample collection on site, and laboratory analysis of the samples. Data recorded during laboratory analysis have been organized into spreadsheets. Figure 3.1 below shows a location overview of the four sites visited with respect to their volcanic source.
Figure 3.1 - Map showing locations of case studies observed in the field (Google, n.d.-d).
3.2.1 Site Investigation
Site visits took place on public land, therefore travel and access were within reach. At all locations, written notes were taken describing grain size, textural characteristics, components, and colour of the deposit with any notable features. Stratigraphic logs were also constructed, with support of photos and drawings using a digital camera. Approximately 2 kg samples of each unit were collected to later be studied in the lab. The tools utilized in the field included a measuring staff, a rock hammer, a hand lens, a handheld trowel, and a spade.
At Site 1A (Pacific Coast Highway) the rockface was logged, noting large-scale deposit structure. At Site 1B (Mimiha Road) photographs and notes were taken about the lower 8.5 m section of the Rotoiti Ignimbrite. The location of the outcrop at Site 2 was specified by Alloway et al. (2004) as the NZ Topographic Map Reference: R12 627 465 and was revisited for this study and a stratigraphic log was constructed. At Site 2 (Glenbrook Beach) a sketch
of the Ongatiti Ignimbrite (~5.5 m) was drawn. At Site 3 (Kihi Road) photographs and notes were taken of a 7 m section of the Oparau Tephra (local name for Ongatiti Ignimbrite).
3.2.2 SEM Imaging
Scanning electron microscopy (SEM) is a technique used to study a range of materials for science. An electron microscope uses a focused beam of high-energy electrons to generate signals at the surface of a solid specimen. The signals reveal information about the texture, morphology, composition, and crystalline structure of the specimen. This information is displayed in a greyscale image with magnification ranging from 20X to 30,000X (Swamp, n.d.). The instrument utilized for this project was a HITACHI S-4700 field emission SEM, at the University of Waikato, assisted by SEM specialist, Helen Turner. The steps taken to prepare the samples and use the instrument begin with samples being were split and labelled into trays and dried in an oven at 180oC overnight. The following day small portions of each sample (approximately 1/16th tsp) were scooped onto double-sided tape attached to a round stub. The sample stubs were labelled, then coated with platinum using a coating device.
Scanning electron microscopy secondary electron imaging was conducted on samples 3, 4 and 5 collected at Glenbrook Beach (Figure 3.17), as well as images for sample 1 at Site 1A (Figure 3.10). Samples 3 to 5 represent the lower portion of Ongatiti Ignimbrite Unit 1, near the contact boundary of the ignimbrite and mud horizon, as specified in the stratigraphic column seen in Figure 3.12. Sample 1 represents a Rotoiti Ignimbrite flow unit, as specified in the stratigraphic column (Figure 3.5). These samples were selected for SEM analysis to see if there were any distinctive features about the pumice and ash within this portion of the deposit. Overall grain size was observed at 35x to 40x magnification, while close images of individual particles were observed at 200x to 800x magnification, at 5kV.
3.2.3 Grainsize by Laser Diffraction Particle Size Analysis
One method for obtaining precise grain sizes and distribution of a sample is by laser diffraction particle size analysis. A Malvern Mastersizer 3000 supplied by the University of Waikato was used. Particle size analysis that uses laser diffraction allows particle measurements from 100 nm to 3500 µm to be taken at 10 kHz (ATA Scientific, n.d.). The steps taken to prepare the samples and use the instrument started with cleaning the
Mastersizer. Then approximately 1 tsp of each sample was poured into a beaker with water and mixed into a slurry. Three droplets from a pipette of 5% Calgon solution was added to the beaker to help disaggregate the sample. The mixture was then poured into a dispersion tank. The dispersion tank mixes and disaggregates the sample further. Once dispersed, a laser beam passes through the sample and the particles within the sample create a scattered light pattern. The results were presented on a display screen, showing the particle size distribution of the sample.
Samples 3 to 5 collected from the lower portion of ignimbrite Unit 1 at Site 2 and samples 10 to 11 collected from the upper portion of ignimbrite Unit 2 also at Site 2 underwent laser diffraction particle size analysis (Figure 3.1).
3.2.4 Grainsize by Dry Sieving
A much simpler physical method for obtaining grain size and distribution is by sieving. This technique uses a range of sieve pans from 32 mm to 0.0625 mm stacked on top of one another, from largest to smallest mesh aperture, allowing the sample to distribute into their corresponding grain size groups. Samples were separated and labelled in trays to dry in an oven at 180oC overnight. The following day the dry samples were then brought to the sieving lab for preparation and use. Initial weights of each sample were measured on a scale. The sample was then placed into the top of the sieve pan. The pan stack was shaken by hand to help with distribution. Each pan was removed and weighed from top to bottom.
Sample 1, representing some of the lower unit, collected from Site 1A (Figure 3.1) and Sample 13 collected from the Site 2 were taken into the dry sieving lab for grain size analysis.
Sample 13 represents a pumice concentration zone not found within the main outcrop observed but from another one further south of the beach. The sample was taken because it was easier to collect and more distinct. This pumice concentration zone corresponds to the same one described within the log from Site 2, Glenbrook Beach (Figure 3.1).
3.3 Rotoiti Ignimbrite along the Bay of Plenty Coast
The Rotoiti Ignimbrite, also known as the Rotoiti Breccia, is a non-welded ignimbrite that erupted from the northern sector of Haroharo volcanic complex of the Okataina volcanic
centre (OVC). The ignimbrite was produced from a caldera collapse eruption known as the Rotoiti eruption, which has been given varying dates of 45.2 ± 8.2 ka by Buhay et al. (1992), and 64 ± 4 ka by Wilson et al. (2010) and generated >100 km3 of pyroclastic material (Cole et al., 2010). The deposit spans from Rotorua to the Bay of Plenty coastline, covering an estimated area of >850 km2 (Schmitz & Smith, 2004). The Rotoiti Ignimbrite is one of the most voluminous ignimbrites from the most recent caldera collapse in the OVC (Flude &
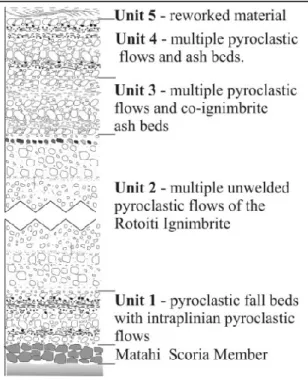
Storey, 2016). The majority of the Rotoiti ignimbrite deposited near source has been buried by younger lavas and pyroclastic units. Outcrops of the ignimbrite can be found northeast of the OVC and along the coast between Matata and Maketu townships. Previous work by Burt et al. (1998) subdivided the Rotoiti eruption sequence into four different units based on mineralogy: (1) predominantly biotite-free plinian-ash beds, (2) biotite-free ignimbrite, (3) biotite-bearing ignimbrite, and (4) biotite-bearing air fall. All of these units contain plagioclase, quartz, orthopyroxene, calcic amphibole, and cummingtonite (Burt et al., 1998).
Figure 3.2 is a stratigraphic column assembled from four outcrops northeast of OVC described by Burt et al. (1998).
Figure 3.2 – Composite stratigraphic column of the Rotoiti Breccia (Burt et al., 1998).
3.3.1 Site 1A: Pacific Coast Highway
Several road cuttings presenting a non-welded ignimbrite facing northeast towards the sea were found along the south side of the Pacific Coast Highway between Matata and Maketu.
The ignimbrite cross-section height varies along the highway from 5 to 30 m in height. The deposit was described at Stop 1A (Figure 3.3).
Figure 3.3 – Map showing locations of Site 1A and Site 1B visited for this field study (Google, n.d.-e).
At Pikowai Campground, on the northern side of the Pacific Coast Highway adjacent to Site 1A, the bluffs were observed to be approximately 15 m thick (Figure 3.4).
Figure 3.4 – Photographic image of a large-scale deposit of Rotoiti Ignimbrite observed from Pikowai Campground along the Pacific Coast Highway [37o51’24.11” S / 176039’56.78” E].
At Site 1A the accessible lower flow unit of the Rotoiti Ignimbrite was logged in detail in Figure 3.5.
~15 m
Figure 3.5 – Stratigraphic column of the lower unit of the Rotoiti ignimbrite observed at Site 1A.
Some of the lower unit, measuring from 0 to 3 m height, consisted of a nonwelded, very poorly sorted, pumice-lapilli fine ash, grey and pinkish white in colour. Visible crystals included plagioclase and biotite. Pumice clasts ranged from 0.5 to 3 cm in size with moderate
(upper) <