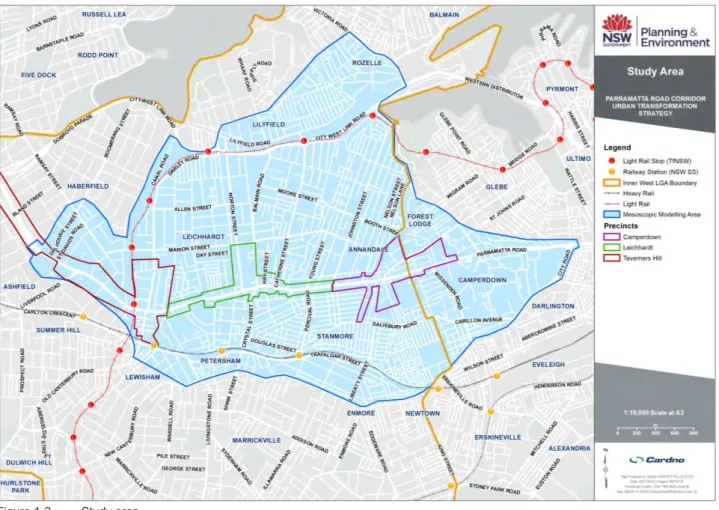
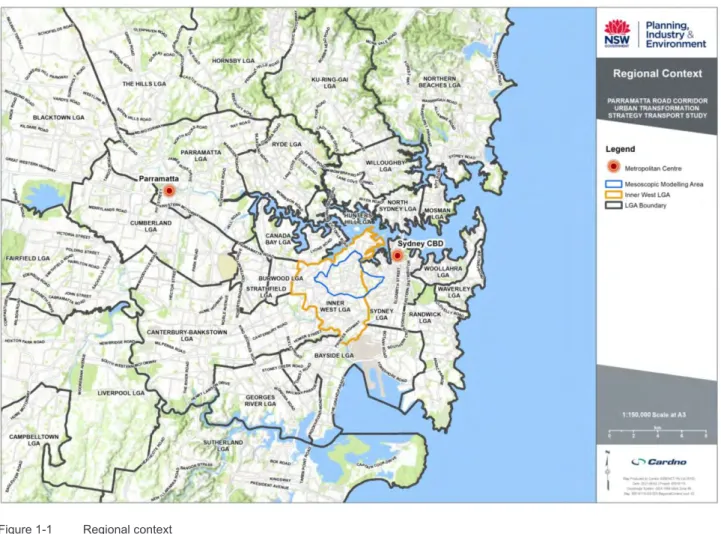
The study area is located in the Inner West suburbs of Sydney, approximately five kilometers south-west of the CBD. To the west of the study area, City-West Link Road connects with Parramatta Road and the M4 East.
Stakeholders
Report outline
2 Options testing
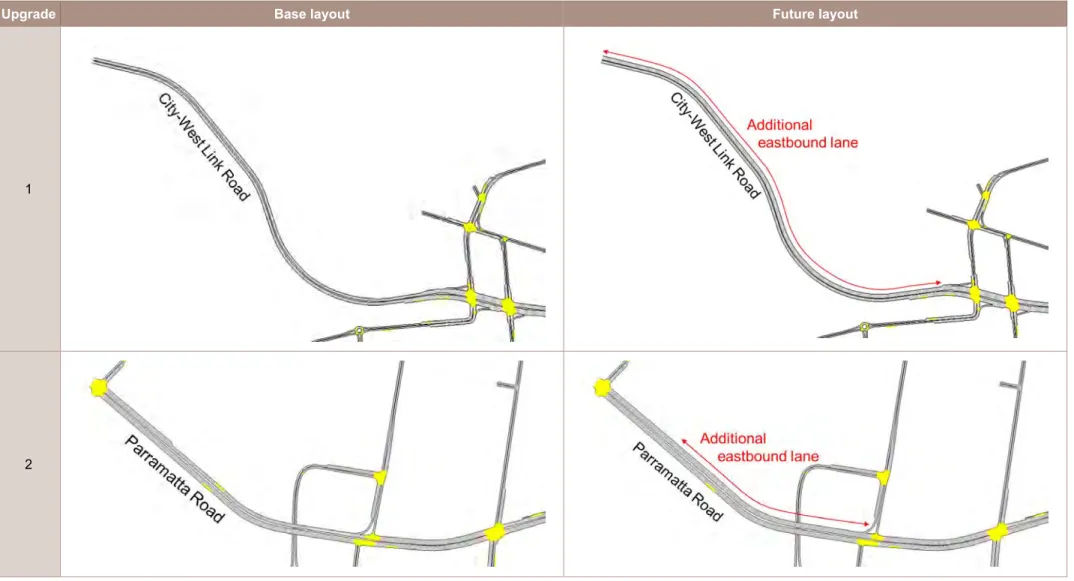
Future infrastructure
- Do Minimum
- With Upgrades
Johnston Street (north) – removal of northbound parking/kerb lane to provide space for additional southbound right turn lane. Johnston Street (south) – removal of southbound parking/kerb lane to provide space for dedicated northbound right turn lane.
Assessment scenarios
- Base Model
- Network Capacity Model
- Do Minimum
- With Upgrades
Assessment years and time periods
3 Assumptions
Future Model assumptions
Performance metrics
- Network performance metrics
- Travel time
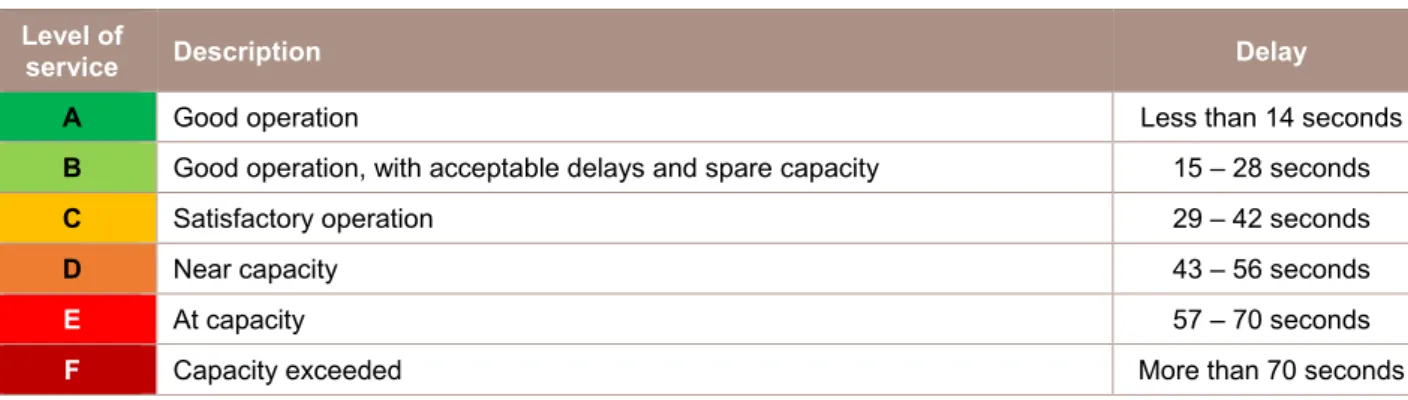
- Intersection performance metrics
- Network plots
For unsignalized intersections (priority intersections and roundabouts), service level is based on the maximum delay of all approaches. LOS E indicates that the intersection is at capacity, and this level of service is generally unsuitable for unsignalized intersections.
4 Future demand development
- PTPM growth estimation
- Incremental growth application
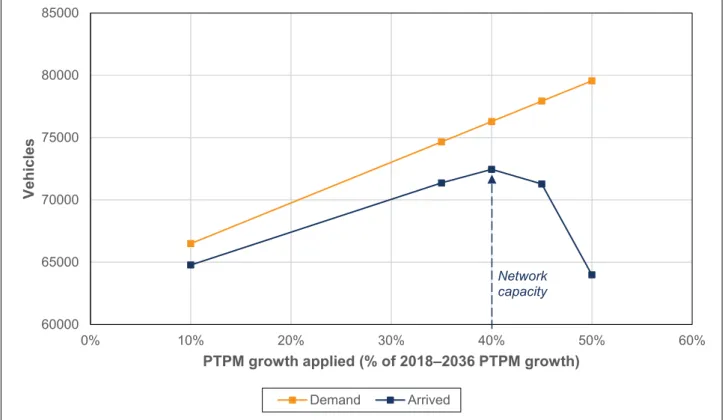
- Comparison of network capacity VKT to PPM penalty scenarios
- STFM demand estimation
- STFM demand summary
- Aimsun traffic demand
Growth in STFM for each origin-destination (OD) pair was calculated by subtracting the base year matrix (2018) from the future year matrix (2026 or 2036). This requirement was removed from the STFM requirements prior to calculating STFM growth in the study area.
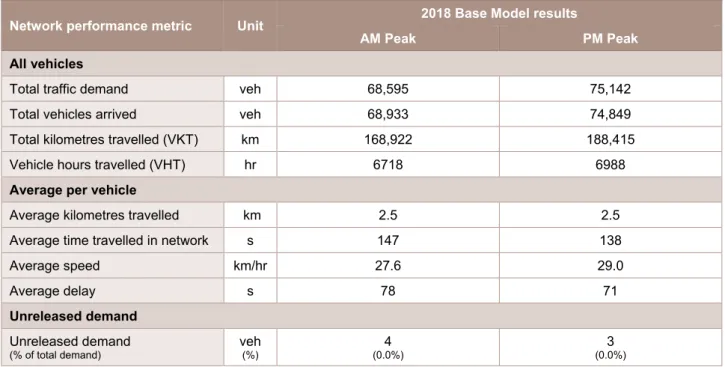
5 Base Model operational results
- Data inputs
- Model specifications and assumptions
- Existing network performance
- Network performance summary
- Person statistics
- Existing travel times
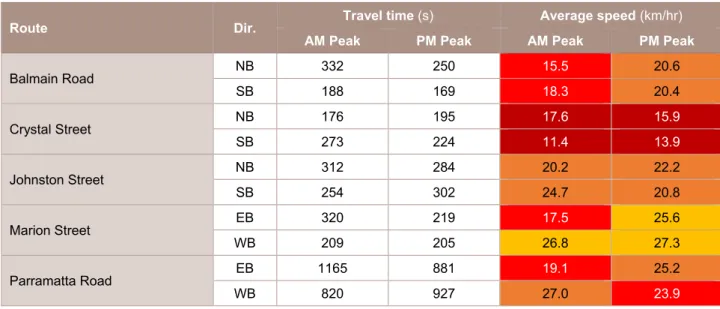
- Travel times on key routes
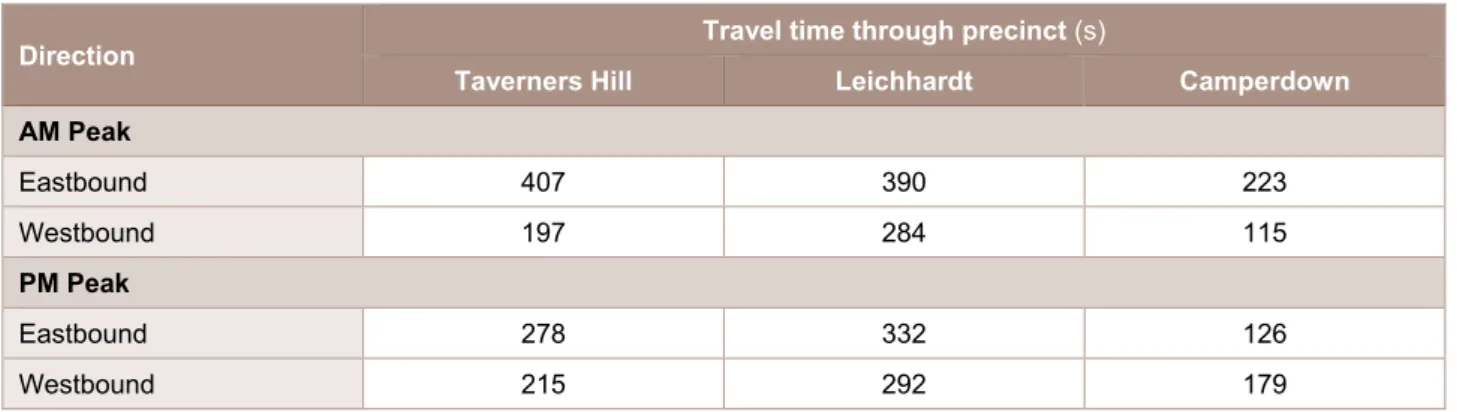
- Travel times through precincts
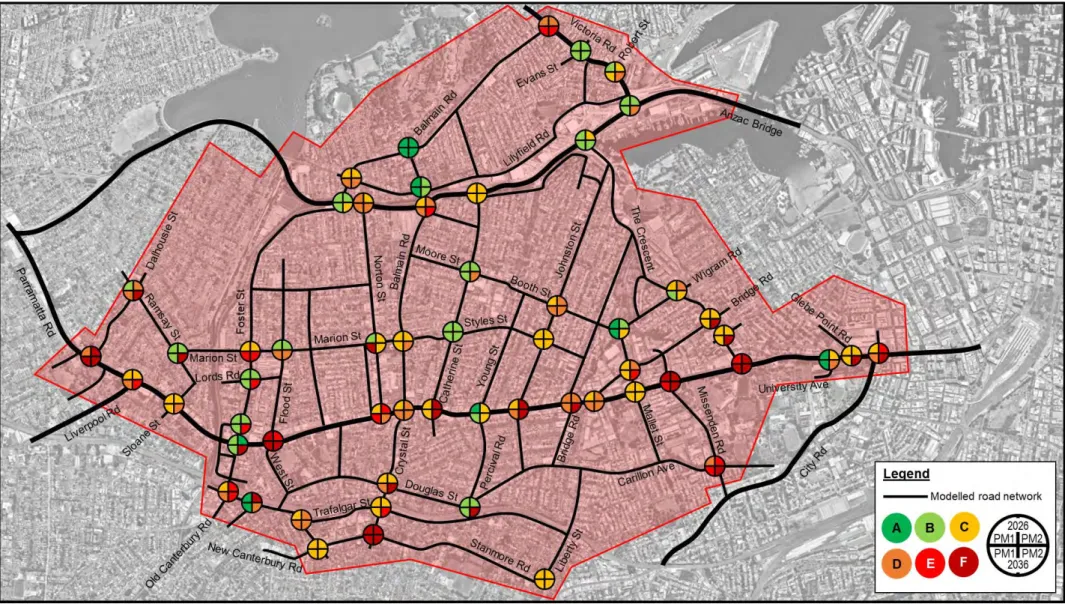
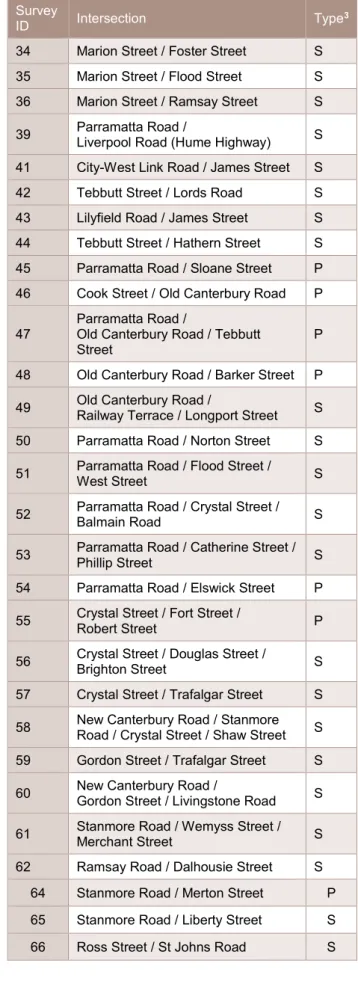
- Existing intersection performance
- Intersection operation
- Queue lengths at major intersections
- Existing network plots
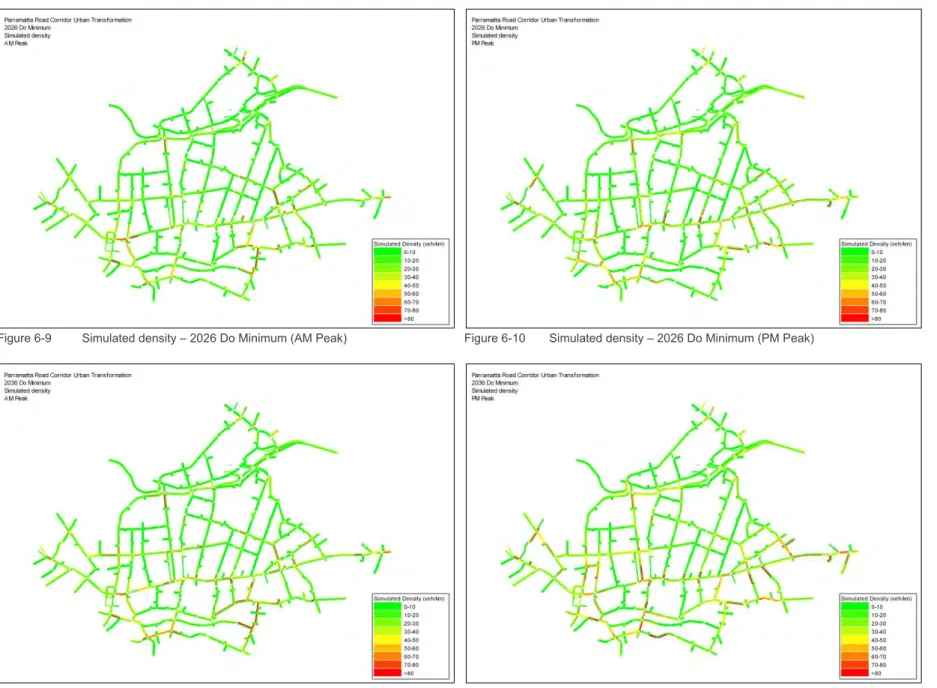
- Traffic density
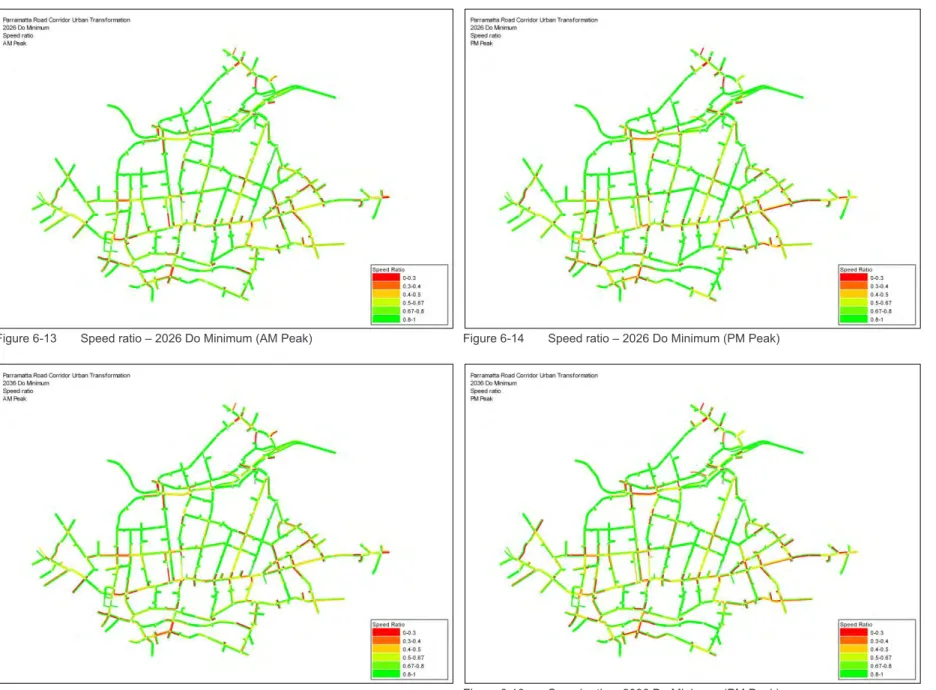
- Speed ratio
- Heavy vehicle proportions
The right turn from Parramatta Road also has an average delay of 85 seconds in the first hour and 110 seconds in the second hour. The right turn from Parramatta Road to Johnston Street is also experiencing delays of up to 82 seconds (LOS F).
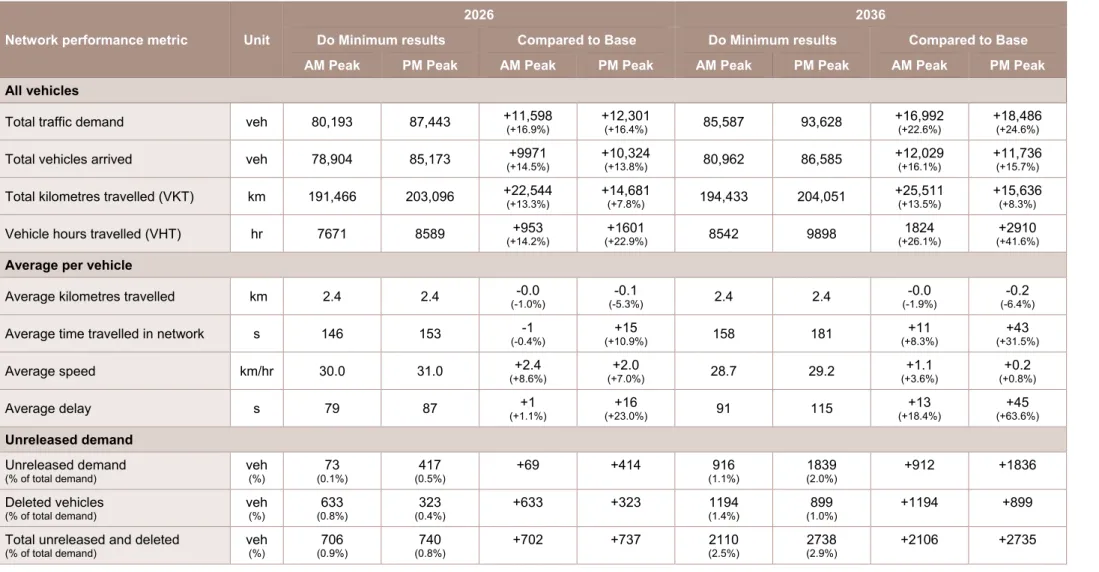
6 Do Minimum operational results
- Do Minimum network performance
- Network performance summary
- Person statistics
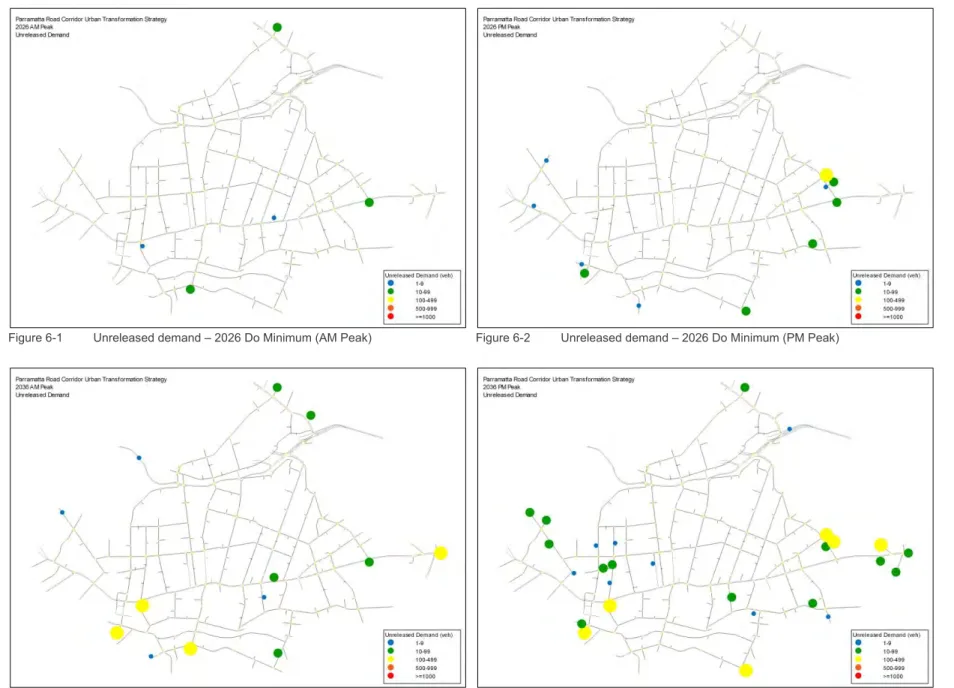
- Unreleased demand
- Do Minimum travel times
- Travel times on key routes
- Travel times through precincts
- Do Minimum intersection performance
- Intersection operation
- Queue lengths at major intersections
- Do Minimum network plots
- Traffic density
- Speed ratio
- Heavy vehicle proportions
In 2036, travel time increased in both peaks, with the largest increase in PM Peak (up to 202 seconds). In addition, the right turn from Parramatta Road performs at LOS F for the first hour in 2036, up from LOS D in 2018. In the second hour, congestion on Parramatta Road westbound at this location also results in LOS F for these movements.
The simulated speed ratio is low along Parramatta Road, particularly eastbound in the AM peak and westbound in the PM peak.
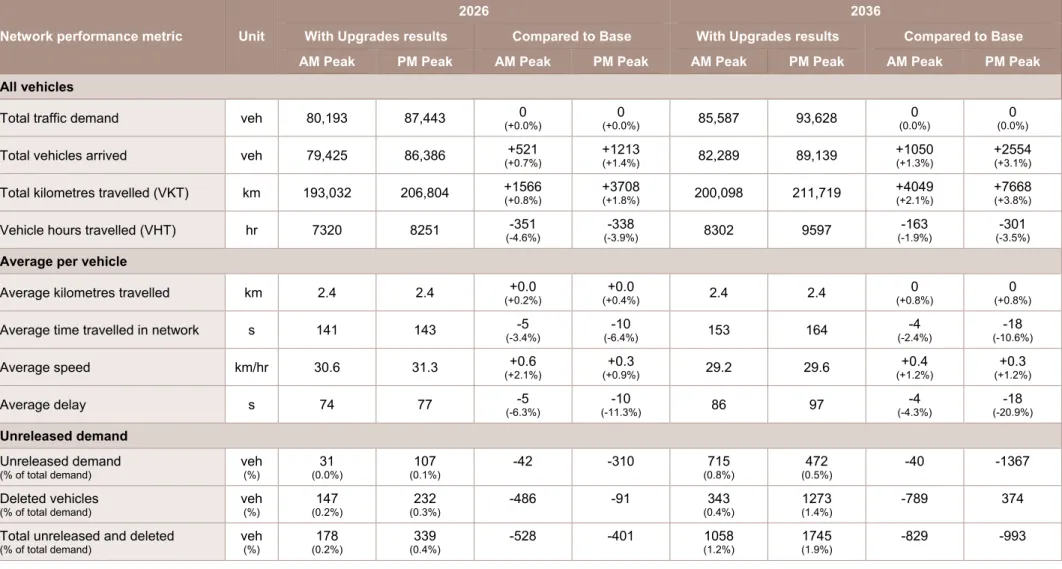
7 With Upgrades operational results
- With Upgrades network performance
- Network performance summary
- Person statistics
- Unreleased demand
- With Upgrades travel times
- Travel times on key routes
- Travel times through precincts
- With Upgrades intersection performance
- Intersection operation
- Queue lengths at major intersections
- With Upgrades network plots
- Traffic density
- Speed ratio
- Heavy vehicle proportions
The following sections outline the total unreleased demand and locations of unreleased demand in the AM and PM peaks for the With Upgrades scenario. There are also improvements to northbound travel times in AM Peak in both years. It is also less affected by queue spillage from Parramatta Road in the second hour of the peak.
This section provides an overview of intersection performance in the study area in the With Upgrades scenario.
8 Conclusion
APPENDIX
The whole and every part of this document is copyrighted by Cardn and may not be used, sold, transferred, copied or reproduced in whole or in part by any means or in any form or in or on any medium to any person, except in agreement with Cardna. This document was created by Cardno solely for the benefit and use of the customer in accordance with the terms of the deal. Cardno assumes and assumes no responsibility or liability to any third party arising out of any third party's use of or reliance on the contents of this document.
The validity and completeness of the information provided have not been independently verified and for the purposes of this report, the information provided to Cardno is assumed to be complete and accurate.
Contact Information Document Information
Cardno does not assume or assume any liability to any third party arising out of any third party's use of or reliance on the content thereof.
Document History
Appendices
1 Introduction
- Project background
- Project objectives
- Scope of works
- Stakeholders
- Report outline
This report documents the Base Model development process, including discussion of the modeling assumptions, stability, calibration and validation process, limitations, and conclusions.
2 Existing conditions
Study area
Data inputs
- Cordon matrices
- Classified intersection counts
- Travel time routes
- SCATS traffic signal data
1 Parramatta Road between Princes Highway (City Road) and Orpington Street 2 Crystal Street between Trafalgar Street and Parramatta Road. 3 Balmain Road between Parramatta Road and City-West Link Road4 4 Brighton Street between West Street and Crystal Street, then. Douglas Street between Crystal Street and Salisbury Road, then Salisbury Road between Douglas Street and Australia Street 5 Marion Street between Ramsay Street and Balmain Road 6 Johnston Street between Parramatta Road and The Crescent 2.2.4 Average speed data.
New Canterbury Road / Shaw Street / Stanmore Road 101 LEW 10 Crystal Street / Trafalgar Street 102 LEW 13 New Canterbury Road / Gordon Street / Livingstone Road 132 LEW 32 Parramatta Road / Missenden Road.
Congestion locations
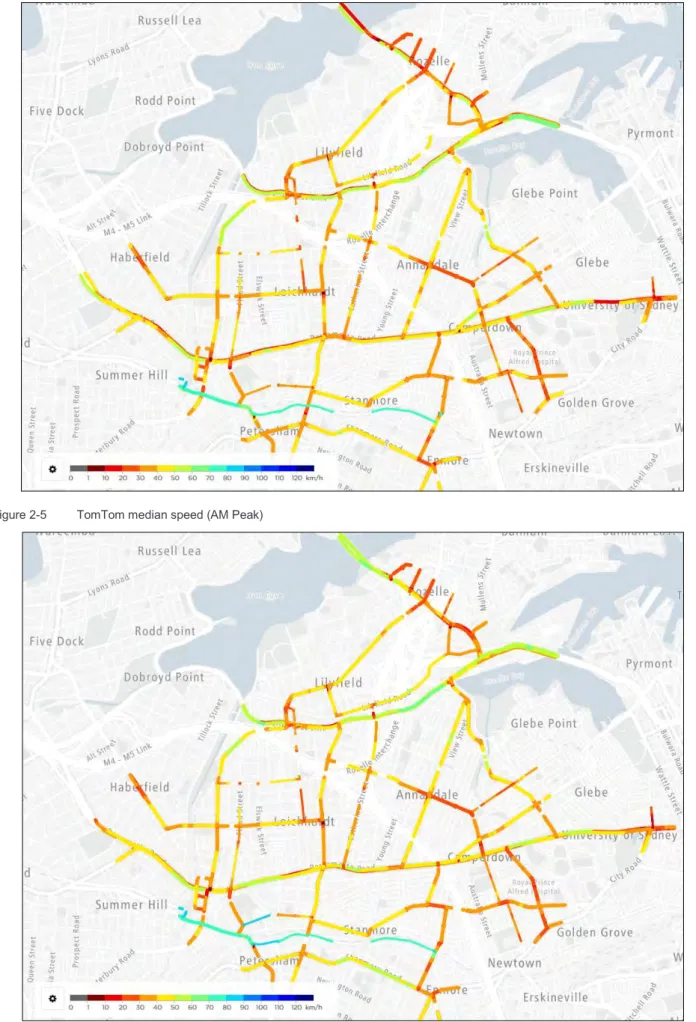
Between Liverpool Road and West Street, the average speed on Parramatta Road was observed to be less than 25 kilometers per hour. Congestion was observed approaching City Road and Broadway on Parramatta Road with the average speed over AM Peak being approximately 25 kilometers per hour. The average speed on the section of Parramatta Road approaching Catherine Street was approximately 25 kilometers per hour in PM Peak.
In the off-peak direction (eastbound), traffic was generally freer flowing, with an average speed on Parramatta Road of around 30-40 kilometers per hour and on City-West Link Road.
3 Model assumptions
Modelling platform
Modelled network
- BSORT / PRRP model
- PRCUTS model network
Time period
Assignment type
- Static assignment
- Dynamic user equilibrium
- Stochastic route choice assignment
Vehicle types
Traffic zones/input
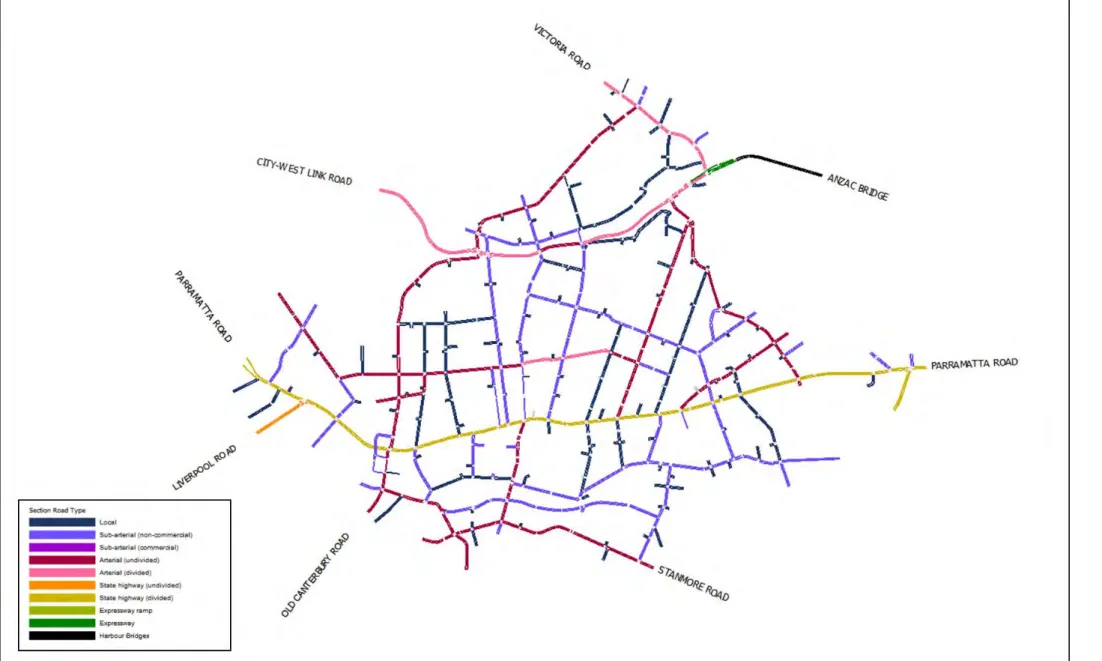
Road types
- Modelled road types
- Lane cooperation
- Acceleration factor
The right turn from Victoria Road to Robert Street is only accessible from the right hand lane of Victoria Road. The partnership was expanded to 60-70 percent to increase the number of vehicles using other lanes to turn right from City-West Link Road and then merge onto the section of Victoria Road between City-West Link Road and Robert Street. At such locations, the section speedup factor was increased to account for the observed rate of queue dissipation.
Acceleration factors were used at the ends of Parramatta Road to increase delays associated with congestion outside the modeled area.
Elevation and slope profile
Cooperation was increased to 80 percent, so vehicles were more likely to merge out of the partially blocked through lane into the shoulder lane. Due to the high demand for this turn, queues in the model were observed to build up disproportionately in the right lane, whereas. Due to curves in the road, the queues often stretched beyond the visibility of the traffic lights.
Acceleration factors were used to account for the effects of reduced visibility, parking manoeuvres, queue jumping on Crystal Street and Norton Street and buses merging into and out of bus lanes.
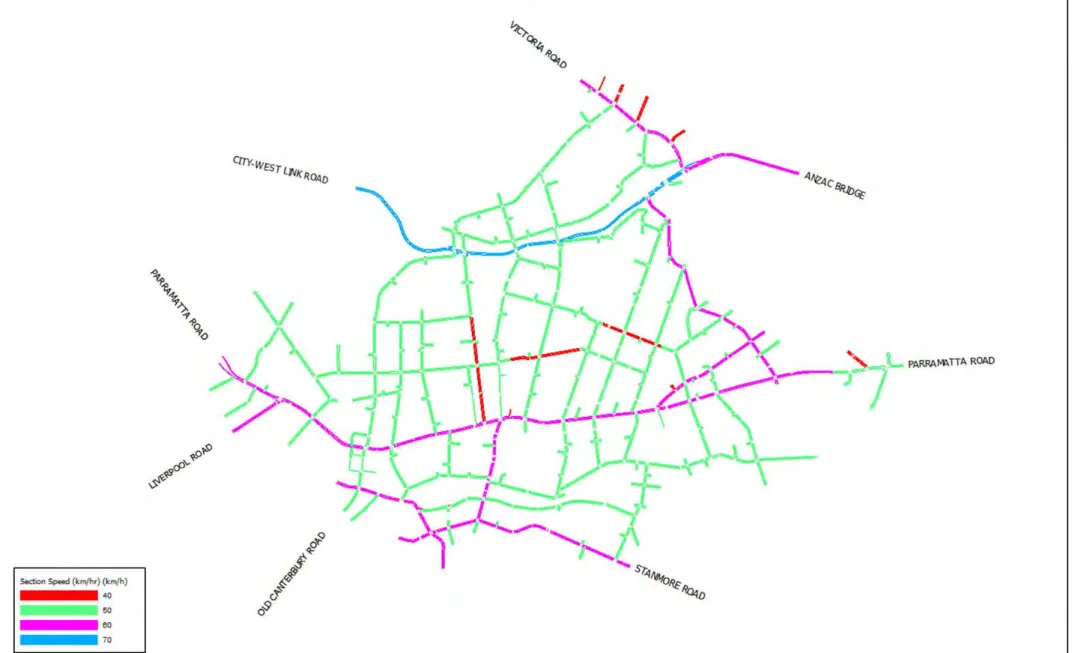
Speed profiles
- Local roads
- School zones
- Local speed reductions
Brighton Street is a narrow local road with parking on both sides and a speed limit of 50 kilometers per hour. The maximum desired speed on Brighton Street was reduced to 25 miles per hour to accommodate delays related to parking and traffic calming measures. The maximum desired speed on Elswick Street was reduced to 25 miles per hour to accommodate delays associated with parking and traffic calming measures, and to reduce the attractiveness of Elswick Street as an alternative to Norton Street or Foster Street.
The maximum preferred speed on Johnston Street has been reduced to 40 kilometers per hour to accommodate parking delays.
Traffic signals
Public transport services
- Train services
- Bus services
- Light rail
All road-light rail intersections in the study area are grade separated, so there is no interaction between the light rail vehicles and road vehicles. There are no parking spaces available at the stops within the study area and there is limited street parking in the immediate vicinity. The minimum number of trips in the STM question indicates that the majority of light rail users take public transit or walk to the stop.
Consequently, due to low demand, light rail stops were not included as separate hubs in the model and their journeys were included in the surrounding area.
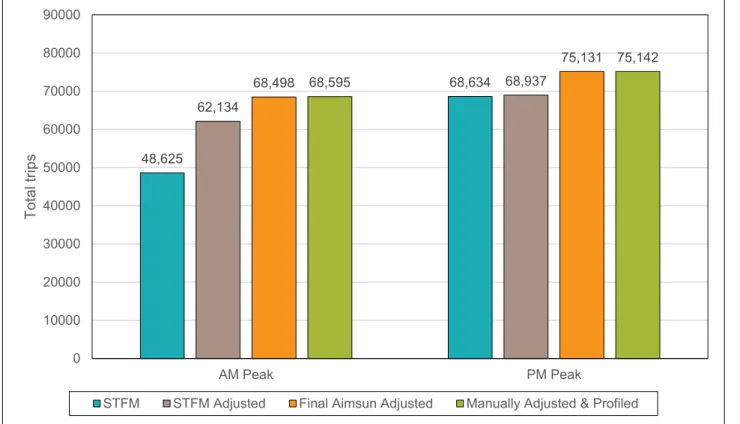
Demand assumptions and adjustment
- Demand estimation procedure overview
- Demand adjustment
- OD adjustment and trip length distribution
- Departure adjustment
- Traffic demand composition
There are no significant changes in the shape of the profile after the last adjustment. The two-hour traffic demand was profiled using the Aimsun Static OD Departure Adjustment based on the profile of the RDS (see section 2.2.2). All values are within 0.4 percent of the total demand and there are no significant changes in the shape of the profile.
Please note that buses are part of the heavy vehicle class, but are not included in the demand, as they follow fixed routes and operate according to a fixed timetable.
Pedestrians and cyclists
Behaviour parameters
End constraints at model boundary
Calibration criteria
Validation criteria
- Travel time validation
- Signal validation
- Congestion hotspot validation
Validation of travel times on major roads confirms that the model is accurately replicating observed congestion and driver behavior. The average modeled speed by section was plotted for each peak and compared with the average speed data extracted by TomTom (refer to Section 2.3). This provided an additional layer of verification that the average speeds in the model were reflective of those in reality.
4 Model stability
Seeds run
Stability assessment
The number of simulations required (N) is less than the initial five bootstrap values used for both peaks, so it is sufficient to keep the initial five bootstrap values for the 95% confidence interval. The results reported later in this calibration and validation report are based on the mean seed values for each peak shown in Table 4-2.
5 Model calibration and validation
Convergence
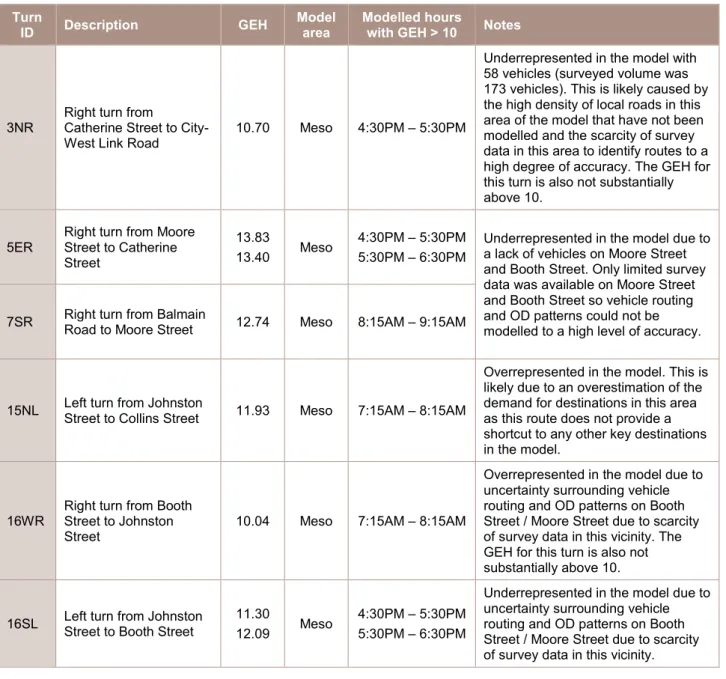
Calibration results
Underrepresented in the model due to a lack of vehicles on Moore Street and Booth Street. Over-represented in the model due to uncertainty surrounding vehicle routing and OD patterns in Booth Street/Moore Street due to the scarcity of survey data in this area. Underrepresented in the model due to uncertainty surrounding vehicle routing and OD patterns in Booth Street/Moore Street due to the scarcity of survey data in this area.
Under-represented in the model due to uncertainty around traffic volumes on Lilyfield Road (see above).
Validation results
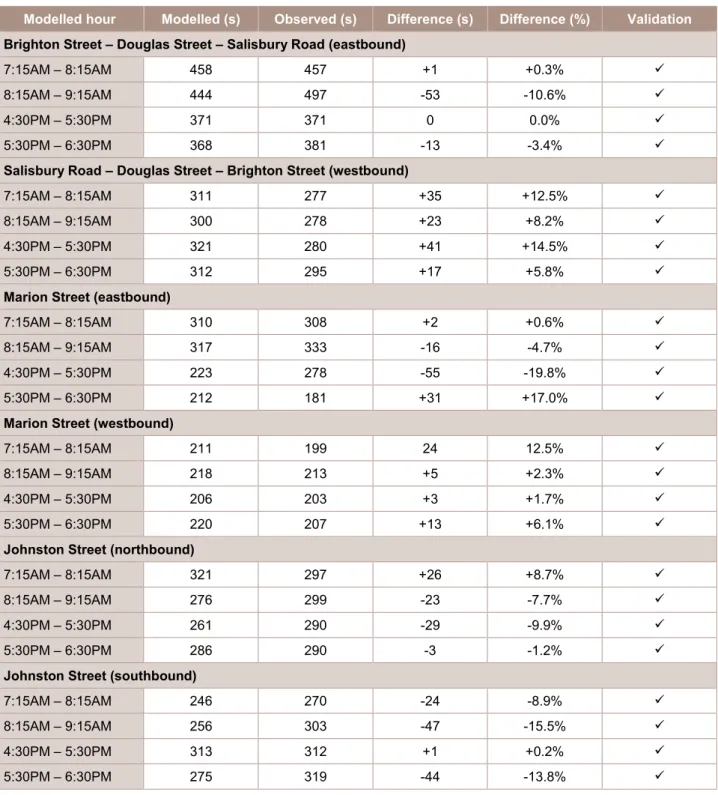
- Travel time validation
- Travel time variability
- Signal timing validation
- Congestion hotspot validation
Travel time is underrepresented on Crystal Street in the southbound direction in the second hour of the PM Peak. This is attributable to frictional effects of parking and ramps that are not considered in the model. Travel times are generally overestimated on this segment of Salisbury Road in the westbound direction.
Cycle times were coded into the model based on historical cycle times from SCATS data.
6 Model limitations
7 Conclusions
GEH SUMMARY