Shortly after the collapse of the US financial system, the catastrophic consequences spread to other financial markets, witnessing a serious downturn in the global economy. We not only look at the fluctuations in the housing market due to the change in the oil market, but are also interested in the spillover of shocks from the housing market to the oil market. Furthermore, a rise in oil prices results in a rise in general inflation in an economy, which in turn leads investors to invest in the housing market to hedge against this higher inflation, causing house prices to rise again.
They argue that rising oil prices negatively affect the terms of trade of oil-importing countries, resulting in increased housing production costs, which in turn increase housing prices. 2016) use a dynamic GARCH conditional correlation model to examine time-varying co-movements between housing returns and the oil market in the United States over the period 1859–2013. They find that the co-movements between housing returns and the oil market are consistently negative over time, except for a few periods in the 19th century when the US.
Thirdly, the increase in the price of oil can lead to an increase in inflation, resulting in the tightening of monetary policy by central banks and consequently the withdrawal of liquidity from the housing market, reducing demand and housing prices. There are several papers that examine the linkage of housing markets across regions within a country, Miao et al. 2011), examining dependence in 16 US metropolitan housing markets from 1989 to 2006, demonstrates the strong correlation during the active phase of the real estate market. In the above equation, 𝑃𝑡∗ is a diagonal matrix with a square root of the i-th diagonal of Pt at its i-th diagonal position.
In particular, the output of the variance decomposition seems to respond to the order of the variables in the system.
Data description
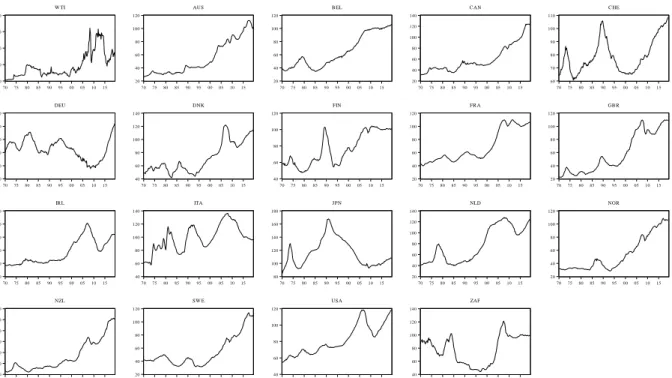
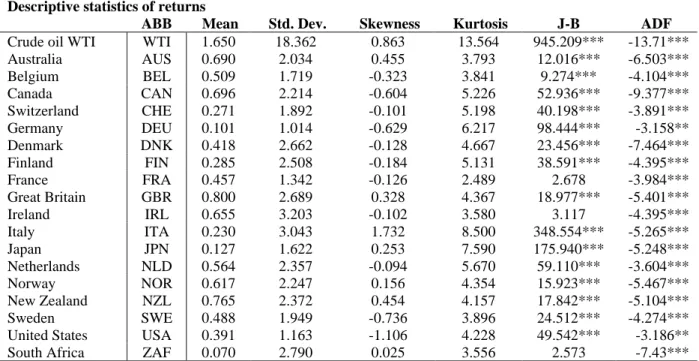
With the exception of Germany and Japan, house prices show positive trends during the sample period, especially during the. In each country, however, there are large fluctuations within this generally positive trend. The figure also shows that there are large differences in the movements of house prices across the countries, with a tendency to move closer together in periods of financial crisis. For example, most countries in the sample experienced a fall in house prices during the GFC, including Germany (DEU), Denmark (DNK), Ireland (IRL), Italy (ITA), the Netherlands (NLD), New Zealand (NZL), the United States (US ) and South Africa (ZAF).
The movement of oil prices was also generally positive; however, both the rate of increase and volatility vary significantly over the sample period. The peak of the oil price was recorded in the first half of 2008, when the price reached 128.57 USD per barrel. The high price of oil during this period can be explained by the increasing demand due to the rapid expansion of emerging economies (such as China) and the decline in supply due to the reduction in production by OPEC producers (Carlin & Soskice, 2014).
In 2009, the global financial crisis saw the drop in demand largely offset the drop in supply, and the price of oil fell by more than 60 percent to $44.56 per barrel. barrel. As can be seen from table 1, housing market returns are generally positive in all OECD members. Conversely, the lowest interest returns of 0.07 and 0.101 per quarter in South Africa and Germany.
The fact is that small countries, such as Ireland and Italy, appear to have the greatest volatility in house price returns. When it comes to the return of the oil market, the standard deviation is significantly higher than that of the housing markets. 3 House prices in Germany fell between 1970 and 2010 and then rose sharply in the past decade;
Finally, the Jarque-Bera (J-B) and the Augmented Dickey Fuller (ADF) tests provide us with sufficient evidence that all variables are normally distributed.
Empirical finding
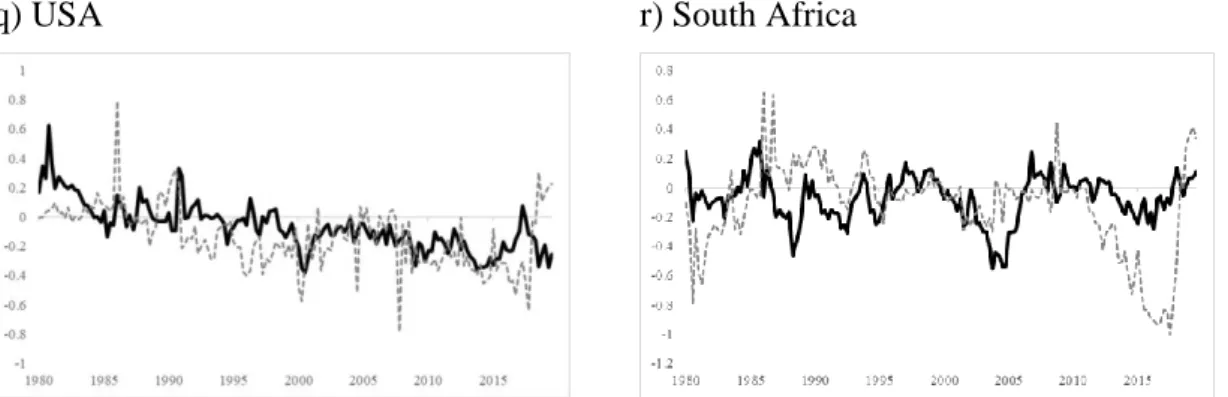
The leading role of the US market in causing global fluctuations is not new in the literature (Beltratti & Morana, 2010; H. Therefore, most remaining markets recorded negative returns and volatility net connection, suggesting that they are mainly shock receivers from the housing markets of US and UK The importance of the US housing market in explaining the variation of other markets should therefore not be ignored.
What is striking is the significant growth of total connectedness in return and volatility during the period of the financial crisis. Again, the oil crisis of 1986, the GFC, the ESDC and the shale revolution are good illustrations of the material impact of the financial downturn on the connection between markets. Indeed, the German reunification of 1990 is one of the most important historical milestones, ending the postwar division of Europe.
For example, the role of the dominant transmitter in the US, especially during the GFC, is evident. The US housing market was found to be the most influential as its net correlation remained positive for most of the sample period. The fact that the US subprime mortgage crisis spread to other markets globally and turned into a global financial meltdown (Verick & Islam, 2010) (Naeem et al., 2020a) speaks volumes about the global influence of the US housing market.
The first peak indicates the oil price collapse in 1986, the second is related to the 1991 oil price shocks due to the Gulf War recession, and the third is for the time of the GFC. Therefore, the net connectedness analysis provides evidence in favor of the oil market as an important transmitter of shocks in our system during the period of financial crises. We take advantage of the pairwise connection between oil and housing markets to explore one of the most important aspects of this research, namely how innovation from one market leads to adjustments in other markets.
Half of the oil in the US was imported from there, so the US correlation in the pair turns out to be negative. Therefore, these findings provide evidence of the significant impact of oil market shocks on the housing markets of net importing countries. When it comes to the US sub-prime mortgage crisis, similar patterns emerge.
Conclusion
Thus far, the oil price shock of 1986 highlights the shock channel that spreads from the oil market to the housing markets of net importing countries due to their dependence on oil. After the invasion of Iraq on August 2, 1990, an economic threat was created for oil-dependent countries. Other countries that depended on Gulf imports, such as Australia (AUS), Finland (FIN), Italy (ITA), Japan (JNP), Netherlands (NLD) and Switzerland (SWE), were hit hard by this recession until the end of the war in 1991 when Iraq surrendered.
So far, two oil crises of 1986 and 1991 are great opportunities to observe the vulnerability of home markets to the oil uncertainty for the cases of net oil importing countries. Indeed, the GFC of 2007-2009 provides strong evidence that oil is the source of variation in the housing markets of Germany (DEU), Ireland (IRL) and the Netherlands (NLD). The trigger of GFC is due to the dramatic fall in house prices after the United States housing bubble burst.
Since the existing literature on the relationship between two markets usually tests the changes in the housing market in relation to oil price fluctuations, our article contributes to the literature by uncovering both directions of the relationship. In addition, being aware of the direct impact of the GFC on the conventional housing markets, our focus is on the market contagion of a less researched area of residential property. We are also aware of periods of financial turmoil, such as the 1973 oil crisis, the 1986 oil price collapse, the 2007–2009 GFC ESDC, and the 2014–2016 shale oil boom, as the literature generally documents a noticeable jump in connectivity over periods of high financial market volatility.
Since the correlation and correlation between the housing and oil markets is found to be significant, the diversification benefit of including these two assets in the portfolios is limited. In particular, due to the increased dependence across markets on extreme economic and financial events, our finding discourages investors from including these two markets in investment portfolios. In terms of policy implications, it presents challenges due to the presence and time-varying features of correlation and coherence between housing and oil markets.
In general, an important element of crisis prevention is better monitoring of oil market fluctuations to avoid the negative effects of oil on the real estate market. Importantly, when it comes to the recent GFC financial distress, our findings also demonstrate the risks associated with the dominant shock-transmitting role of the US housing market as it transitioned from a net recipient of yields during the oil price crises and volatility spillovers, towards a net transmitter of spillovers during the GFC. Then, because of oil's position as a mediating factor, which helps spread the risks from the US to the housing markets of other countries, the global impact of the US financial crisis becomes visible.
Consequently, more attention should be paid to the behavior of the US real estate market to stabilize the local economy. A promising direction to explore in further work is to find the determinants that justify the changing role of the market in sub-periods. Unrealizable valuation gains due to trade restrictions as a solution to short-term inequality.
Positive (negative) values of spillovers indicate that the corresponding variable is a net sender (receiver) of return or volatility spillovers to (from) all other variables of the system. a) Australia b) Belgium.