4McGurk et al.(2020) and Sun et al.(2016) find that investor sentiment extracted from social media posts has predictive power on stock returns. Recently, Zhu et al.(2022) conclude that social media sentiment can predict future movements of listed developers' share prices and house prices in China. 6Zhu et al.(2022) and Li et al.(2022) show that sentiment index is correlated with house prices in China, but their work is considerably more limited in scope.
Early research on manias, such as Froot et al. 1998), discuss rational reasons behind early imitation. In a heterogeneous agent model, Burnside et al. 2016) provide a social learning perspective on the boom-bust cycle of a housing market. Surveys are expensive, difficult to replicate, and limited in geographic and temporal scope (Algaba et al., 2020).
Finally, limits were imposed on the number of properties a person can purchase (Zheng et al., 2021). For example, Sun et al. 2017) find that housing prices are more sensitive to HPR where housing supply is inelastic.
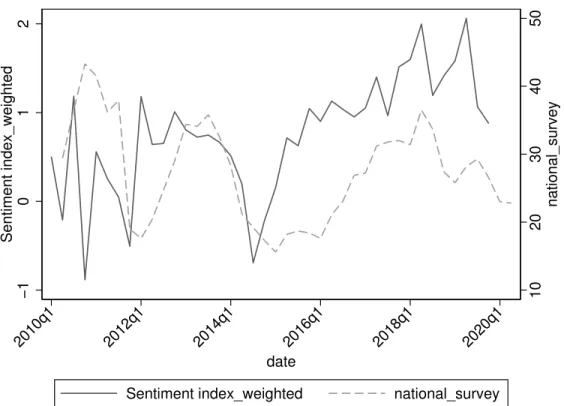
Social media sentiment and house prices
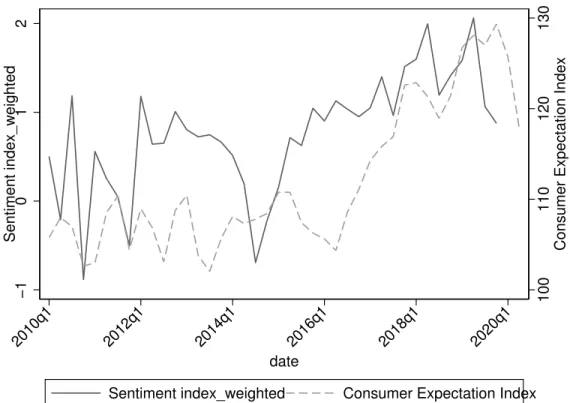
When the CEI is higher, people believe there will be higher incomes, greater employment opportunities, better quality of life, and higher housing prices.
Interpretation
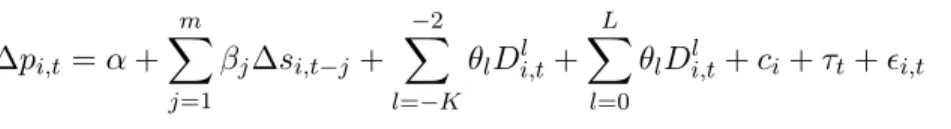
To separate the direct effect of sentiment on house prices from the effects caused by the HPRs, we conduct a Stacked Difference-in-differences (DID) exercise (Cengiz et al., 2019) that focuses on the reregulation policy in 201630. According to our data, the reregulation was implemented in Nanjing in the third quarter of 2016, while it was implemented in Jinan in the fourth quarter of 2016. Reregulation was implemented in several cities in the third or fourth quarter of 2016.
The second sub-experiment is constructed by the treatment group: cities that implemented reregulation on 2016q4, and the control group: cities that reregulation never happens (never treated). We use a period prior to the readjustment as our reference period to avoid the expectation, so that the reference period is 2016q2 in the first partial experiment, while it is 2016q3 in the second partial experiment. The second summation in the equation captures the time periods leading up to the readjustment ("leads"), and the third summation captures the time periods after the readjustment ("lags").
Our main interest is the coefficient on the interaction term β2: if reregulation significantly reduces speculative demand in regulated cities, the sentiment elasticity should decrease. The implementation of reregulation did not weaken the sentiment effect on future house price change significantly.
Dispersion of sentiment and house sales
A 1% increase in the Social Media Sentiment Index for male posters results in cumulative home price growth over a six-quarter period of approximately 0.97%. Because the marriage market forces men to buy houses, their feelings more accurately represent the feelings of the average buyer. We use data on the number of likes, reposts and comments as possible measures of the post's popularity.
A 1% appreciation over six quarters of accumulated lagged sentiment is associated with an approximately 0.83% increase in future quarterly price growth when applied. likes', 0.81% when using the number of reposts and 0.8% when using the number of comments as weights. We find that a 1% increase in accumulated disagreement with a lag of four quarters can predict a 1.007% decrease in the total number of sales and a 1.151% decrease in the total area sold in the next quarter, ceteris paribus. The results show that the national systematic component of disagreement accounts for only a small part of the explanatory power of local disagreement.
Observed speculative market behavior such as “loans with deposit”, “bridge loans”, “Yin-Yang contracts” and “strategic separations” are highly sensitive to disagreements. When the variance is high, such speculative demand is significantly reduced and future residential transactions decline, both in terms of sales and floor space sold.
Robustness checks
The first row reports the accumulated impact of four quarters of growth in sentiment dispersion on current quarterly home sales in logarithm. In addition to the placebo test, we consider additional regressions to determine the robustness of our analysis. Although China's economic growth and the policies that enabled it progressed in waves from east to west of China, we run regressions for eastern, central, and western Chinese cities.
All results remain significant, but the sentiment index plays a smaller, less important role for the relatively underdeveloped western region. When using per capita data at the city level, the error in the per capita equation has a variance proportional to one relative to population size (Wooldridge, 2015); therefore, we use population weights. We then replace the mean sentiment measure in each city with the median to estimate the impact of posts with sentiment outliers on our baseline results.
If we limit the posts about the housing market in a given city to only be by city residents, our results do not change meaningfully (Table D2)38. According to Dragut & Fellbaum (2014), adverbs of degree enhance the mood of textual data (for example, 'very happy' expresses a stronger tone than "happy"). To capture this, we recalculate the sentiment index using a list of degree adverbs from the HowNet Chinese Sentiment Dictionary (Fen et al., 2019; Xu et al., 2019), while assigning weights to degree adverbs as inZhang et al.
As another precaution against the possibility that our social media sentiment index captures fundamentals, we follow Baker & Wurgler (2006) and orthogonalize sentiment to macroeconomic factors (income, population, mortgage rate, unemployment rate, and uncertainty index economic) to avoid any possible "inhibition". ” of the former from the latter. We apply this alternative sentiment index to our empirical analysis and find that the results are again qualitatively unchanged (Table D2). To assess the possibility that our results are driven by higher frequency missingness variation in baselines, we use linear interpolation to generate quarterly values for annual variables and therefore reestimate our main regression.
Similarly, our results do not change if we re-estimate all regressions with monthly (instead of quarterly) house price index and sentiment index (Tables D3 and D??). Finally, the predictive power of sentiments on housing prices may be subject to the sentiment dictionary used to construct the sentiment index. We conclude that all robustness checks confirm a significant predictive power of sentiment on housing price growth in Chinese cities after controlling for observable fundamentals.
Conclusion
The Impact of Government Intervention on the Housing Market: Evidence from China's Housing Purchase Restriction Policy. An index of housing market sentiment in China: Text mining of social media stories. The house price index, mortgage rate and income are expressed in real terms, deflated by the CPI.
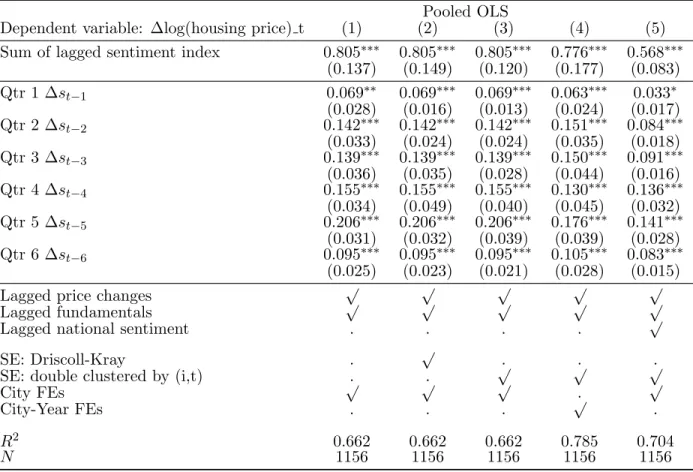
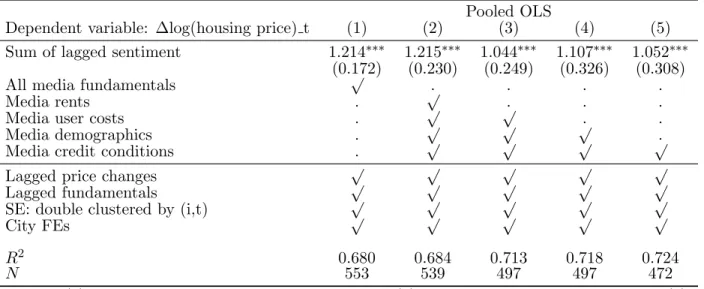
The sentiment index is calculated using the Chinese Financial Sentiment Dictionary (CFSD) and is normalized as (s+100) after Soo (2018). The sentiment index is calculated using the Chinese Financial Sentiment Dictionary (CFSD) and is normalized as (s+100) after Soo (2018). Media Rent” refers to a city-level sentiment index of posts discussing “rent” (“zu” in Chinese).
SE: doubly grouped by (it) √. 3) House price index and sentiment index are on quarterly frequency. The sentiment index is calculated using the Chinese Financial Sentiment Dictionary (CFSD) and is normalized as (s+100) following Soo The first row reports the accumulated impact of six quarters of sentiment growth (the first summary in equation (6 )) on current quarterly price growth. Dependent variable: log(total number of sales) t log(total area sold) t. 3) The fundamentals include: average urban household disposable income, population, mortgage rate, unemployment rate.
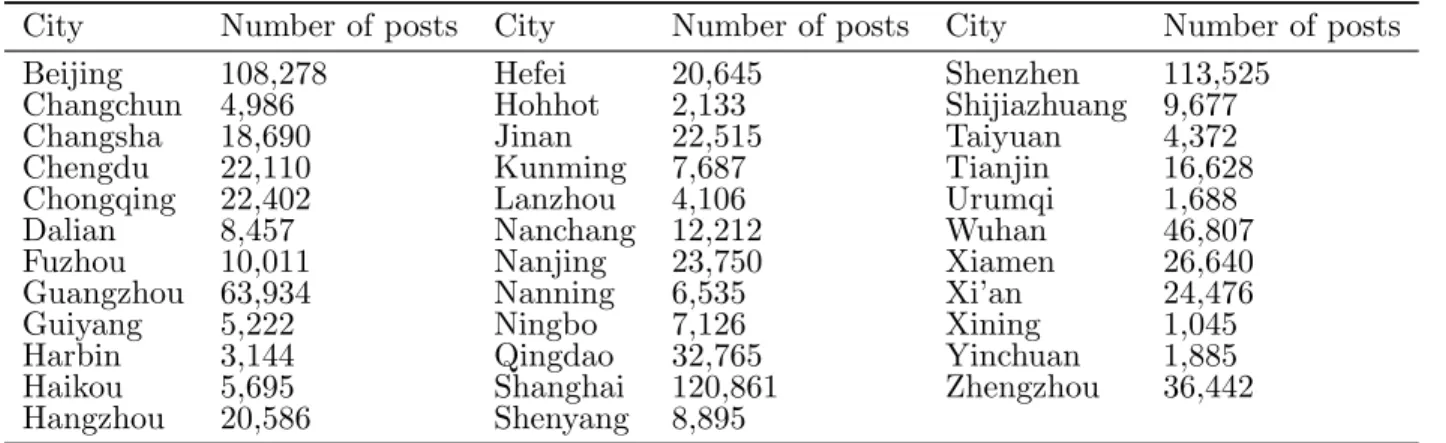
Economic policy uncertainty According to Huang et al. 2020), economic policy uncertainty (EPU) increases house price variation. House prices We use the "NBS house price index", since 1997 for 35 large and medium-sized cities on a quarterly basis41, after it has been adjusted for CPI inflation. City names and "house price" are used to search all postings that meet the criteria.
The sentiment index is calculated using the Chinese Financial Sentiment Dictionary (CFSD) and is normalized as (s+100) following Soo(2018). SE: doubly grouped by (it) √. 3) The sentiment index is calculated using the Chinese Financial Sentiment Dictionary (CFSD) and is normalized as (s+100) following Soo (2018). The sentiment index is calculated using the Chinese Financial Sentiment Dictionary (CFSD) and is normalized as (s+100) following Soo(2018).
The sentiment index is calculated using the Chinese Financial Sentiment Dictionary (CFSD) and has been normalized as (s+100) according to Soo (2018). 4) Sentiment indices in the first column are compiled using the median value of each quarter. The sentiment indices in the last column are calculated using the new Chinese financial dictionary produced by Du et al. (2022). The house price index, mortgage interest rate and income are real values that have been adjusted by the CPI.
The sentiment index is calculated using the Chinese Financial Sentiment Dictionary (CFSD) and has been normalized (s+100).