i
IMPACT OF ORGANIC MANURE TO COMBAT DROUGHT STRESS OF WHEAT
MEHEDI HASSAN
DEPARTMENT OF AGRONOMY
SHER-E-BANGLA AGRICULTURAL UNIVERSITY DHAKA - 1207
DECEMBER, 2018
ii
IMPACT OF ORGANIC MANURE TO COMBAT DROUGHT STRESS OF WHEAT
A Thesis By
MEHEDI HASSAN Reg. No. 17-08273
Submitted to the Department of Agronomy Sher-e-Bangla Agricultural University, Dhaka
in partial fullfilment of the requirements for the degree of
MASTER OF SCIENCE (M.S.) IN
AGRONOMY
SEMESTER: JULY - DECEMBER, 2018
APPROVED BY:
………
Prof. Dr. A. K. M. Ruhul Amin Supervisor
..………...
Prof. Dr. Md. Shahidul Islam Co-supervisor
..………
Prof. Dr. Md. Shahidul Islam Chairman
Examination Committee
iii
DEPARTMENT OF AGRONOMY Sher-e-Bangla Agricultural University Sher-e-Bangla Nagar, Dhaka-1207
Ref. No:
CERTIFICATE
This is to certify that the thesis entitled “IMPACT OF ORGANIC MANURE TO COMBAT DROUGHT STRESS OF WHEAT’’ submitted to the Department of Agronomy, Sher-e-Bangla Agricultural University, Dhaka in partial fulfillment of the requirements for the degree of MASTER OF SCIENCE (M.S.) in AGRONOMY, embodies the results of a piece of bona fide research work carried out by MEHEDI HASSAN, Registration No. 17-08273, under my supervision and guidance. No part of this thesis has been submitted for any other degree or diploma in any other institution.
I further certify that any help or sources of information received during the course of this investigation have duly been acknowledged.
Date:
Dhaka, Bangladesh
Prof. Dr. A. K. M. Ruhul Amin Supervisor
iv
Dedication
Every challenging work needs self-efforts as well as guidance of elders especially those who were very close to our heart.
My humble effort I dedicate to my sweet and loving Father
Md. Delower Hossain
&
Mother Rehana Parvin.
Whose affection, love, encouragement and prays of day and night make me able to get such success and honor.
Along with all hard working and respected
Teachers .
v
ACKNOWLEDGEMENTS
The author first wants to articulate his enormous wisdom of kindness to the Almighty
“ALLAH” for His never ending blessing, protection, regulation, perception and assent to successfully complete of research and prepare thesis.
The author would like to express his deepest sense of gratitude to his research Supervisor, Professor Dr. A. K. M. Ruhul Amin, Department of Agronomy, Sher-e- Bangla Agricultural University, Sher-e-Bangla Nagar, Dhaka-1207 for his scholastic guidance, innovative suggestion, constant supervision and inspiration, valuable advice and helpful criticism in carrying out the research work and preparation of this manuscript.
The author also grateful to his respected Co-Supervisor and Chairman Professor Dr.
Md. Shahidul Islam, Department of Agronomy, Sher-e-Bangla Agricultural University, Sher-e-Bangla Nagar, Dhaka-1207 for his constant encouragement, cordial suggestions, constructive criticisms and valuable advice during the research period and preparing the thesis.
The author would like to express his deepest respect and boundless gratitude to the honorable teachers of the Department of Agronomy for their valuable teaching, sympathetic co-operation, direct and indirect advice, suggestions and inspirations during the whole study period.
The author expresses his sincere appreciation to his parents, brother, sister and relatives for their inspiration, help and encouragement throughout the study period.
The author also express his thanks to SAURES, SAU, Dhaka-1207, Bangladesh for providing research project to his Supervisor under which this research work was conducted.
The Author
vi
IMPACT OF ORGANIC MANURE TO COMBAT DROUGHT STRESS OF WHEAT
ABSTRACT
A pot experiment was conducted at the net house of Sher-e-Bangla Agricultural University, Dhaka-1207 during the rabi season of the year 2017-18 to evaluate the impact of organic manure to combat drought stress of wheat. The 3×4 factorial experiment was laid out in a Completely Randomized Design (CRD) with three replications. Factor A: Different organic manure [F0 = Control, F1 = Cowdung 10 t ha-
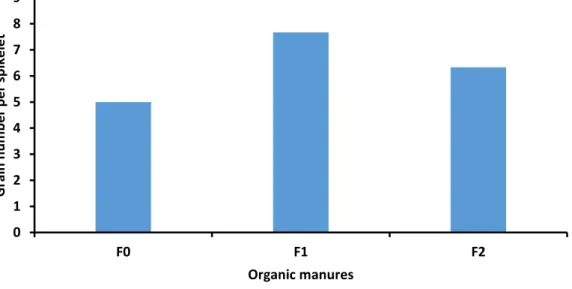
1, F2 = Vermicompost 7 t ha-1] and Factor B: Drought in different growth stages [D0 = Control, D1 = Drought in crown root initiation stage (20-29 DAS), D2 = Drought in booting stage (45-54 DAS), D3 = Drought in anthesis stage (55-64 DAS)]. BARI Gom- 28 was used as test crop. Significant variation was observed on growth, yield and yield contributing parameters. In the case of organic manure, the tallest plant (24.84, 35.77, 56.60 and 78.42 cm, respectively) at 20, 40, 60 DAS and at harvest; highest number of effective tillers plant-1 (8.33), spike length (14.61 cm), number of spikelet spike-1 (16.33), number of grains spikelet-1 (7.67), number of grains spike-1 (37.00), weight of 1000 seed grain (44.93 g), grain yield (4.39 g plant-1), straw yield (4.69 g plant-1), biological yield (9.08 g plant-1) and harvest index (48.35%) were recorded from F1. In the case of drought stress, the tallest plant (23.31, 34.97, 53.72 and 75.07 cm, respectively) at 20, 40, 60 DAS and at harvest; highest number of effective tillers plant-
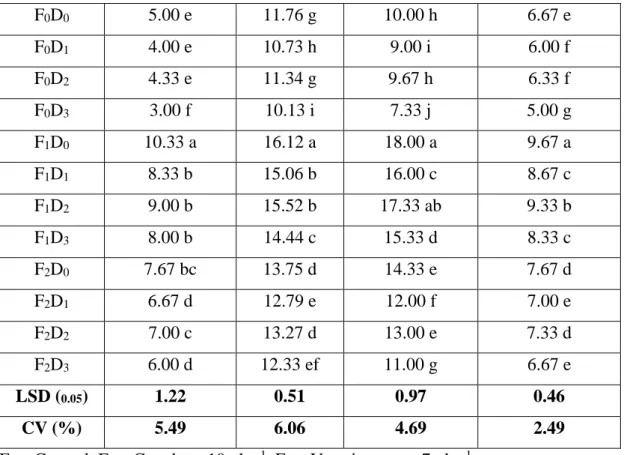
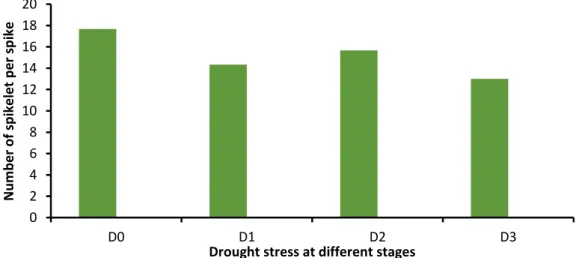
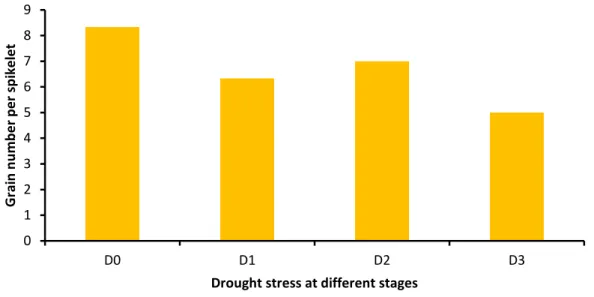
1 (9.67), spike length (15.22 cm), number of spikelet spike-1 (17.67), number of grains spikelet-1 (8.33), number of grains spike-1 (39.00), weight of 1000 seed grain (45.14 g), grain yield (4.72 g plant-1), straw yield (5.05 g plant-1), biological yield (9.77 g plant-1) and harvest index (48.31%) were recorded from D0 which was followed by D2. In the case of interaction, the maximum plant height (27.66, 48.10, 63.15 and 78.56 cm, respectively) at 20, 40, 60 DAS and at harvest; highest number of effective tillers plant-
1 (10.33), spike length (16.12 cm), number of spikelet spike-1 (18.00), number of grains spikelet-1 (9.67), number of grains spike-1 (40.00), weight of 1000 seed grain (48.37 g), grain yield (4.89 g plant-1), straw yield (5.18 g plant-1), biological yield (10.07 g plant-
1) and harvest index (48.56%) were recorded from F1D0. It can be concluded that cowdung may be suggested to apply in drought condition.
vii
CONTENTS
CHAPTER TITLE PAGE NO.
ACKNOWLEDGEMENTS ⅰ
ABSTRACT ⅱ
LIST OF CONTENTS ⅲ-ⅴ
LIST OF TABLES ⅵ
LIST OF FIGURES ⅶ
LIST OF APPENDICES ⅷ
LIST OF PLATES ⅸ
LIST OF ABBREVIATIONS ⅹ
CHAPTER 1 INTRODUCTION 1-3
CHAPTER 2 REVIEW OF LITERATURE 4-18
2.1 Effect of drought 4-14
2.2 Effect of organic fertilizer to combat drought 14-18
CHAPTER 3 MATERIALS AND METHODS 19-24
3.1 Experimental site 19
3.2 Climate 19
3.3 Soil 19
3.4 Planting material 20
3.5 Treatments 20
3.6 Conduction of the experiment 20
3.6.1 Seed collection 20
3.6.2 Preparation of pot 21
3.6.3 Moisture measurement (%) 21
3.6.4 Fertilizer dose and method of application 21
3.6.5 Design of the experiment 21
3.6.6 Seed sowing 21
3.7 Intercultural operations 21
3.7.1 Thinning 21
3.7.2 Weeding 22
viii
LIST OF CONTENTS (CONT’D)
CHAPTER TITLE PAGE
NO.
3.7.3 Irrigation 22
3.7.4 Plant protection measures 22
3.7.5 General observation of the experimental pots 22
3.7.6 Harvesting and threshing 22
3.8 Data collection 22-23
3.9 Procedures of recording data 23
3.9.1 Plant height 23
3.9.2 Number of effective tillers plant-1 23
3.9.3 Spike length (cm) 23
3.9.4 Number of spikelet spike-1 23
3.9.5 Number of grains spikelet-1 23
3.9.6 Number of grains spike-1 24
3.9.7 Weight of 1000 grain (g) 24
3.9.8 Grain yield (g plant-1) 24
3.9.9 Straw yield (g plant-1) 24
3.9.10 Biological yield (g plant-1) 24
3.9.11 Harvest index (%) 24
3.11 Statistical Analysis 24
CHAPTER 4
RESULTS AND DISCUSSION 25-39
4.1 Plant height 25-27
4.2 Number of effective tillers plant-1 27-29
4.3 Spike length (cm) 29-31
4.4 Number of spikelet spike-1 31-32
4.5 Number of grains spikelet-1 32-33
4.6 Number of grains spike-1 33-35
4.7 Weight of 1000 seed grain (g) 35-36
4.8 Grain yield (g plant-1) 36-37
4.9 Straw yield (g plant-1) 38
ix
LIST OF CONTENTS (CONT’D)
CHAPTER TITLE PAGE
NO.
4.10 Biological yield (g plant-1) 38-39
4.11 Harvest index (%) 39
CHAPTER 5
SUMMARY AND CONCLUSION 40-42
CHAPTER 6
REFERENCES 43-55
APPENDICES 56-59
PLATES 60-63
x
LIST OF TABLES TABL
E NO.
TITLE PAGE
NO.
1 Interaction effect of organic manures and drought stress on plant height at different days after sowing of wheat
27
2 Interaction effect of organic manures and drought stress imposition at different growth stages on yield attributes of wheat
29
3 Effect of different organic manures and drought stress on yield attributes of wheat
34
4 Interaction effect of organic manures and drought stress on yield attributes of wheat
35
5 Effect of different organic manures and drought stress on yield and harvest index data of wheat
36
6 Interaction effect of organic manures and drought stress on yield and harvest index data of wheat
37
xi
LIST OF FIGURES FIGUR
E NO.
TITLE PAGE
NO.
1 Effect of different organic manures on plant height at different days after sowing of BARI Gom-28 (LSD0.05 = 0.29, 0.21, 0.22, 0.23 at 20, 40, 60 DAS and at harvest, respectively)
25
2 Effect of different level of drought stress on plant height at different days after sowing of BARI Gom-28 (LSD0.05 = 0.32, 0.24, 0.25, 0.25 at 20, 40, 60 DAS and at harvest, respectively)
26
3 Effect of different organic manures on number of effective tillers plant-1 of BARI Gom-28 (LSD0.05 = 1.06)
28
4 Effect of drought stress imposition at different stages on number of effective tillers plant-1 of BARI Gom-28 (LSD0.05 = 1.81)
28
5 Effect of different organic manures on spike length of BARI Gom-28 (LSD0.05 = 0.72)
30
6 Effect of drought stress imposition at different stages on spike length of BARI Gom-28 (LSD0.05 = 0.61)
30
7 Effect of different organic manures on number of spikelet spike-
1 of BARI Gom-28 (LSD0.05 = 1.04)
31
8 Effect of drought stress imposition at different stages on number of spikelet spike-1 of BARI Gom-28 (LSD0.05 = 0.68)
32
9 Effect of different organic manures on number of grains spikelet-1 of BARI Gom-28 (LSD0.05 = 0.51)
32
10 Effect of drought stress imposition at different stages on number of grains spikelet-1 of BARI Gom-28 (LSD0.05 = 0.80)
33
xii
LIST OF APPENDICES APPENDI
X NO.
TITLE PAGE
NO.
I Experimental location on the map of Agro-Ecological Zones of Bangladesh
56
II Morphological characteristics of the experimental field 57 III Initial physical and chemical characteristics of the soil 57 IV Moisture content (%) before and after drought stress impose 58
V Analysis of variance of the data on plant height at different days after sowing, and number of effective tillers plant-1
58
VI Analysis of variance of the data on spike length, number of spikelet spike-1,number of grains spikelet-1 and number of grains spike-1
59
VII Analysis of variance of the data on weight of 1000 grain, grain yield and straw yield
59
VIII Analysis of variance of the data on biological yield and harvest index
59
xiii
LIST OF PLATES PLATE
NO.
TITLE PAGE NO.
1 Experiment in net house 60
2 Plants without organic manure 60
3 Plants treated with cowdung 61
4 Plants treated with vermicompost 61
5 Tagging for data collection 62
6 Data collection 62
7 Field visit by Member Director (Crop) - BARC and Supervisor
63
xiv
LIST OF ABBREVIATIONS % Percent
@ At the rate of
0C Degree Celsius
AEZ Agro-Ecological Zone
BARI Bangladesh Agricultural Research Institute CRD Completely Randomized Design
CV (%) Percentage of Coefficient of Variation e.g. As for example
et al. and others i.e. that is
kg ha-1 kg per hectare
LSD Least Significant Difference g Gram
cm Centimeter
SAU Sher-e-Bangla Agricultural University
SAURES Sher-e-Bangla Agricultural University Research System
1 CHAPTER 1 INTRODUCTION
Wheat (Triticum aestivum L.) is one of the important cereal crop in the world under the Poaceae family and the main sources of carbohydrate contains a considerable amount of protein, minerals and vitamins. It occupies global rank one in aspect of worldwide production and consumption. It supplies nearly 55% of the carbohydrates and 20% of the food calories consumed as human diet globally and the staple food of more than 36% of world population (Hasanuzzaman et al., 2017).
On a worldwide scale, wheat contributes approximately 30% of total cereal production (Lobell and Gourdji, 2012). Food and Agriculture Organization (FAO) of the United Nations has estimated 739.9 million tons of wheat production in 2017; again, the total wheat production was 749 million tons worldwide in 2016, which made it the second most produced cereal after maize (1.03 billion tons) (FAOStat, 2016).
In Bangladesh it is the second most significant grain crop after the staple grain rice. The national wheat production during the year 2016-2017 was 1.422 million metric tons from 0.429 million hectares of cultivated land with an average 3.32 metric t/ha while in 2015-2016 it was 1.348 million metric tons from 0.445 million hectares of cultivated land with an average 3.03 metric t/ha (DAE, 2018). However, the wheat yield of Bangladesh is much lower comparing to other wheat producing countries in the world due to the fact of growing wheat under rain fed condition (Bazzaz, 2013).
The main reason for the decline in wheat area is weather, which in recent years has been blamed for low yields. If low temperatures are prolonged in the winter season, the yield of wheat is increased. If winter is short the yield declines due to the temperature sensitivity of this crop. The food productivity is seriously hampered due to the effect of various abiotic and biotic stresses. Among various abiotic stresses, drought stress encompass a significant position due to its nature of destruction and losses to crops.
Wheat crop is sensitive to heat and drought stresses mainly at the flowering and grain development stages, which negatively impact the yield and grain quality. Annual production variability estimated at ~40% was mainly due to heat waves and drought situations in major wheat producing belts throughout the world (Zampieri et al., 2017).
Drastic climate changes and increased water scarcity is a challenge global food security, which is further exacerbated due to the need to feed a growing global population (Lesk et al., 2016). A reviewed estimate states that global agricultural production might need to increase by 60-110% to meet the increasing demands (Tilman et al., 2011) as well
2
as to provide food security to the predicted 870 million people who will be chronically undernourished by 2050 (McGuire, 2012). Crop yield is affected by agronomic factors and various environmental variables such as water availability and temperature (Hatfield and Prueger, 2015). There is extensive crop yield variability in many semi- arid regions, which are owed to water limitation and year-to-year fluctuations in meteorological conditions. Although an increase in temperature is beneficial for crop productivity in some cooler regions of the world, drought still significantly reduces national cereal production by 9-10% on a global scale via negative effects on plant growth, physiology, and grain development (Farooq et al., 2014). Caused by reduced precipitation and increased temperature, drought has been the most important limiting factor for crop productivity and, ultimately, for food security worldwide (Daryanto et al., 2017).
Drought stress is one of the major abiotic stresses, which adversely affects crop growth and yield. Drought is the most common environmental stress affecting about 32% of the 99 million hectares under wheat cultivation in developing countries and at least 60 million hectares under wheat cultivation in developed countries (Rajaram, 2000).
Drought stress reduces plant growth by affecting various physiological and biochemical processes, such as photosynthesis, transpiration, translocation, and ion uptake, carbohydrate nutrient metabolism and growth promoters. It affects bothelongation and expansion growth which ultimately affects the yield of plants (Farooq et al., 2009). Understanding of plant responses to drought stress is of great importance and a fundamental part for making the crops tolerant to stress conditions (Zhao et al., 2008). Drought stress affect crops at all growth stages induced reducing grain yield and yield components. Drought stress at stages of stem elongation, flowering and grain filling stages induced 32%, 32% and 35% reduce in grain yield, respectively (Mirzaei et al., 2011).
Incorporation of soil amendments (cowdung, vermicompost, compost, biochar, poultry litter etc.) enhanced soil water holding capacity, soil water permeability, saturated hydraulic conductivity (SHC), reduced soil strength, modification in soil bulk density and modified aggregate stability (Peng et al., 2011). Soil amendments increases adsorption properties allowing a greater retention of water and nutrients in the soil solution. The ability to retain a relatively large quantity of water aids plant growth when under water stress. The grain yield and yield components of wheat significantly increased with the application of different organic materials resulting in the compost to be the most superior one (Sarwar et al., 2007).
3
Irrigating the crop at 60% water holding capacity and applying mineral nitrogen 60 kg/fed, with presence of the chicken manure as an organic fertilizer produced the highest wheat yield through two growth seasons (Yassen et al., 2006). Organic soil amendments (cowdung, compost, vermicompost etc.) could be an important tool to increase food security and cropland diversity in areas with severely depleted soils, scarce organic resources, and drought prone areas.
Considering the above facts the present study was undertaken with the following objectives:
➢ To investigate the effect of organic manures on the growth, yield and yield contributing characters of wheat under drought stress condition,
➢ To examine the effect of organic manures to mitigate the drought stress in wheat, and
➢ To identify the superior organic manure to mitigate the drought stress in wheat.
4 CHAPTER II
REVIEW OF LITERATURE
The growth and yield of wheat is very closely related to the availability of water at different growth stages. Time of water supply or irrigation frequencies at different growth stages is a crucial factor for successful wheat production. Water scarcity or drought hamper wheat production in many ways. A number of mitigation approaches have been tried to control drought in wheat. Limited research works are available on mitigation of drought in wheat in Bangladesh. Some of the relevant findings of the research with effect of organic manures on reduction of drought in wheat are reviewed in this chapter.
2.1 Effect of drought
Kumar et al. (2014) stated that under drought condition, contribution of dry matter partitioning from stem and leaf increased significantly under drought condition compared to well watered condition, thereby affecting crop yield.
Comas et al. (2013) stated that drought is an edaphic stress which is considered as the most pernicious from of abiotic stress and may limit more than 50% of world agricultural productivity by considerable reduction of plant growth and shoot production. Drought cumulatively effects on all plant tissues through impairing the agronomic, morphological, physiological, biochemical and metabolic traits and eventually decreases the yield attributes.
Hasanuzzaman et al. (2013) reported that under drought condition cell division reduces thus the growth of plant also reduces.
Abdoli et al. (2013) reported that drought stress decreases root length, relative water content, total chlorophyll content and photosynthesis rate.
Schneekloth et al. (2012) reported that drought condition at tillering stage of wheat decreased yield loss up to 46%. Drought stress during booting stage of wheat reduces up to 21% yield loss.
Kamoshita et al. (2004) reported that drought stress during vegetative growth, flowering and terminal period of rice cultivation, can interrupt floret initiation (which
5
cause spikelet sterility) and grain filling, respectively. On the other hand, it has been proposed that grain filling is closely linked to the whole-plant senescence process.
Sokoto and Muhammad (2014) conducted a dry season pot experiment indicated that drought stress had no significant effect on plant height at 3 weeks after planting (WAP).
But at tillering resulted to significant reduction in plant height at 6, 9, 12 and 15 WAP.
Control (unstressed) was statistically similar with drought stress at flowering and grain filling. The reduction in plant height was as a result of drought stress imposed at tillering stage. This was because imposing drought stress resulted in low leaf water potentials and reductions in photosynthesis; photosynthetic activity declines because of decreased stomatal opening and the inhibition of chloroplast activity; this reduced the length of the internodes at jointing stage which follows tillering stage. At the time when drought stress was imposed at flowering and grain filling, the jointing stage had taken place and plants had reached their maximum height, thus the effect of drought stress was ineffective.
Shahbaz et al. (2011) stated that drought hampers critical physiological as well as biochemical mechanisms in plant, which ultimately reduces crop yield.
Pirdashti et al. (2009) reported that decreases in chlorophyll content and the maximum quantum yield of PSII (Fv/Fm) on drought stressed rice. This reduction in chlorophyll content may occur due to stress-induced impairment in pigment biosynthetic pathways or in pigment degradation, loss of the chloroplast membrane, and increased lipid per oxidation.
Kato and Okami (2011) stated that the reduction in leaf water potential adversely affects the reproductive growth and canopy expansion, leading to significant yield loss.
Anjum et al. (2011) reported that drought adversely affects plant physiological performance through reduction in gas exchange in particular stomatal conductance, photosynthetic pigments and overall crop water relations. Regardless of varieties, chlorophyll content, photochemical efficiency (Fv/Fm) and leaf relative water content are also affected when drought occurs at the vegetative, flowering or grain-filling stages.
Sikuku et al. (2010) reported that panicle length was affected by water deficit as NERICA 4 had the most pronounced reduction in panicle length at the highest water deficit compared to control. They also reported that protein content decreased under
6
drought stress conditions in rice genotypes due to the disturbed protein synthesis system. They also found that drought stress affects the days to maturity and grain yield by decreasing tiller number, panicle length and field grain percentage of rice varieties.
Zhao et al. (2010) observed reduced grain yield by 60%, harvest index by 50%, plant height by 12 cm and delayed flowering by 3 days under drought stress in rice.
Majeed et al. (2011) reported that drought stress induced significant decrease in endogenous level of sugar in leaves at soft dough stage; whereas in grains, drought stress induced decreases in sugar in both cultivars.
Kamoshita et al. (2004) stated that rice genotypes with greater plant height are often larger in overall plant size, intercept more light and use water faster by transpiration, leading to lower plant water status.
Das and kalita (2010) conducted an experiment with five rice cultivars. They found that seedling length and vigor index decreased with increasing drought stress.
Lafitte et al. (2003) observed that delay usually occurs in flowering date, when rice experiences a drought deficit before flowering.
Pirdasthi et al. (2003) revealed that plant height increased at vegetative stage under aerobic as compared to flooded but at flowering stage the plant height decreased under water deficit condition as compared to flooded condition. They also observed that seedling growth decreased in rice genotypes with increasing drought stress.
Guan et al. (2010) documented that biomass production (plant height and number of tillers per plant) is more affected under vegetative stage stress whereas severe effects on sink size (spikelet fertility, 1000-grain weight and seed yield) under reproductive stage stress would be resulted.
Reynolds and Tuberosa (2008) reported that most of the high yielding popular rice varieties endowed with high yield potential and good grain quality suffers from poor adaptability to drought stress, causing substantial yield losses during years of drought.
Water uptake (WU), water-use efficiency (WUE), and harvest index (HI) were considered as drivers of grain yield.
Centritto et al. (2009) reported that drought deficit affects rice physiology in countless ways like it affects plant net photosynthesis, transpiration rate, stomatal conductance, water use efficiency, intercellular CO2, photosystem II (PSII) activity, relative water
7
content and membrane stability index. All these parameters reduce under drought in rice.
Haq et al. (2010) stated that germination and seedling growth phase is of prime importance in the growth cycle of plants as it determines the successful establishment and final yield of the crop.
Saragih et al. (2013) reported that drought stress at the early reproductive stage greatly affects the grain yield of rice. The variation in rice yield component is associated with variability in water availability at different growth stages.
Demirevska et al. (2010) reported that drought drastically reduces the leaf respiration and stomatal conductance, photosynthetic efficiency, carboxylation and water-use efficiency (WUE), carbon dioxide (CO2) diffusion and transpiration rate, enzymatic activities etc.
Shi et al. (2010) reported that generally the growing period of wheat is divided under:
vegetative and reproductive stages which are affected by drought stress Germination is the first step of plant establishment but drought reduces the germination percentage and results poor seedling establishment.
Watanabe et al. (2000) observed that drought stress generally accelerates senescence and reduces photosynthesis in susceptible varieties while water balance was maintained under tolerant varieties and keeps pace with photosynthetic activity and carbohydrate metabolism. The increases in the concentration of soluble carbohydrates in three rice cultivars leaves were founded to be remarkable during drought stress.
Kumar and Kujur (2003) reported that the period of delay is partly related to extent of stress, the rice genotypes experienced and those with longer delay will tend to produce less grain.
Keyvan (2010) stated that a reduction of wheat grain yield up to 25% and 46%
respectively, if water deficit occur after anthesis period and stem elongation stage.
Taiz and Zeiger (2010) reported that early season drought severely reduces germination and stand establishment principally due to reduced water uptake during the imbibition phase of germination, reduced energy supply, and impaired enzyme activities.
8
Busso and Fernadez (1998) reported that the radical growth of rice was decreased under drought condition.
Mostajeran and Eichi (2009) observed a decline of total, reducing and non-reducing sugar in rice seedling under drought stress. The decrease was relatively more in susceptible varieties compared to the tolerant.
Cheng and Kato (2010) found a decrease in protein content and yield of rice under drought stress condition and PEG (6000) treatment also resulted in chlorophyll loss and protein degradation in detached rice leaves. Drought induced significant decrease in endogenous level of protein contents in leaves at soft dough stage.
Borrell (1991) compared different irrigation regimes in dry seeded rice production in Australia. Flooding irrigation from sowing to maturity gave the highest grain yield, and intermittent irrigation had lowest grain yield.
Jha and Singh (1997) studied in eight rice genotypes of their response towards simulated drought stress. It was observed that seedling growth decreased with increasing drought stress. They also observed that total sugar, reducing and non- reducing sugar decreased whereas starch and phenol contents increased in eight rice genotypes with increasing drought stress.
Serraj et al. (2009) stated that drought is the major environmental constraints to what productivity in rain fed areas. At all stages of growth and development, drought is the major stress, but it has the greatest impact during flowering, where grain formation is suppressed. This results in considerable yield losses for rain fed ecosystems. Wheat sensitivity to drought stress is more pronounced during reproductive stage; even moderate stress can result in drastic reduction in grain yield.
Farooq et al. (2009) stated that a common adverse effect is the reduction in biomass production. Many studies indicate significant decrease in fresh and dry weights of shoots and roots under drought stress. Reduced fresh shoot and root weights as well as their lengths ultimately reduce the photosynthetic rate of physiology and biochemical processes of plants.
Farooq et al. (2009) reported that both cell division and cell enlargement are affected under drought owing to impaired enzyme activities, loss of turgor, and decreased energy supply.
9
Biswas and Choudhuri (1984) reported that the decrease in plant height might be due to sensitivity of reproductive phase to water status.
Renmin and Yuanshu (1989) reported that when the soil drought content lowers, the milled rice recovery and the brown rice protein content arc both significantly raised, but the percentage of unripened grain is decreased, meanwhile the amylose content in milled rice is decreased.
Jaleel et al. (2009) reported that drought causes many changes related to altered metabolic functions, and one of those is either loss of or reduced the synthesis of photosynthetic pigments. This results in declined light harvesting and generation of reducing powers, which are a source of energy for dark reactions of photosynthesis.
These changes in the amounts of photosynthetic pigments are closely associated to plant biomass and yield.
Rawgamannar et al. (1978) reported that continuous irrigation in 5 cm depth gave higher grain yield than continuously saturated irrigation.
Hsiao (1982) reported that rice is particularly sensitive to drought stress during reproductive growth, even under moderate drought stress. In rice, moderate stress can be broadly characterized by a 31 to 64% loss in grain yield as compared with non-stress conditions.
Kakade and Soner (1983) observed that continuous submergence and submergence up to flowering significantly increased the rice grain yield over alternate submergence and drying, and upland conditions. Submergence up to flowering significantly increased rice straw yields over alternate submergence and drying, and upland condition treatment.
Hussain et al. (2009) stated that drought decreases growth andproductivity owing to reductions in leaf water potential, rate of cell division, and enlargement primarily due to loss of turgor.
Jaleel et al. (2008a) stated that severe drought may result in the arrest of photosynthesis, disturbance in metabolism and finally the death of plant. It reduces plant growth by affecting various physiological and biochemical processes, such as photosynthesis, respiration, translocation, ion uptake, carbohydrates and nutrient metabolism and growth promoters.
10
Alvarez (1973) compared 4, 6, and 8 mm seven-day rotational irrigation treatment with 12.5 mm/day continuous flooding irrigation. The continuous flooding irrigation had higher yield than rotational irrigation treatments.
NeSmith and Ritchie (1973) reported that rice root porosity, number of roots, and root dry weight are low under severe stress. Transpiration of root plants began to decrease when 25% of the total extractable water was left in the root zone.
Raju (1980) observed that the flooded irrigation in reproductive stage and saturated at vegetative stage treatment had higher harvest index than flooded at vegetative stage and saturated at reproductive stage. On the other hand, continuous irrigation in 5-cm depth gave the highest grain yield, however it had the lowest harvest index.
Jaleel et al. (2008b) reported that drought is a limiting factor in agriculture production by preventing a crop from reaching the genetically determined theoretical maximum yield. In plants, a better understanding of the morphological and physiological basis of changes in water stress resistance could be used to select or create new varieties of crops to obtain a better productivity under drought conditions.
Clark et al. (2008) stated that drought hinders root branching. Under limited water supply, reduction in leaf size and leaf pubescence as well as a change in shape and leaf yellowing is observed. Furthermore, the development of new leaves and new tillers and stem expansion is slow during drought. Severe drought ends in leaf drying and finally plant death. Moreover, drought is accompanied by reduction in biomass production. All these modifications in normal status of the different tissues and organs impair with photosynthetic rate and other biochemical processes. The reduction in photosynthetic rate is due to stomatal closure that limits the diffusion of CO2, which leads to reduction of photosynthetic enzyme activity, and loss or diminision of photosynthetic pigments such as chlorophyll a and b and carotenoids resulting from the impairment in their synthesis or their post synthesis degradation. Reduction of photosynthetic rate might also be caused by the loss of the chloroplast membrane.
Shao et al. (2008) stated that drought affects both elongation as well as expansion growth, and inhibits cell enlargement more than cell division. It impairs the germination of seedlings and reduces number of tillers and plant height.
Beltrano and Marta (2008) stated that drought is a polygenic stress and is considered as one of the most important factors limiting crop yields around the world. As climate
11
change leads to increasingly hotter and drier summers, the importance of drought constraints on yield and yield components has increased.
Sarvestani et al. (2008) reported that drought at flowering stage had a greater grain yield reduction than drought at other times. The reduction of grain yield largely resulted from the reduction in fertile panicle and filled grain percentage. Water deficit during vegetative, flowering and grain filling stages reduced mean grain yield by 21, 50 and 21% on average in comparison to control respectively. The yield advantage of two semi-dwarf varieties; Fajr and Nemat, were not maintained under drought stress.
Wang et al. (2007) stated that global climatic changes such as dry spell, heat waves and uneven precipitation patterns limit water availability for farming. However, factors such as timing, intensity and duration of stress have detrimental effect on plant growth.
Water is needed at every phase of plant growth from seed germination to plant maturation and any degree of imbalance in the uptake would pose a serious threat to agriculture by adversely affecting the growth and grain yield.
Jaleel et al. (2007) reported that drought is characterized by reduction of water content diminished leaf water potential, turgor pressure, stomata activity and decreasement in cell enlargement and growth.
Zubaer et al. (2007) evaluated effect of drought at different growth stages of different three rice genotypes at three water levels (100%, 70% and 40% Field Capacity). Plant height, numbers of tillers/hill, no. of filled grains /panicle, total dry matter/hill, 1000 grain weight, grain yield and harvest index decreased with increasing drought levels.
They also conducted a pot experiment and found that at booting (106.8), flowering (85) and maturity (58.11) stage, the highest number of leaves was found in 100% FC. The number decreased gradually with increasing soil drought stress and 40% FC produced the lowest number of leaves per hill in all growing stages. They carried out a pot experiment to evaluate the performance of the genotypes under varying drought stress.
Results showed that the 1000 grain weight was reduced with reduced soil drought levels. It was anticipated that the lower soil drought might had decreased translocation of assimilates to the grain which lowered grain size. But the degree of reduction in 1000 grain size weight was different in different genotypes. Percent reduction was lower in BINA Dhan 4 (4.14 to 6.37%) than in Basmoti (6.75 to 12.5%) and RD 2585 (4.57 to 14.64%).
12
Sarvestani and Pirdashti (2008) evaluated the effect of drought stress on the yield and yield component of four rice cultivars. The different drought stress conditions were drought stress during vegetative, flowering and grain filling stages. Drought stress at vegetative stage significantly reduced plant height of all cultivars. Drought stress at flowering stage had a greater grain yield reduction than drought stress at other times.
The reduction of grain yield largely resulted by the reduction in fertile panicle and filled grain percentage. Total biomass, harvest index, plant height, filled grains unfilled grains and 1000 grain weight were reduced under drought stress in all the cultivars. Drought stress at vegetative stage effectively reduced total biomass due to decrease of photosynthesis rate and dry matter accumulation.
Kulkarni and Deshpande (2007) stated that drought stress inhibits root and shoot growth, increases transpiration rate and reduces CO2 uptake during photosynthesis.
Water shortage at crown root initiation stage of wheat causes 27% yield loss. Crop yield is reduced by 70-80% due to a drought spell during the reproductive stage.
Spikelet of wheat became sterile due to water deficit at reproductive stage.
Tahi et al. (2007) reported that plants experienced drought usually show decreased growth and development, low leaf water and turgor potentials and transpiration rates.
Sharma and Dubey (2005) observed a concomitant decrease in the content of total soluble protein with an increasing level of water deficit in root as well as shoots of growing rice seedling.
Singh (2006) reported that the productivity in rain fed uplands is poor (0.8 to 1.2 t/ha) mainly because of erratic rainfall and drought stress at flowering stage.
Hansen and Jones (2006) reported that drought increases the formation of reactive oxygen species (ROS) resulting in lipid per oxidation, protein denaturation and nucleic acid damage with severe consequences on overall metabolism.
Liu et al. (2006) stated that mild drought during grain filling in rice resulted in yield decreases of 11.6% to 14.7% while severe drought at panicle initiation, flowering and grain filling resulted in losses of up to 70%, 88% and 52% respectively. Reductions of 22% for the number of spikelet per panicle and 15% for 1000-grain weight were observed when moisture stress was applied at 7 days before heading and 10 days after heading. They also stated that decreasing water supply affects physiological, morphological and biochemical processes in plants and if that water stress occurs in
13
critical phase of plant growth, it can decrease yield and even cause crop failure. They also reported that drought could occur at any time of growing seasons. However, severity of stress on productivity depends on distribution of rainfall. Different developmental stages responds differently to drought stress. Reproductive stage during flowering is more vulnerable to stress and may cause spikelet sterility to different degrees.
Blum (2005) reported that some morphological characters such as root length, tillering, spike number per m2, grain number per spike, number of fertile tillers per plant, 1000 grain weight, peduncle length, spike weight, stem weight, awn length, and grain weight per spike and affect wheat tolerance to the moisture shortage in the soil.
Tuong et al. (2005) reported that drought resulted to decrease in plant height, number of tillers per plant, total biomass and grain yield.
Plaut et al. (2004) stated that drought at grain filling process induces early senescence and shortens the grain filling period but increases remobilization of assimilates from the straw to the grains.
Bota et al. (2004) reported that severe drought conditions limit photosynthesis due to a decline in Rubisco activity, which is an enzyme of the Calvin cycle. However, the amount of Rubisco activase, which rescues Rubisco sites from dead end inhibition by promoting ATP-dependent conformational changes, enhances under the drought stress as a protective mechanism. The up-regulation of this enzyme might alleviate the damage on Rubisco by drought.
Turk et al. (2004) stated that drought may results in delayed and reduced seed germination or many prevent germination completely.
Saneoka et al. (2004) stated that many cellular functions of plants, such as protein synthesis, nitrogen metabolism and cell membrane function can also be impaired under prolonged drought.
Chaves et al. (2002) reported least effects of moisture stress on height, number of panicles per plant, panicle length and 1000-grain weight in mid-season varieties and on number of grains per panicle and harvest index in early varieties of rice.
Pantuwan et al. (2002) reported that the delay in heading under stress was negatively associated with plant water status indicators and stress yields. The delay in heading is
14
an expression of growth retardation during the drying cycle as well as upon recovery and this delay is a strong indication of susceptibility to stress.
Rahman et al. (2002) reported that plant height, tiller number, panicle number, panicle length, number of filled grains per panicle, 1000-grain weight, harvest index (HI), total dry matter (TDM) and yield were decreased in rice with moisture stress.
Tezara et al. (2002) stated that the spikelet sterility increases under moisture stress condition which might be due to the reduction of many key metabolic functions and physiological processes in rice plant.
Hossain (2001) reported that water stress might inhibit photosynthesis and produce less amount of assimilates which resulted in lower number of leaves.
Samonte et al. (2001) reported that the occurrence of soil moisture stress affects many of the physiological processes such as photosynthesis and transpiration resulting in reduced growth and poor grain filling.
2.2 Effect of organic fertilizer to combat drought
Seghatoleslami (2013) reported that the effect of fertilizer treatment and its interaction with irrigation on seed yield in cumin was significant. In water stress conditions, higher seed yield was related to 5 t ha-1 manure + nitrogen treatment. He found that the highest harvest index (40.66) was produced for Lallemantia berica under the treatment of 150 mm evaporation from class a pan and the application of compost. He showed that manure could be used effectively to modify the impact of water shortage and to stimulate an increase in cumin seed and essential oil yields probably through improving the water holding capacity of the soil.
Kalvanagh and Heris (2013) stated that animal manure produced the highest seed number per plant, 1000-seed weight and seed yield of dragon's head (Lallemantia iberica) 5.67 g and 5.65 g respectively.
Adams et al. (2013) found in a greenhouse study that the water holding capacity nearly doubled when 15% poultry litter biochar by weight was added to 9 kg of sandy loam soil. The ability to retain a relatively large quantity of water aids plant growth when under water stress.
Liu et al. (2013) reported that organic fertilizer increased the soil water holding capacity by increasing the percentage of macro-aggregates (>0.25 mm) and soil nutrients, which ultimately improved yield and water use efficiency.
15
Artiola et al. (2012) conducted a greenhouse study and found that soil amended with 2% and 4% biochar by weight (15 kg of loamy sand used) had higher yields than control plants after undergoing water stress.
Abass and Mohamed (2011) reported that the proline content significantly increased in leaf of soybean plants when the soil was treated with the different doses of biochar as compared with drought stressed plants and control plants. In well watered condition proline content increased by 14.81 and 25.92% when biochar was applied as 25 and 50 t ha-1, respectively compared to no biochar application. On the other hands it was 22.58 and 38.70% compared to no biochar application when biochar was applied at the same doses under drought condition. They also reported that photosynthetic pigments contents in leaves of common bean plants were highly significantly decreased with increasing the level of drought stress. The reduction in chlorophyll content under drought stress has been considered a typical symptom of oxidative stress and may be the result of pigment photo-oxidation and chlorophyll degradation. The decrease in the photosynthetic activity under drought stress may be due to stomatal or non-stomatal mechanisms. Stomata closure is one of the first responses to drought stress which result in declined rate of photosynthesis. The drought induced reduction in the chlorophyll content could be attributed to loss of chloroplast membranes, excessive swelling, and distortion of the lamellae vesiculation and the appearance of lipid droplets. Addition of biochar in soil increased chlorophyll content under well water and stress conditions although it was not significant in case of chlorophyll a and total chlorophylls. In well water condition total chlorophyll content increased by 3.31, 3.12, 1.56% and water stress condition it was 7.25, 29, 17% when biochar application rate was 25, 50 and 100 t ha-1, respectively. Highest increased of chlorophyll content was found under water stress condition when soil wastreated with biochar @ 50 t ha-1.
Vaccari et al. (2011) stated that biochar can increase the cation exchange capacity of soils, soil pH and water holding capacity, which would improve nutrient and water availability in the soils and thereby improve growing conditions for plants. Some other studies have found increased above and below ground biomass with biochar addition as well as increased plant height and leaf area which ultimately helps to increase grain yield of crops.
Karhu et al. (2011) reported that incorporation of biochar to soil enhanced soil water- holding capacity, improved soil water permeability, improved saturated hydraulic conductivity (SHC), reduced soil strength, modification in soil bulk density (ρb) and
16
modified aggregate stability. Due to its physical properties, biochar help to increase water holding capacity and reduces nutrient leaching.
Ahmadian et al. (2011) stated that organic compost is a rich and a slow release fertilizer which using leads to a clean product of plants, continuous supply of nutrients, which improve some physical properties of soil, increase water retention than that for chemical fertilizers and improves the soil texture. The structural improvement can encourage the plant to have a good root development by improving the aeration in the soil, which leads to a higher plant vegetative growth. They also reported that with essential elements, increases growth, number of umbrella per plant and manure application improves the soil structure and soil moisture content, provides plant biological yield and finally led to increase seed yield of field pea.
Gaskin et al. (2010) reported that biochar addition increased the overall accumulation of osmotic active substances such as K+ in the plant tissues, likely due to its large cation content, leading to an improved plant water uptake which ultimately increased water content in leaf.
Lakhdar et al. (2009) reported that composts are used to improve soil fertility and quality because they can increase organic matter content, especially in sandy soils which have low water and nutrient holding capacity.
Tejada et al. (2009) stated that by increasing soil organic matter content, composts improve soil physical properties such as structural stability, total porosity, hydraulic conductivity, aggregate formation and water holding capacity.
Johnson et al. (2009) showed that poultry and food waste compost increased the water retention capacity of a sandy soil two years after application. Compost produced from organic dairy cattle manure can result in higher soil water content under Kentucky bluegrass (Poa pratensis L.) after 8 days without addition of water. They also reported that despite the strong effect on gas exchange during drought, plants with incorporated compost were able to recover rapidly after re-watering which is most likely due to the greater root system and thus ability to take up the added water.
Dehnavy et al. (2009) reported that maximum leaf chlorophyll index was obtained by applying animal manure and minimum index was obtained at no animal manure.
Courtney and Mullen (2008) reported that incorporated and mulched compost enhanced soil water content at field capacity (FC) and permanent wilting point (PWP) but only incorporated compost increased total available water (TAW). The increased TAW with
17
incorporated compost is likely due to greater organic C content as organic C can increase soil water holding capacity (WHC).
Bhattacharyya et al. (2007) studied change in soil physical properties due to organic matter addition under dry tropical conditions in India. In both cases, farmyard manure addition to soils with loamy sand and silty clay loam texture and low initial organic carbon of 2 and 7 g kg-1 total organic carbon (TOC) respectively, enhanced aggregation, resulting in higher saturated hydraulic conductivity.
Lehmann et al. (2006) reported that application of biochar in Triticum aestivum L. not only improve the availability of nutrients but also promote vegetative growth by improving the photosynthetic pigments chlorophyll (a, b and total) under stressed condition.
Dang et al. (2006) suggested that fertilization increases the availability of limited nutrients, and then could alter system properties, which might be a potentially practical way to stimulate plant growth, enhance stress tolerance, and improve the efficiency of using finite resources in infertile and dry environments.
Silva et al. (2006) reported increasing in maize 1000-seed weight by animal manure under drought stress.
Curtis and Claassen (2005) stated that the effect of compost on plant growth is most likely to increased nutrient availability, which resulted in increased shoot N and K concentrations. The higher K concentration may have contributed to conservation of water during drought and the more rapid recovery of plants with incorporated compost after re-watering because it is well known that K is important for plant water status, turgor pressure of cells and stomata regulation.
Osborne et al. (2002) reported that biological yield of corn increased by consumption of animal and chemical fertilizers.
Shirani et al. (2002) showed a strong increase in soil organic matter on an arid silty clay loam with 5 g kg-1 total organic carbon (TOC) in Iran by addition of farmyard manure, resulting in improved aggregation, lower bulk density, higher saturated hydraulic conductivity and nearly double dry matter yield of irrigated corn.
Siddique et al. (2001) reported that relative water content increased by addition of biochar both in well water and water stress conditions. In well water condition relative water content increased 3.83, 5.25 and 3.51% and in water stress condition it was 4.35, 6.81 and 4.92% by addition of biochar @ 25, 50 and 100 t ha-1,respectively.
18 CHAPTER III
MATERIALS AND METHODS
The pot experiment was conducted at the net house of Sher-e-Bangla Agricultural University Farm, Dhaka during the period from November 2017 to April 2018. This chapter deals with a brief description on experimental site, climate, soil, land preparation, layout, experimental design, intercultural operations, data recording and their analyses.
3.1 Experimental site
The experiment was conducted at the Sher-e-Bangla Agricultural University Farm, Dhaka - 1207, under the Agro-Ecological Zone of Madhupur Tract (AEZ-28). The land area is situated at 23°41′N latitude and 90°22′E longitude at an altitude of 8.6 meter above the sea level. The experimental site is shown in the AEZ Map of Bangladesh in Appendix I.
3.2 Climate
The experimental area is under the sub-tropical climate that is characterized by high temperature, high humidity and heavy rainfall with occasional gusty winds in kharif season (April-September) and less rainfall associated with moderately low temperature during the rabi season (October-March). The details are presented in Appendix II.
3.3 Soil
The experimental area’s soil belongs to the general soil type, Shallow Red Brown Terrace Soils under Tejgaon Series. Top soils were clay loam in texture, olive-gray with common fine to medium distinct dark yellowish brown mottles. The experimental area was flat having available irrigation and drainage system. The land was above flood level and sufficient sunshine was available during the experimental period. Soil samples from 0-15 cm depths were collected from experimental pot. The analyses were done by Soil Resources and Development Institute (SRDI), Farmgate, Dhaka. The physicochemical properties of the soil are presented in Appendix III.
19 3.4 Planting material
Seeds of BARI Gom-28 were collected from Bangladesh Agricultural Research Institute (BARI), Joydebpur, Gazipur, Bangladesh. This is a high yielding, short stature and early maturing variety. Plant height becomes 95-100 cm. It takes 60-65 days for heading. It is highly tolerant to terminal heat stress due to its earliness and grain yield 15-20% higher under late seeding. Grains per spike 45-50. Grains are white, amber in color and medium in size. Its 1000-grain weight is 35-40 g. The variety is resistant to leaf rust and moderately tolerant to Bipolaris leaf blight. Grain yield potentially is about 3.5-5.4 t ha-1. Duration of the crop is about105-110 days.
3.5 Treatments
The following treatments were included in this experiment:
Factor A: Organic manure - 3 levels i. F0 = Control
ii. F1 = Cowdung 10 t ha-1 iii. F2 = Vermicompost 7 t ha-1 Factor B: Drought stress - 4 levels
i. D0 = Control
ii. D1 = Drought in crown root initiation stage (20-29 DAS) iii. D2 = Drought in booting stage (45-54 DAS)
iv. D3 = Drought in anthesis stage (55-64 DAS) 3.6 Conduction of the experiment
3.6.1 Seed collection
The seeds were collected from Bangladesh Agricultural Research Institute (BARI), Gazipur-1701, Dhaka.
20 3.6.2 Preparation of pot
The collected soil was sun dried, crushed and sieved properly. The soil and fertilizers were mixed well before placing the soils into the pots (having 24 cm top, 18 cm bottom diameter and 22 cm depth). Then each pot was filled up with 18 kg soil.
3.6.3 Moisture measurement (%)
Moisture meter (Model - DSMM 500) was set up in 3 different location of a pot and 3 individual data was recorded. Then its average data was recorded to have moisture percentage by gravimetric method. The moisture percentage of the soil are presented in Appendix IV.
3.6.4 Fertilizer dose and method of application
Urea, TSP, MOP, gypsum and boric acid were applied @ 160 kg N, 92 kg P, 144 kg K, 20 kg S and 1.5 kg B per hectare, respectively. Cowdung and vermicompost were applied according to the treatment. Two-third of urea and all other fertilizers were applied at the final pot preparation as basal and the rest one-third urea was top dressed at 1st irrigation (18 days after sowing) (FRG, 2012).
3.6.5 Design of the experiment
The experiment was laid out in Completely Randomized Design (CRD) with three replications. There were 36 pots all together replication with the given factors.
3.6.6 Seed sowing
Before placing the seeds into pots, germination test were done. Eight healthy seeds were placed into each pot. After germination, three healthy seedlings were allowed to grow in each pot.
3.7 Intercultural operation 3.7.1 Thinning
Continuous observation was done after seed sowing. Keen observation was made for thinning to maintain three seedlings. Thinning was done to maintain spacing in the pots.
Three healthy seedlings were allowed to grow in each pot.
21 3.7.2 Weeding
During plant growth period two hand weeding’s were done. First weeding was done at 20 days after sowing followed by second weeding at 15 days after first weeding.
3.7.3 Irrigation
Irrigations were given according to treatments of the experiment.
3.7.4 Plant protection measure
The crop was infested by aphid (Aphis spp.). Therefore, Thiamethoxam (Actara) was used @ 52 gm/hato control aphid.
3.7.5 General observation of the experimental pots
Observations were made regularly and the plants looked green. No lodging was observed at any stage. The maximum tillering, panicle initiation, and flowering stages were not uniform.
3.7.6 Harvesting and threshing
The crop was harvested at full maturity. Plants of each pot was bundled separately with tag mark indicating the respective treatment combinations and brought to the threshing floor for threshing and recording data on yield and yield contributing parameters.
3.8 Data collection
Data collections from the experiment on different growth stages were done under the following heads as per experimental requirements.
Phenological and yield attributed data:
i. Plant height (cm)
ii. Number of effective tillers plant-1 iii. Spike length (cm)
iv. Number of spikelet spike-1 v. Number of grains spikelet-1 vi. Number of grains spike-1
22 vii. Weight of 1000 grain (g)
Yield and harvest index data:
viii. Grain yield (g plant-1) ix. Straw yield (g plant-1) x. Biological yield (g plant-1) xi. Harvest index (%)
3.9 Procedures of recording data
A brief outline of the data recording procedure is given below:
3.9.1 Plant height (cm)
Plant height was measured at 20 days interval starting from 20 days after sowing (DAS) and continued up to harvest. The height of the plant was determined by measuring the distance from the soil surface to the tip of the leaf before heading, and to the tip of spike after heading. The collected data were finally averaged.
3.9.2 Number of effective tillers plant-1
Number of effective tillers plant-1 were counted from the pots after harvesting and finally averaged.
3.9.3 Spike length (cm)
The spike length (cm) was measured with a meter scale from the plants of each pot and the average value was recorded as per plant.
3.9.4 Number of spikelet spike-1
The number of spikelet were counted in each spike and average value of 10 spike was used to determine the number of spikelet spike-1.
3.9.5 Number of grains spikelet-1
The number of grains were counted in each spike and averaged and then expressed as number of grains spikelet-1.
23 3.9.6 Number of grains spike-1
The number of grains were counted in each spikelet and averaged and then expressed as number of grains spike-1.
3.9.7 Weight of 1000 grain (g)
One hundred (100) grains from each pot were randomly selected and weighed by an electric balance after sun dried and then the weight was multiplied with 10 to have weight of 1000 grain.
3.9.8 Grain yield (g plant-1)
Grain harvested from each pot was sun dried and weighed carefully. The dry weight of the grains of the plant was recorded, and then divided by 3 for per plant grain yield.
3.9.9 Straw yield (g plant-1)
Straw obtained from each pot was sun dried and weighed carefully. The dry weight of straw of the plant was recorded, and then divided by 3 for per plant straw yield.
3.9.10 Biological yield (g plant-1)
Grain yield and straw yield were all together regarded as biological yield and calculated with the following formula:
Biological yield (g plant-1) = Grain yield (g plant-1) + Straw yield (g plant-1) 3.9.11 Harvest index (%)
Harvest index was calculated by dividing the economic (grain) yield from the net pot by the total biological yield (grain + straw) from the same area and multiplying by 100.
Harvest index (%) = (Grain yield/Biological yield) × 100
3.10 Statistical analysis
The data were compiled and tabulated in proper form and were subjected to statistical analysis. Analysis of variance was done following the computer package MSTAT-C program developed by Russel (1986). The mean differences among the treatments were adjusted by Least Significant Difference (LSD) test at 5% level of significance (Gomez and Gomez, 1984).