POTENTIAL FISHING ZONE (PFZ) ADVISORY FOR THE BAY OF BENGAL, BANGLADESHI AREA
BY
ESMOTARA SUKHY ID: 173-15-10354
AND
NABILA AHMED EVA ID: 173-15-10304
This Report Presented in Partial Fulfillment of the Requirements for the Degree of Bachelor of Science in Computer Science and Engineering
Supervised By
Dr. Sheak Rashed Haider Noori
Associate Professor & Associate HeadDepartment of CSE Daffodil International University
DAFFODIL INTERNATIONAL UNIVERSITY
DHAKA, BANGLADESHDECEMBER 2020
APPROVAL
This Project titled “POTENTIAL FISHING ZONE (PFZ) ADVISORY FOR THE BAY OF BENGAL, BANGLADESHI AREA”, submitted by *Esmotara Sukhy* ID No: 173-15-10354 and
*Nabila Ahmed Eva* ID No: 173-15-10304 to the Department of Computer Science and Engineering, Daffodil International University, has been accepted as satisfactory for the partial fulfillment of the requirements for the degree of B.Sc. in Computer Science and Engineering and approved as to its style and contents. The presentation has been held on *27-Jan-2021*
BOARD OF EXAMINERS
Dr. Touhid Bhuiyan Chairman
Professor and Head
Department of Computer Science and Engineering Faculty of Science & Information Technology Daffodil International University
Gazi Zahirul Islam Internal Examiner
Assistant Professor
Department of Computer Science and Engineering Faculty of Science & Information Technology Daffodil International University
Raja Tariql Hasan Tusher Internal Examiner Senior Lecturer
Department of Computer Science and Engineering Faculty of Science & Information Technology Daffodil International University
Dr. Dewan Md. Farid External Examiner
Associate Professor
Department of Computer Science and Engineering United International University
DECLARATION
We hereby declare that, this project has been done by us under the supervision of Dr. Sheak Rashed Haider Noori, Associate Professor & Associate Head, and Department of CSE Daffodil
International University. We also declare that neither this project nor any part of this project has been submitted elsewhere for award of any degree or diploma.
Supervised by:
Dr. Sheak Rashed Haider Noori Associate Professor & Associate Head Department of CSE
Daffodil International University
Submitted by:
Esmotara Sukhy
Esmotara Sukhy
ID: -173-15-10354 Department of CSE
Daffodil International University
Nabila Ahmed Eva
Nabila Ahmed Eva ID: -173-15-10354 Department of CSE
Daffodil International University
ACKNOWLEDGEMENT
First we express our heartiest thanks and gratefulness to almighty God for His divine blessing makes us possible to complete the final year project/internship successfully.
We really grateful and wish our profound our indebtedness to Dr. Sheak Rashed Haider Noori, Associate Professor & Associate Head, Department of CSE Daffodil International University, Dhaka. Deep Knowledge & keen interest of our supervisor in the field of Potential Fishing Zone to carry out this project. His endless patience, scholarly guidance, continual encouragement, constant and energetic supervision, constructive criticism, valuable advice, reading many inferior draft and correcting them at all stage have made it possible to complete this project.
We would like to express our heartiest gratitude to Dr. Sheak Rashed Haider Noori, Associate Professor and Associate Head, Department of CSE, for his kind help to finish our project and also to other faculty member and the staff of CSE department of Daffodil International University.
We would like to thank our entire course mate in Daffodil International University, who took part in this discuss while completing the course work.
Finally, we must acknowledge with due respect the constant support and patients of our parents.
ABSTRACT
‘Blue economy’ is the concept of utilizing the resources of the sea and it is the new horizon of socioeconomically development of Bangladesh. The potential fishing zone advisory is the major part of the Blue economy. More than 17 million people are engaging with the fisheries where 1.4 million People directly employed and 11 million people indirectly involved by the fisheries sector for their livelihood. Fisheries play a major part in the national economy, foreign exchange earnings, employment and nutrition. More than 18 peoples are directly and indirectly involved in fisheries for their livelihood. But they face difficulties in catching fish, they waste their huge time, fuel and cost to searching fishes. The fishing community in our country does not also take the initiative to go to the deep sea for catching fish. But on the sea huge amount of fishes are available but for not knowing the location they cannot catch fishes according to their desire and needs. Our advisory system of Potential fishing zone is to help to solve these issues. We will provide the area information of Potential Fishing Zone so that Fishing Community can go directly on that location and can catch fish without wasting time, fuel and cost. In fact, they will be benefited highly more than before so the
Country as well. NASA Ocean Color websites provide the Chlorophyll-a and SST Level -3 (4K) Satellite images. And we are processing these images and developing the model to advise the potential Fishing Zone. The main goal of our advisory system is to provide the target location, livelihood of fishes to the Fishing Community. Through the Chlorophyll-a and SST concentration, we can detect the current livelihood of fishes. So the fishing community will be able to know the exact area of where the fishes are available now potentially. Once they know the location they can go to that location directly. Within a very short time, they can catch a huge amount of fishes.
TABLE OF CONTENTS
Contents Pages
Board of examiners ... i
Declaration ... iii
Acknowledgements ... iv
Abstract ... v
CHAPTER 1: INTRODUCTION ... 1-5
1.1 Introduction ...1
1.2 Motivation ...2
1.3 Problem Definition ...2
1.4 Research Questions ...3
1.5 Research Methodology ...3
1.6 Research Objectives ...3
1.7 Research Goal ...4
1.8 Research Gap ...4
1.9 Research Layout ...5
CHAPTER 2: BACKGROUND ... 6-10 2.1 Introduction ...6
2.2 Related Works ...6
2.3 Challenges ...10
CHAPTER 3: RESEARCH METHODOLOGY ... 11-13 3.1 Research Subject and Instrumentation ...11
3.2 Data Collection Procedure ...11
3.3 SeaDAS Software ...13
3.4 Chlorophyll-a and Sea Surface Temperature ...13
CHAPTER 4: DATA ANALYSIS ... 15-25 4.1 The Targeted Area of Bay of Bengal ...15
4.2 Chlorophyll-a Image Processing and Analysis...16
4.3 SST Image Processing and Analysis ...20
4.4 Target Area Analysis and Discussion ...21
4.5 The Process ...25
CHAPTER 5: IMPACT ON SOCIETY AND ENVIRONMENT ...26
5.1 Impact on Society ...26
5.2 Impact on Environment ...26
CHAPTER 6: CONCLUSION AND FUTURE SCOPE ...27
6.1 Conclusion ...27
6.2 Future Scope ...27
REFERENCES ... 29-30 FIGURES PAGE NO Figure 4.1: Maritime area of Bangladesh 15 Figure 4.2: The Chlorophyll- a Concentration analyzed image on SeaDAS 16 Figure 4.3: The Chlorophyll-a Image with Pixel Info-One 17 Figure 4.4: The Chlorophyll-a Image with Pixel Info-Two 18 Figure 4.5: The Chlorophyll-a Image with Pixel Info-Three 18
Figure 4.6: Chlorophyll locations on World Map 19
Figure 4.7: The Sea Surface Temperature Analyzed image on the SeaDAS 20 Figure 4.8: The area on Map of the Sea Surface Temperature area 21
Figure 4.9: Sea Surface Temperature Maps 21
Figure 4.10: Chlorophyll Maps 22
Figure 4.11: True Color Maps 22
Figure 4.12: Target Area 23
Figure 4.13: Target Region 24
Figure 4.14: The Process Flowchart 25
CHAPTER 1 INTRODUCTION 1.1 Introduction
Bangladesh is blessed with the largest coastline area about 47,201 km2 and the sea area is about approximately 2, 07,000 square kilometers and 166,000 sq. km. water area with the Exclusive Economic Zone (EEZ). Shamsuzzaman et al. [1] Fisheries sector contributed to national GDP 3.57%, and 25.30% to the agricultural GDP and 1.5% to the foreign exchange earnings by exporting fish. Fish provides 60% of national animal protein consumption. Fishing is only limited within 200-meter depth from the coastal area. Only 255 trawlers, mechanized boats about 67669 and also nonmechanized boats are engaged in fishing. But the marine fisheries sector, the deep sea and pelagic resources are not utilizing properly, it is still untapped.
According to the area of our sea and the potential fish resources we have on the sea we are getting a small amount from them. But for the lack of proper management and coast, the fishing communities are not focusing on the deep sea fishing. The fishing communities are not taking any initiative for searching the fish and going to catch the fish on the sea for the cost of fuel, machine, management and searching time. For this reason our huge amount of potential resources we are not using or getting properly. So providing the potential fishing zone advisory will help them to overcome these issues. They will be beneficial by the better catch so the country too with the PFZ Advisory.
Shamsuzzaman et al. [1] More than 17 million people about 1.4 million women depend on the fisheries sector for their livelihoods through fish handling, processing, fishing, farming. But The Fisherman lives the very poor livelihood and the fishing community is not getting the required fishes from the sea. So our main goal is to provide the Potential Fishing Zone forecasting so that the farmers can know the location of PFZ area and can go to that location directly without wasting their time and fuel overall cost and with a better catch. The potential Fishing zone advisory system will provide the PFZ and the fishing community overall our country will be benefited.
1.2 Motivation
We have a huge coastline area and a water area of the Bay of Bengal. But for the proper management and lack of technologies we are not able to take the advantage of having the huge fish resources from the Bay of Bengal, Bangladeshi area. The fisheries are the second-largest export contribution but it is without utilizing the marine resources. So if the potential fishing advisory system helps the fishing community to have a better catch that will be highly beneficial for all also the economy of Bangladesh will be increase. It could be the first and best export earnings source as there are huge potential fishing zones are available. Also, the livelihood of the fisherman to fishing communities is very poor. Their lifestyle will be updated; the rural coastal area will be an urban area gradually. So we are going to help the fisherman to know the potential fishing zone area. And we are hoping that it will be helpful for the fishing communities and socio-economic growth of Bangladesh.
1.3 Problem Definition
We are trying to provide the advisory system of Potential Fishing zone for the fishing communities of Bangladesh. Our Advisory system will help the fishing community to know the fishing zone area earlier and then they will go to that location to catch the fishes. We choose the Chlorophyll-a concentration and Sea Surface Temperature images from the NACA Ocean Color website and processing the images on the SeaDAS software to know the fishing zone area.
1.4 Research Questions
The main questions which are focused in this thesis are given below:
• How potential fishing zone works and how Bangladesh can use it.
• How can we use the Potential fishing zone advisory system for our Bay of Bengal like so many other countries are using?
• Why we need the images, data of Chlorophyll-a & Sea Surface Temperature?
• Why we are processing the images on SeaDAS Software?
• What is the reason for using the Data of the NASA Ocean color website?
• How do we determine to use this Data, method for the potential fishing zone?
• How the fishing community will use the Potential Fishing Zone Advisory system?
1.5 Research Methodology
At this state we explain the process of data collection, data processing, and overall impact on society, the output.
1.6 Research Objectives
Potential Fishing zone advisory is beneficial for the fisherman, fishing community of Bangladesh.
There are some objectives of our research.
• Know the fishing zone in advanced.
• The better fishing catch
• Improve the livelihood of the fisherman and women
• Increasing the Export earnings
• Meat the protein intake for the nation.
1.7 Research Goal
Our goal is to help to forecast the Potential Fishing Zone using the Chlorophyll-a and Sea Surface Temperature images of the Aqua-MODIS (Moderate Resolution Imaging Spectroradiometer) satellite which is available on the NASA Ocean color website. We have huge resources in our area of Bay of Bengal but the utilization of the resources is very poor also the lifestyle of fisherman and women. Bangladesh has a high potential fishing zone on the Bay of Bengal area but the fishing communities are not taking any initiative to utilize the resources due to the cost as well as not having proper technological guidelines. Another issue is fishing communities peoples are most illiterate so they cannot use any technologies for a better catch. So our goal is to provide the Potential Fishing Zone area Advisory system to them so that they can go to that area location to have the best catch. We collect the images of the Chlorophyll and Sea Surface Temperature and process the images on the SeaDAS software.
Our goal is to inform the fishing communities the Potential Fishing Zone in advanced.
1.8 Research Gap
So many countries are using the Remote sensing potential fishing zone Advisory system. But Bangladesh has not started the ‘Blue economy’ yet. Our marine resources are not properly utilizing yet. The fishing community does not use any technologies for the better fish catch.
Fishing communities do not know how to use the Chlorophyll-a and SST concentration images of AQUA MODIS satellite. The local Fisherman does not even know how to browse the NASA Ocean Color website. We are providing the model of the Potential Fishing Zone Advisory by processing the images of the chlorophyll-a and SST on the SeaDAS software.
1.9 Research Layout
Chapter 1: We described in the first chapter our research introduction, motivation, Problem Definition, Research Question, Research Methodology, Research Objective, Research Goal, Research Gap and Expected Results.
Chapter 2: We discussed in the second chapter about the Background of this research and the related works and the Challenges also the current status of Bangladesh perspective.
Chapter 3: We described in chapter three the Research Methodology about the Research subject and Instrumentation, Data Collection The procedure, SeaDAS Software, Chlorophyll- a and sea Surface Temperature.
Chapter 4: This chapter four is the Data Analysis chapter. Here we discussed and showed the targeted area of Bay of Bengal by images. We discussed the Chlorophyll-a Image processing and analysis, SST image processing and Analysis, Target area analysis and discussion, and the process discussion.
Chapter 5: Here we discussed the Impact on society and environment.
Chapter 6: Lastly we describe the conclusion and future scope.
CHAPTER 2 BACKGROUND
2.1 Introduction
This is the 21st Century and the modern technologies updated dramatically. Bangladesh is the developing country and we need to upgrade our system from every aspect. The marine fishing community is not being updated that much according to the inland fisheries. So, it is the most important things to use the Potential Fishing Zone to have a better catch than before. We need to adopt modern Technologies for the Fisheries sector. Blue growth and the satellite images use are very common in so many countries but in our country, the fishing communities barely know about it.
Our study will help them to use the Potential Fishing Zone.
2.2 Related Works
The Potential Fishing Zone advisory system is very helpful and effective for the Fishing Communities. By processing the images of Satellite find out the Potential Fishing Zone is one of the best modern methods for fishing nowadays. ‘Blue economy’ project is the utilization the blue growth, utilization of the resources of the sea. Already the Developed countries developed these projects and being benefited. So many researchers have already researched about the Potential Fishing zone for their targeted area and fishes.
Santos et al. [2] presented the applications of remote sensing methods for fisheries using he airborne, and active-passive satellite technology for the mainly USA and Japan countries.
Solanki et al. [3] evaluated the satellite-based PFZs forecast system using the integration of Ocean
Color Monitor, Chlorophyll Concentration, Sea Surface Temperature, and Advanced Very HighResolution Radiometer. The study area was the Gujarat Coast of India. And also compared the normal catch and the PFZs Catch and observed higher catches using this method.
Choudhury et al. [4] uses the Chlorophyll-a concentration and SST Data from the NOAA- AVHRR (NOAA-Advanced very high-resolution radiometer) and the sensor IRS-P4 OCM (Ocean color monitor) for validation of integrated PFZs. Conducted the exercises from 2002 to 2004 and on different months of the years to compare the results.
Tummala et al. [5] derived the benefits of using the Potential Fishing Zone (PFZ) for fishermen. The INCOIS used the Geographic Information System and Remote Sensing techniques. The Satellitederived Sea Surface Temperature and Chlorophyll data are the general inputs for calculation of the data and information. The features they derived on this research paper that the meandering patterns, oceanic fronts, rings, eddies, and the up-welling areas recognized from the images of the satellite.
And finally transferred to the navigational charts and given as PFZ advisories.
Khalil et al. [6] analyzed the spatial variability and seasonal of chlorophyll-a and sea surface temperature in the East Kalimantan waters. They used an algorithm called MODIS SST split window and empirical Chlorophyll-a OC-3M algorithm and used the Level 2 MODIS SST and Chl-a images. Different values like negative and positive variables found on a different season of the year. The research approach of the paper is data preparation from the Literature review and Satellite Images. Then the image processing from the images of the AQUA MODIS is first of all the Atmospheric and the Geometric correction. After that the masking land and cloud and find out the cloud covers % statistic determination. They monitored the data from different seasons the SST dry season; SST wet Season, Chl-a dry season, Chl-a wet season. Then the next step is to the correlation between SST & Chl-a in near shore and in open shore. Finally, they analyzed the Accuracy assessment measurement and the Report Writing.
Saitoh et al. [7] the operational applications of the satellite GIS and remote sensing for aquaculture and sustainable fisheries. On this paper the model of the research paper and data analysis executing processed they provide with so many steps. The first step is spatial data construction through Satellite data and map data (analogue and digital). Secondly criteria map constructions (factors and constraints) then the Score and weight determination; GIS models, and the suitable sites for scallop aquaculture. After collecting these data they analyzed the data by increasing the SST and sea the result to get provide the prediction according to the climate change approach.
Maity et al. [8] the authors analyzed the west Bengal coastal water Integrated Potential Fishing Zone Advisories which is satellite-based. The Sea Surface Temperature and ocean color chlorophyll-a data for prediction of the Potential Fishing zone in the Coastal area of West Bengal. They used the NOAA AVHRR the advanced very high-resolution radiometer (AVHRR) and AQUA MODIS satellite and MCSST Multi-channel sea surface temperature (MCSST) algorithm. Data Collected from October 2008 to February 2009. The INCOIS generates total of 16 PFZ advisories.
Dan et al. [9] analyzed the relationship between the chlorophyll-a and sea surface temperature for the potential fishing zones of the fish Rastrelliger kanagurta fish using the GIS t and Remote sensing technique. Found the positive and negative correlation between the chlorophyll-a and sea surface temperature and the accuracy of the analysis was 76.9%. The study indicates the integration of the geographic information systems (GIS) with the remote sensing technology, statistical modeling, the chlorophyll-a and SST concentration is able to provide the potential fishing grounds of R. Kanagurta.
This study helps to take decision making with decreased the searching time and cost and effort.
Geronimo et al [10] this is the fisheries surveys which is used for the suitable fishing grounds and mapping fishing activities with the images of Nighttime satellite and using the Maximum entropy modeling. They used the satellite images at night to find out the fishing zones in the Philippines and used the powerful lights to attract the pelagic fishes of the coastal area. Also,
they used the VIIRS the Visible Infrared Imaging Radiometer Suite which was extracted by U.S. NOAA and nightly boat to detect the data. The time period was from 2012 to 2016, covering nights as 1713, and identified 134 core fishing areas (CFAs) between the area from 6 to 23, 215 km2 within the coastal area of Philippines contagious maritime boundary.
Maulina et al. [11] the study determines the potential fishing zones for the Sardinella Fimbriata in the area Java Sea using the AQUA MODIS satellite. The study area is the Java Sea and with the potential pelagic fish. The time period of analysis was 3 years from 2016 to 2018 using the satellite images. This researched showed the results of highest catch vale while the SST was 28,86°C and chlorophyll-a concentration was 0,55 mg/m3 in the Java Sea during the time period from 2016 to 2018 when the transitional season occurred.
Prabiantissa et al. [12] observed the potential fishing zone on the Madura Coastal area by using the segmented images of the satellite. Their system design was with 5 phages the Data collecting, the Pre-processing, Feature Extraction and Overlay & Segmentation, and Observation. Under these phages there are sub phages are also exist. They collected data from Landsat 8. After that, they preprocessing the data using the Reflectance values and NDWI observed the data lastly after completing all the phases of data analysis.
Giri et al. [13] this study observed the implemented of a spatial model to execute the potential fishing zones in the coastal area of West Bengal India. They used the sea surface temperature and chlorophyll concentration to build up a spatial model to determine the potential fishing zone. The time period of analysis was the two consecutive winter seasons of 2010-11 and another season was from 2011-12. They used the Histogram and statistical analysis to see the pixels value.
INCOIS et al. [14] Indian National Centre for Ocean Information Services has the potential fishing zone advisory system. They have a few sectors area and also provide the data with so many languages. They have a 14 sector the potential fishing grounds which is Gujarat, Goa, Maharashtra, Kerala, Karnataka, North Tamilnadu, south Tamilnadu, South Andhra Pradesh, North Andhra Pradesh, West Bengal, Odisha, Andaman, Nicobar, and Lakshadweep. INCOIS has not only 14 sectors they provide the data through multiple languages. So it is called multi-
lingual PFZ advisories. Also provides the data through different medium like the website, Doordarshan, news media, radio, email, fax, telephone, mobile application. But at the first basic phase, the showed the data by the text form through the primitive LED boards installed at few sites or locations.
FishTrack et al. [15] The Fish Track provides Deep Sea Fishing Features and Charts and provides the potential fishing zone. The area covers the fish tracks are Africa, ASIA, Atlantic, Australia, Caribbean, Central America, Europe, Indian Ocean, Mexico, Middle East, New Zealand, North America, Pacific, South America, also anyone can contact with them to get the chlorophyll and SST images of the satellite. They provide the raw images too.
RipCharts et al. [16] Rip Charts provides real-time satellite imagery to fishermen. Pinpoint favorable fishing conditions using Sea Surface Temperature, Chlorophyll data and provides the Potential Fishing Zone.
This research paper provides highly valuable knowledge and direction for our research paper.
The papers presented that they use so many different techniques for the potential fishing zone forecasting. We are going to use the chlorophyll- a and SST images of AQUA MODIS satellite which is found on NASA Ocean Color websites. As in our country, we do not have our own satellite for that reason we are using the images of NASA’s satellite to forecast the potential fishing zone for the Bay of Bengal, Bangladeshi area.
2.3 Challenges
Our goal is to forecast the potential fishing zone using the Chlorophyll-a and SST images.
According to the condition of the fishing communities, we need to adopt this new modern technologies system of fishing. Though there are few challenges are available like most of the fisherman and women are illiterate. They will not be able to use the technologies directly. So for the first initiative stage needs to provide them the PFZs information on the LED primitive
monitoring system. And needs to get the feedback from the fisherman after using the forecasting and compare the results and needs to update the model, system, image processing.
CHAPTER 3 RESEARCH METHODOLOGY
3.1 Research Subject and Instrumentation
Remotely sensed Environmental Data, The primary satellite data is Level 3 Chlorophyll and SST (4K) Data and Level 1 & 2 Data found from the NASA Ocean Color (oceancolor.gsfc.nasa.gov) and analyze the data on the SeaDAS. Monthly and Daily data will downloaded from the ocean color website (oceancolor.gsfc.nasa.gov). SeaWifs Data Analysis System (SeaDAS) software will used to extract and process the data. Monthly mean surface wind speed data will download from the NOAA Earth System Research laboratory website.
And monthly mean sea surface current data will downloaded from the NOAA ocean surface current Analysis (OSCAR) website The Data will be processed using the Grid Analysis and Display System (GraDAS). The statistical Multiple Regression Combined with the GIS Techniques Model will be needed for this Potential Fishing Zone Advisory. Raster map will be produced by using the ArcGIS software.
3.2 Data Collection Procedure
We have collected the images of Chlorophyll and Sea Surface Temperature from the NASA Ocean Color website. As we do not have our own Aqua MODIS Satellite so that we can use for this PFZs forecasting. But this is not an issue as we can use the image data without any cost and with subscription we can get the data according to your demand like every day or twice in a week.
So to collect the Data, first of all, needs to go to NASA’s Ocean Color website
(https://oceancolor.gsfc.nasa.gov/) and needs registration. Without creating account we cannot access anything from the website. There are so many buttons are available one is ‘DATA’ if we place the mouse cursor on the ‘DATA’ button we will see so many other options. From them needs to click on the ‘Level 1 & 2 Browser’ image. After that, we will redirect to another page where we see the CHL, SST, SST4 etc. options on the top left corner of the page.
However, there we need to select by clicking a few options like the months and the years, then the targeted region or we can select any particular single location or any specific boundary coordinates. And finally needs to click on the
‘Find Swaths’
So we selected the Bay of Bengal and the time and years and clicked on the ‘Find Swaths’.
We will redirect to another page where will see 10 images, also 10 pages of images which means about 100 images. We can select, choose particular images to download or can
‘ORDER DATA’ by clicking on the order data button. If we order the data then the NASA OCEAN Color will email us to our register email.
It was the process of getting onetime data. But for getting the future data we subscribed from the Subscription Dashboard option. The option is available on the website under the
‘SERVICES’ button to Subscription Dashboard. And then needs to click on the ‘Create New’
we will get another page with lots of more option with the blank fields where needs to input the value according to our requirements. Like Subscription Duration, Region, Location, Can Select Sensor according to our requirement also can select the region location from the small map with creating a small box on it.
Once we subscribed then we will get the email from the NASA Ocean Color websites for the selected region with other option. And then we can use that data set for detecting the Potential Fishing Zone. It is a continuous process. We need to analyze the images every time to provide the PFZs.
And for analyzing the Data we need to use the SeaDAS Software. This is also available on the NASA’s OCEAN Color website under the ‘SOFTWARE & TOOLS’ button. We downloaded and installed the software and then analyzed the images to create a model to show how it looks like when we process the images of chlorophyll and SST.
3.3 SeaDAS Software
SeaDAS Software is for the image processing, visualization, analyzing software. It is developed to help to the potential fishing zone advisory system. It has the feature of Advanced Layer Management, Mathematical and Statistics Operations. Plot Histograms, Correlation Plots Scatter Plots can be done on this software. The mapping, re-projection, Cropping, Bathymetry and Elevation is possible to do on this software. It is very high level of software designs for specifically analyses the images of Software.
3.4 Chlorophyll-a and Sea Surface Temperature
Chlorophyll is the form of phytoplankton and these are the food of the small pelagic, and these pelagic are the food of the fishes. Big fishes will go to eat these pelagic. And the upwelling area is a suitable area for this phytoplankton, zooplankton, and pelagic. The Chlorophyll and Sea Surface Temperature Concentration provide the area there the Phytoplankton is available and the Temperature is higher than another area like down willing area. The big fishes go to these regions where the temperature is high and foods are highly available. The advisory system will help the fisherman, the fishing community to detect the Potential Fishing Zone and they can catch the fish without wasting time and the amount of catching will be very high.
The Satellites images provide the information on where is the highest level of this Chlorophyll is available.
The satellite cannot detect the fish directly; Satellite can provide the Chlorophyll-a and the Sea Surface Temperature image data, and these image data indicates the Potential Fishing Zone on the Ocean.
The chlorophyll maps, images show us where the ocean surface plants are growing, Phytoplankton contain chlorophyll (Phytoplankton live in the surface waters of the Ocean.
Sea Surface temperature indicates the temperature of the Sea Surface. SST indicates where the high area of the ocean is; usually, the upwelling with high chlorophyll area is the high- temperature area. And the fishes are likely to go to that area. The Advisory system will analyze the Chlorophyll and SST data to indicate these regions to provide Potential Fishing Zone.
Monthly Level 3 data and daily Level 1 data of Moderate Resolution Imaging Spectroradiometer Satellite (MODIS) provides Chl-a and SST data. The highest and lowest concentrations need to describe, this indicates the availability of the phytoplankton. Sea surface temperature images indicate the temperature of the water.
CHAPTER 4 DATA ANALYSIS
4.1 The Targeted Area of Bay of Bengal
Figure 4.1: Maritime area of Bangladesh (Uddin et al. [18])
This is the marine fishing zones of Bangladesh, the Bay of Bengal our Study area. Bangladesh has the largest coastline area about 480 km in length with the Exclusive Economic Zone (EEZ) is about 125,000 Square km estimated. Fisheries et al. [19] It has mainly three coastal grounds the (1) South patches; which is lying between 20'50'N-21'40'N and 91'E-91'E and the area length is about 6,200 Square kilometer (2) Middle Ground; area location is 20'50'N-21'20'N and 90'E-91'E; and the area length is 4,600 square kilometer. (3) Swatch of no Ground and the area located between 21'N21'40'N and 89'E-90'E; and the area length is 3,800 square kilometer. The south paces are the most productive one
4.2 Chlorophyll-a Image Processing and Analysis
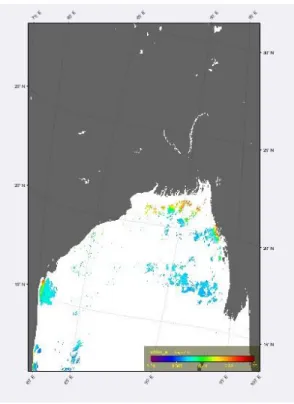
Figure 4.2: The Chlorophyll- a Concentration analyzed image on SeaDAS Software
Higher the Chlorophyll the better chance of fishing livelihood there. The Yellow to Redis zones is most Chlorophyll area zone. That is the most suitable zone of the fish. The location area of the image is the bay of Bengal Bangladeshi Exclusive Economic Zone. This image with the color bar showing that is the high chlorophyll is situated and where is the best chance to availability of fishes. The software SeaDAS also helps to provide the pixel value and exact location. So we can find out the area and can go to that location for the best fish catch. We have applied the Land Mask and cloud mask on this image. The black zone is the Land and the white zone is the cloud on the image.
Figure 4.3: The Chlorophyll-a Image with Pixel Info-One
This image is the zoomed image of the “The Chlorophyll-a Concentration analyzed image on SeaDAS Software”. This is the zoomed chlorophyll-a area and the Geo-location values and Raster info under the Pixel Info box. The Geo-Location rows have the Image-X and Y and also the Longitude and Latitude with a degree and the Pixel Info has the Chlor_a Longitude and Latitude showing the Raster rows on the box. And the little box on the Chlorophyll
zoomed image is the pinpoint location. We are seeing the data and information for that small little pixel box area now.
That small region or pixel box Geo Location’s Longitude is 89°57'39'' E and Latitude is 21°26'46'' N. And under the Raster row the Chlor_a value is 3.191322 mg m^-3, the Longitude is 89.96083 degrees east, the Latitude 21.446115 degrees north
Figure 4.4: The Chlorophyll-a Image with Pixel Info-Two
In this image, the small pixel box is on the Green to Yellow zone. The Geo Locations values are available and the value of Chlor_a is 1.1898552 mg m^-3. But the value of chlorophyll was
3.191322 mg m^-3 on the previous image as the pixel location was the Yellow to Red zone area.
Figure 4.5: The Chlorophyll-a Image with Pixel Info-Three
In this image, the small dot/pixel box is on the white area zone on the image. And the Geo Location’s Longitude and Latitude are available on this image. But the Chlor_a is NAN as there are not any chlorophyll is available.
So according to our image analysis, we see that the white area has not any Chlorophyll available, the Green to Yellow zone have the small amount of Chlorophyll-a available where the Red to Dark Red zone is the most available chlorophyll area zone.
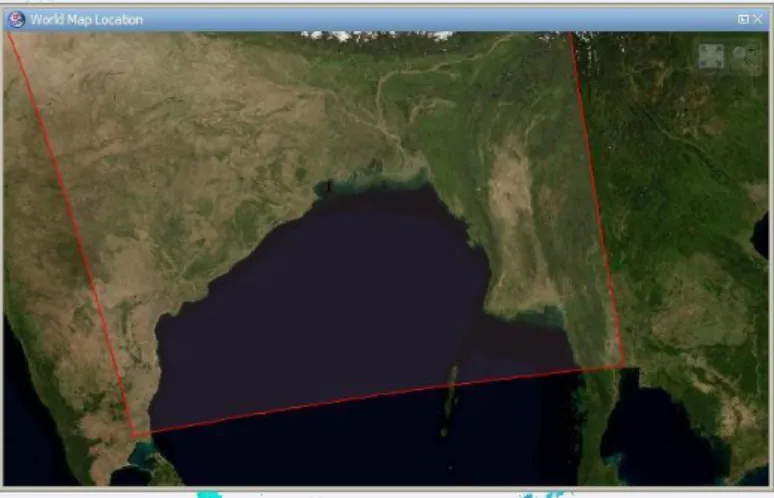
Figure 4.6: Chlorophyll locations on World Map
This is the General looks of Location on Map of the Chlorophyll analyzed data that is we analyzed on the SeaDAS software. This location is our targeted location and this is how it looks on the world
Map.
4.3 SST Image Processing and Analysis
Figure 4.7: The Sea Surface Temperature Analyzed image on the SeaDAS Software
The Yellow to reds zone area is the most suitable place for the pelagic and fishes to live on.
So in this image, we can find out that area location. So if we can find out the higher chlorophyll-a the area also the higher sea surface temperature area. And where both items are higher at the same time we can find out that too by the help of the pixel location from the software, so we can get the potential fishing zone area. But few more things are remaining to analyze too.
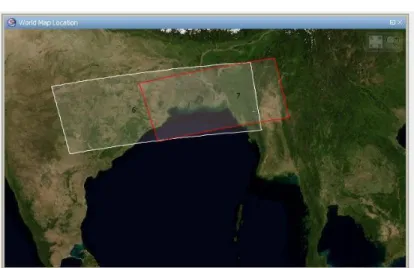
Figure 4.8: The area on Map of the Sea Surface Temperature area
This is the General looks of Location on Map of “The area on Map of the Sea Surface Temperature area”. This location is our targeted location and this is how it looks on the world Map.
4.4 Target Area Analysis and Discussion
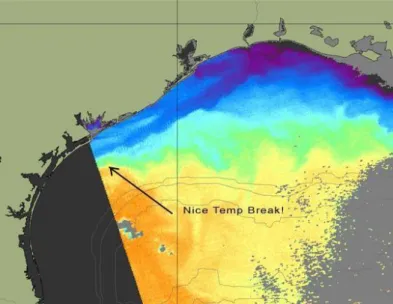
Figure 4.9: Sea Surface Temperature Maps (Source: RipCharts)
The pointed area of the image showing the best area with suitable Temperature for the pelagic to fish’s livelihood.
Figure 4.10: Chlorophyll Maps (Source: RipCharts)
This image is showing both the chlorophyll and Sea Surface Temperature. The pointed zone is the best-matched spot where the high chlorophyll and required Temperature.
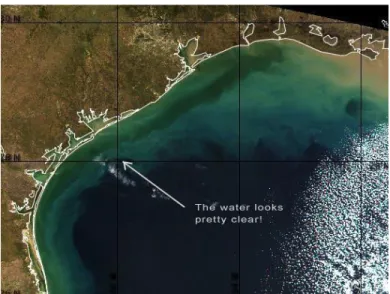
Figure 4.11: True Color Maps (Source: RipCharts)
Figure 4.12: Target Area (Source: RipCharts)
After review and analysis, the Chlorophyll-a and SST images need to analysis the Upwelling and the down willing area. This is a very important thing to know the potential fishing zone.
First of all what is the upwelling and down willing area. The upwelling area is where the water is moving from under the sea to the upper surface and the down willing area is where the water moving forward from the sea surface to the underside of the sea. Fishes are likely to live in the Upwelling area zone. The targeted area is that where the upwelling area zone, the Chlorophyll and SST values is matching the best.
Figure 4.13: Target Region (Source: RipCharts)
This is another clear image to show the pelagic and fishes livelihood area and our targeted Region. The warmest water will move to the under the see the down welling. And the cool water will move to the surface of the sea. But the in-between area where the Sea Surface Temperature is most suitable for the fishes that are their livelihood area and Target area. And the livelihood area of fishes and water temperature are continuously shifting changing so the target zone too.
4.5
The Process
Figure 4.14: The Process Flowchart
This is the process to follow to implement and have the best Potential Fishing Zone Advisory.
The Modeling and Technology Development and then the Operational Generation phase.
Needs to collect and analyze the images of Chlorophyll, SST and wind daily. Next step is to provide the information to the fishing community through the various broadcasting system like phone, messages, newspapers, fax, internet, email, display boards etc. After that, the fishing community will use the data and will go to that location. Then after coming back by using the PFZ, the Feedback needs to collect and needs to analyze, also should compare the catch between the Potential Fishing Zone Advisory and manually catch. Lastly needs to upgrade the image analysis the overall system according to the Feedback. This is how the system will grow and will be a continuous process
CHAPTER 5 IMPACT ON SOCIETY AND ENVIRONMENT
5.1 Impact on Society
As we know now that about 18 million peoples are involved in the fishing sector in our country. They live very low standard lives. The fishing sector is the second-largest export earning sector in Bangladesh. Though, the marine resources are still not utilizing properly fully untapped. In fact, the resources of the coastal area are not utilizing properly according to the resources we have on the sea. So, if the fisherman can use the potential fishing zone advisory system to forecast the fishing area and get a better fish. They will be directly benefited the country will be benefited and the people of our country will get their proper nutrition from fish. According to the discussion, it is clear that society will be only benefited from every aspect. When the fisherman has the better fishing catch their lifestyle will be changed. The rural area will be upgraded to urban area gradually. The lifestyle of the peoples who are engaging directly and indirectly with fishing will be changed and this changed will have an impact all over the country. The economy growth in one sector is beneficial for every person in a country. The Potential Fishing Zone Advisory system has not any drawbacks for society.
5.2 Impact on Environment
The potential fishing zone is fully environmentally friendly. Fishing community usually catches fishes manually with the PFZs the catch amount will be high. There are not any hardware uses and not any harmful activities are related to these PFZs for harmful on Environment. But the only the beneficial factors are related to every aspect.
CHAPTER 6 CONCLUSION AND FUTURE SCOPE
6.1 Conclusion
The Potential Fishing Zone is the new horizon for our country. Though it is true it needs time to implements the advisory system for all three gourds of Bay Bengal coastal area. But once it is developed the fishing sector will be changed dramatically.
6.2 Future Scope
We have three major fishing grounds of Bay of Bengal, which is the 1. South Patches2. Middle Ground 3. Swatch of no Ground. The primary step is needed to install the primitive LED boards forecasting on these grounds. Though first of all needs to analyze the Feedback from Fishing Communities that with the use of PFZs forecasting how much they became benefited.
Comparing to the data of use and not use of PFZs they are becoming benefited or not. The PFZs forecasting system will need to update. So, the feedback getting from fisherman and analyze the catching amount of data will be helpful to update the System and Image processing. Gradually the information will have to use on the mobile device, websites, radio, news media, and in the first phase. The PFZ’s has huge future scope if it is being used properly.
So it is the continuous process and continuously upgrading the system one after another.
Usually, AQUA MODIS satellite provides images only for oceans. But for a special funding project of Potential Fishing Zone the Satellite provides the images Lakes of USA. The benefits of this are that they can know the potential fishing zone for their lake too. Another hand INCOIS’s spatial project is the TUNA Fishing Advisories. The project is only for detecting the Tuna Fish. As the
Hilsha is our National Fish of our county. Also, Bangladesh is Reverian country with the blessed of few long rivers which have a large number of different fishes. So the point is in future if we can have got the access to have the images, data for the rivers of our country from the Satellites. Then we can be focused on the Hilsha Fish Forecasting on river specifically.
Because there are two types of Hilsha are available. One is Marine Hilsha and another one is called Hilsha Sad which is available on freshwater. The Hilsha migrate through the Marine to River and when they go to river according to rules of catching Hilsha fish a few particular times is appropriate to catch them except the band period. If it is possible to forecast the PFZ for Hilsha then it would be the best thing ever for our country.
References
[1] Shamsuzzaman, M. M., Islam, M. M., Tania, N. J., Al-Mamun, M. A., Barman, P. P., &
Xu, X. (2017). Fisheries resources of Bangladesh: Present status and future direction.
Aquaculture and Fisheries, 2(4), 145-156.
[2] Santos, A. Miguel P. "Fisheries oceanography using satellite and airborne remote sensing methods: a review." Fisheries Research 49.1 (2000): 1-20.
[3] Solanki, H. U., Mankodi, P. C., Nayak, S. R., & Somvanshi, V. S. (2005). Evaluation of remotesensing-based potential fishing zones (PFZs) forecast methodology. Continental shelf research, 25(18), 2163-2173.
[4] Choudhury, S. B., Jena, B., Rao, M. V., Rao, K. H., Somvanshi, V. S., Gulati, D. K., &
Sahu, S.
K. (2007). Validation of integrated potential fishing zone (IPFZ) forecast using satellite based chlorophyll and sea surface temperature along the east coast of India. International Journal of Remote Sensing, 28(12), 2683-2693.
[5] Tummala, S. K., Masuluri, N. K., & Nayak, S. (2008, December). Benefits derived by the fisherman using Potential Fishing Zone (PFZ) advisories. In Remote Sensing of Inland, Coastal, and Oceanic Waters (Vol. 7150, p. 71500N). International Society for Optics and Photonics.
[6] Khalil, I., Mannaerts, C., & Ambarwulan, W. (2009). Distribution of chlorophyll-a and sea surface temperature (SST) using modis data in east Kalimantan waters, Indonesia. J.
Sustain. Sci. Manag, 4, 113-124.
[7] Saitoh, S. I., Mugo, R., Radiarta, I. N., Asaga, S., Takahashi, F., Hirawake, T., ... &
Shima, S. (2011). Some operational uses of satellite remote sensing and marine GIS for sustainable fisheries and aquaculture. ICES Journal of Marine Science, 68(4), 687-695.
[8] Maity, S., Kumar, T. S., Dutta, S., Akhand, A., & Hazra, S. (2015, June). Satellite based integrated potential fishing zone advisories: a feasibility analysis in the coastal water of West Bengal. In Proceedings of the Zoological Society (Vol. 68, No. 1, pp. 14-19).
Springer India.
[9] dan Teknik, M. S. P. J., NURDIN, S., MUSTAPHA, M. A., LIHAN, T., & ABD GHAFFAR, M. A. Z. L. A. N. (2015). Determination of potential fishing grounds of Rastrelliger kanagurta using satellite remote sensing and GIS technique. Sains Malaysiana, 44(2), 225-232.
[10] Geronimo, R. C., Franklin, E. C., Brainard, R. E., Elvidge, C. D., Santos, M. D., Venegas, R., & Mora, C. (2018). Mapping fishing activities and suitable fishing grounds using nighttime satellite images and maximum entropy modelling. Remote Sensing, 10(10), 1604.
[11] Maulina, I. D., Triarso, I., & Prihantoko, K. E. (2019). DAERAH POTENSI PENANGKAPAN
IKAN TEMBANG (Sardinella fimbriata) DI LAUT JAWA BERDASARKAN SATELIT AQUA
MODIS (Potential Fishing Ground of Fringe Scale Sardine (Sardinella fimbriata) in the Java Sea based on Aqua Modis Satellite). Saintek Perikanan: Indonesian Journal of Fisheries Science and Technology, 15(1), 32-40.
[12] Prabiantissa, C. N., Basuki, A., & Sesulihatien, W. T. (2019). Observation of Fish Dissemination Pattern on Madura Coastal Using Segmentation of Satellite Images.
EMITTER International Journal of Engineering Technology, 7(1), 343-365.
[13] Giri, S., Manna, S., Chanda, A., Chowdhury, A., Mukhopadhyay, A., Chakraborty, S.,
& Hazra,
S. (2016). Implementing a Spatial Model to Derive Potential Fishing Zones in the Northern Bay of Bengal Lying Adjacent to West Bengal Coast, India. Journal of the Indian Society of Remote Sensing
[14] INCOIS “Potential Fishing Zone (PFZ) Advisory” 2008 https://incois.gov.in/MarineFisheries/PfzAdvisory [15] “FishTrack”(http://www.fishtrack.com)
[16] “RipCharts” (https://www.ripcharts.com)
[17] “About Department of Fisheries” http://fisheries.gov.bd/site/page/43ce3767-3981-4248- 99bdd321b6e3a7e5/-
[18] Uddin, M. S., Karim, E., Hasan, S. J., Barua, S., & Humayun, N. M. (2012). Catch composition for main marine shrimp species in Bangladesh. Bd Res Pub J, 7(2), 91-98.
[19] “Fisheries” 5-March-2015, http://en.banglapediitl
![Figure 4.1: Maritime area of Bangladesh (Uddin et al. [18])](https://thumb-ap.123doks.com/thumbv2/filepdfnet/11089367.0/25.918.303.594.531.965/figure-maritime-area-bangladesh-uddin-et-al-18.webp)