BOGO
INDONESIA
THESIS
ATUHAIRE RODGERS
GRADUATE SCHOOL
BOGOR AGRICULTURAL UNIVERSITY
2008
work with the research topic entitled,
“ECONOMIC ANALYSIS OF SMALLHOLDER RUBBER AGROFORESTRY SYSTEM EFFICIENCY IN JAMBI”
Therefore I confirm that;
1. This thesis was done wholly while in candidature for Master of Science degree in Agricultural Economics at this University;
2. Where I have quoted from the work of others, the source was given. With the exception of such quotations, this thesis is entirely my own work;
3. I have acknowledged all main sources of help;
4. This work was done under the guidance of Prof. Dr.Ir. Bonar M.Sinaga, MA and Drs. Suseno Budidarsono, M.Sc (Bogor Agricultural University and World Agroforestry Center). Supervisor’s contribution to this research and thesis was consistent with normal supervisory practice
5. Wherever contributions of others are involved, every effort was made to indicate this clearly, with due reference to the literature.
6. None of this work has been published before submission.
Bogor, September, 16th, 2008
ATUHAIRE RODGERS
Atuhaire Rodgers, 2008. ECONOMIC ANALYSIS OF SMALLHOLDER RUBBER AGROFORESTRY SYSTEM EFFICIENCY IN JAMBI (Bonar M. Sinaga as the Chairman, and Suseno Budidarsono as the Member of the Advisory Committee).
The objectives of this research were; (1) to analyze production efficiency and profitability of smallholder rubber monoculture and smallholder rubber agroforestry systems, and (2) to find out the effects of policy distortions towards rubber
production under smallholder monoculture and smallholder agroforestry.
Smallholders are not only judged by yield per hectare; economic efficiency is not only a matter of returns to land and returns to labor but smallholders can adopt low input strategy, continue making profits at prices that would be economically viable. Such flexibility offers the possibility of efficient resource allocation in response to diversification of economic opportunities.
The Policy Analysis Matrix (PAM) with the Domestic Resource Cost (DRC) results under the baseline scenario indicated that the use of domestic resources in production of rubber was efficient and socially profitable under the two systems but more desirable under monoculture system given the current prices for physical inputs, outputs, technologies and policy transfer. However, even with sensitivity analysis of 10% increase in the price of rubber holding other factors constant does not make rubber agroforestry system more efficient than its counterpart and a 20% fall in price of rubber made rubber production under agroforestry system less efficient and undesirable. All measures are compared to the alternative policy indicators currently used. Therefore, recommendations made from this study relate to the need for diversification into better practices that can sustain efficient rubber production under the agroforestry system, encouraging private sector participation and reducing disincentives to rubber production.
Based on the entire objectives of this research, the Policy Analysis Matrix (PAM), as an attractive organizational policy framework was used to analyze production efficiency and profitability using farm budget analysis comparing multi-year land use system budgets (smallholder rubber monoculture and smallholder rubber agroforestry systems) calculated at private and social prices and NPV valued at private prices as an indicator for production incentive and then Social prices that remove the impact of policy distortion (taxes, subsidy and other local levies). PAM indicators especially Domestic Resource Cost ratio (DRC) and Private Cost Ratio (PCR) were used as well. In other words, with DRC < 1 indicating that the use of domestic factors was socially profitable. PCR < 1 indicating that there was value added to the use of the domestic resources. All of these components were combined to provide a measure of total profitability, economic efficiency and effect of policy distortions from the existing divergences. Therefore, all results were consistent with the existing policies.
The study reveals that most of the labor costs were spent under rubber garden maintenance and its related activities mostly done by hired laborer. Under smallholder rubber monoculture system the total expenditures spent on rubber garden maintenance was Rp 4 344 million (23% out of the total cost) while, under smallholder rubber agroforestry system farmers spent Rp 2 630 million (31% out of total cost).
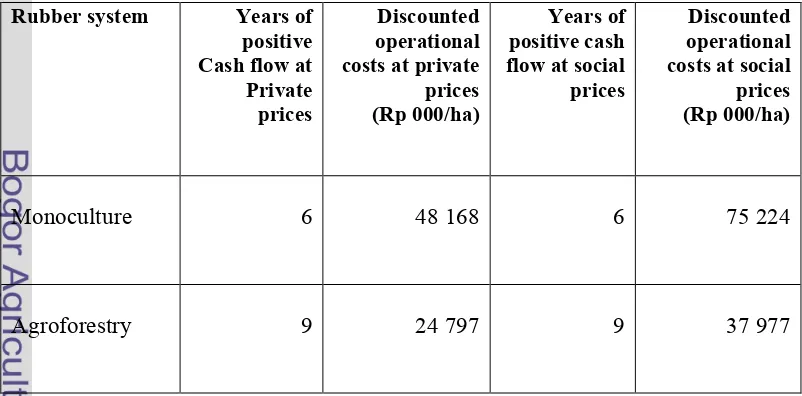
The discounted operational costs for both systems were financially ranging from Rp 24 797 million under agroforestry to Rp 48 168 million under monoculture, and economically ranging from Rp 37 977 million under smallholder rubber agroforestry system and 75 224 under smallholder rubber monoculture system. Based on farm budget calculation, the study also revealed that monoculture system in managing the plantation during rubber establishment has higher returns, employs more labor and also more profitable than smallholder rubber agroforestry traditional systems.
The analysis further reveals that with baseline scenario monoculture has a comparative advantage in the production of rubber than its counterpart, as indicated by DRC’s of 0.31 and 0.37 respectively. However, even with a 10% increase in the price of rubber holding other factors equal, agroforestry system remained less efficient than monoculture system i.e. with the DRC values of 0.35 and 0.28 respectively. This indicates that smallholder monoculture system has efficient use of resources especially when farmers get an increase in price of rubber with the prevailing rubber prices.
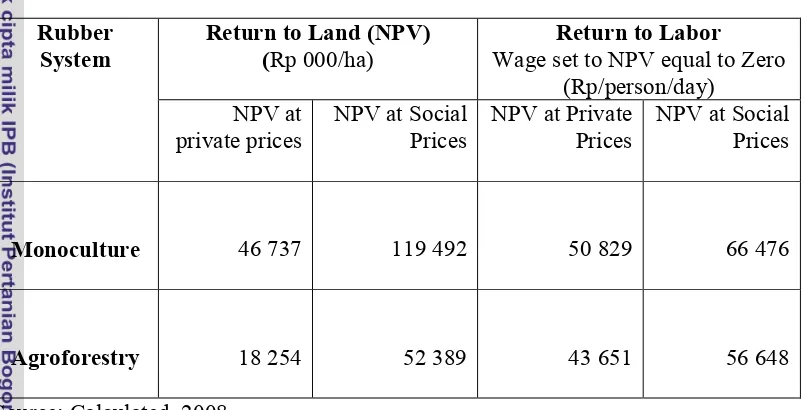
Social profits, which are an efficiency measure, are all positive under both systems, and indicate that scarce resources were well utilized by producing at social costs that did not exceed the importation costs. Monoculture system had a bigger NPV as compared to Agroforestry system and therefore, monoculture was found to be more efficient under the existing technologies and efficient policies.
Factor transfers show negative values, which imply positive incentives for smallholder rubber farmers under both systems. This can be attributed to the primary factors of production. Therefore factor transfers may include some effect of the policies and market imperfections that influence the profitability of alternative crops. With regard to output transfers, all values were found to be negative, which is a reflection of disincentives to farmers.
It was noted that not all policies distort the allocation of resources; some policies however, endorse to improve efficiency by correcting failure of the product. A negative transfer in the total revenue indicated that the smallholders were receiving less than the border parity price for the commodity. A negative transfer in the domestic factors represents a positive transfer to the producers.
The value of tradable input transfer was negative for both smallholder rubber monoculture and smallholder rubber agroforestry and the NPCI of these systems were less than one this indicated that producers in both systems were not taxed when tradable inputs were bought.
Price distortions reduce production of rubber under smallholder rubber agroforestry system. A 20% decrease in parity price of rubber made the crop undesirable from the social point of view. The opposite is also true (i.e. with a depreciating RER, profits realized in excess of normal returns to domestic resources will decrease). When the price of rubber falls, smallholders under rubber agroforestry system reallocate factors of production (i.e. capital and labor) in order to meet their daily expenses and resume tapping when there is an increase in rubber prices again. Whereas; Smallholders under monoculture system maintain their tapping schedule and maintenance schedule
While more intensive rubber monoculture offers better productivity (yield and profitability), it also requires much higher capital and input that is beyond reach for smallholders under rubber agroforestry especially during the immature period.
1. No part or this entire thesis may be excerpted without inclusion or mentioning the source:
a. Excerption only for research and education use, writing for scientific papers, reporting, critical writing or reviewing of a problem.
b. Excerption does not inflict a financial loss in the proper interest of Bogor Agricultural University.
INDONESIA
ATUHAIRE RODGERS
Thesis
Submitted for the partial fulfillment of
Master of Science
degree in
Agricultural Economics
GRADUATE SCHOOL
Name : Atuhaire Rodgers
Registration Number : H353078211
Study Program : Agricultural Economics
Approved by,
Advisory Committee
Prof.Dr.Ir. Bonar .M.Sinaga, MA Drs. Suseno Budidarsono, M.Sc
(Chairman) (Member)
Endorsed by,
Programme Coordinator Dean of Graduate School
Agricultural Economics
Prof.Dr.Ir. Bonar M. Sinaga, MA Prof. Dr.Ir.Khairil A. Notodiputro, MS
There are several people without whom this thesis would not have been at all possible
and whom I need to thank:
I am indebted to government of Indonesia for awarding me a scholarship to
pursue Master of Science degree in Agricultural Economics under Bogor Agricultural
University, World Agroforestry and Jessica Roy Memorial Research Scholarship that
enabled me carry out this study for my thesis production. Without them, my further
prospects for this research would not have been all that possible.
Prof. Dr. Ir. Bonar M. Sinaga, MA and Drs. Suseno Budidarsono, M.Sc. as
my supervisors they have been remarkably patient, cooperative and constructive in all
phases of the thesis work. Their encouragement and stimulating guidance has allowed
us to integrate our separate ideas into a coherent thesis. They have given me a high
degree of freedom in the exploration of my research, while keeping me cognizant of
my research direction and more importantly; its completion, many things I have
learned and gained from it.
Mrs. Hellen Ochieng moderated the production of this thesis between two
institutions until its final stage between i.e. World Agroforestry Centre and Bogor
Agricultural University. Her efforts are highly appreciated for they made us finish
within the expected time frame of the research fellowship.
Dr. Nunung Kusunadi, my external examiner and the chairman of
Agribusiness department, Bogor Agricultural University who provided me with good
contributions ranged from counseling and moral support.
My friends; Ronnie Babigumira, Joseph Obado, Arif Rahmanulloh, Mamihery
Ravoniarijaona and Marty Hasu Linda provided me with insightful and challenging
comments at various stages of my thesis production.
I would like to express my sincere gratitude to my mum Mrs. Perry karamuzi
for her encouragement, “behind a strong lady there is a strong man”. And to my late
dad Mr. Paddy Karamuzi who had been waiting for too long for my study. His
sincere love and care are impossible to repay. My brothers; Atwinematsiko Andrew
and Atuhaise Benjamin, Sisters; Ayebazibwe Calvin and Akankwatsa Catherine who
stood by my side until this day.
Finally, to all those that managed to provide me with valuable comments and
inputs during various consultations.
Bogor, September 16th, 2008
Bushenyi District in the western part of Uganda. He is the first born out of five
children of Mrs. Perry Karamuzi and late Paddy Karamuzi.
He completed his primary school in 1993 at Kyeitembe primary school,
Bushenyi. In 1997, he completed Uganda Certificate of Education at Muntuyera High
School, Ntungamo district. In 1999 he finished Uganda Advanced Certificate of
Education at Valley College, Bushenyi District. In 2000 he won His Excellency
Martin Brennan and family scholarship to pursue undergraduate’s degree in
Environmental Management at Makerere University finished his studies in 2003. In
2004 he won another scholarship from Capacity Building International (INWENT) to
pursue an advanced training course in wind energy applications at Kassel University
of Technology in Germany. He was also an intern at the World Wind Energy
Association headquarters where he wrote a book entitled, “Africa’s Renewable
Energy Sustainability Guidelines”. In 2005 he was appointed as the Country
Representative of Africa Wind Energy Association – Uganda.
In 2006 he won a scholarship to pursue Masters Degree in Agricultural
Economics at Bogor Agricultural University, in the same year he worked as an intern
at the Center for International Forestry Research (CIFOR) focusing on biofuels and
environment. He was also selected to take part in His Excellency Horst Koehler’s
In 2007, he was invited for a roundtable discussion under the Civil Society
and the Joint EU–AU Strategy to discuss how EU can handle Africa’s problems
(http://europafrica.files.wordpress.com/2007/04/tn_liste200407fin.pdf). In the same
year he was among the winners of World Agroforestry and Roy Joy Memorial Master
Thesis Research Fellowship.
In 2008, he was crowned as the Best Presenter in Bogor Agricultural
University International Students Conference and now expects to graduate in October
LIST OF TABLES...
2.2.1. Agricultural Price Policy Instruments………...
2.2.2. Macroeconomic Policies Affecting Agriculture………...
Smallholder Export Crop Production...
Review on Measuring of Efficiency...
2.4.1. Smallholders Production Efficiency...
2.4.2. Adopted Model on Measuring Efficiency...
Measuring Policy Distortions...
2.5.1. Distortions in Agricultural Markets...
2.5.2. Adopted Model...
III. RESEARCH METHODOLOGY... 36
Selection Criteria for Area of Study...
3.3.1. Selection Procedures...
3.3.2. Survey Locations...
Sources of Data...
Secondary Data Update...
The Policy Analysis Matrix (PAM)...
3.6.1.The Farm Budget Analysis Approach...
3.6.1.1. Estimation of Private Costs and Revenues...
3.6.1.2. Estimation of Social Costs and Revenues...
3.6.1.3. Pricing the Costs and Returns...
3.6.2. The PAM Table Approach of Assessment...
3.6.2.1. Private Profitability...
3.6.2.2. Social Profitability...
3.6.2.3. Important Policy Parameters from the PAM...
3.6.3. Data needed for Analysis...
3.6.4. Sensitivity Analysis...
3.6.5. Strength and Weakness of PAM...
IV. THE CASE STUDY AREA... 57
4.1. The Study Sites...
4.1.1. Physical Characteristics...
4.2.2. Size of the Household... 63
V. ECONOMIC PERFORMANCE OF SMALLHOLDERS... 65
5.1. Farm Budget Analysis and Profitability...
5.1.1. Cost of Rubber Establishment...
5.1.2. Returns to Land and Returns to Labor Assessment... 65
Efficiency and Profitability with PAM Table Analysis...
5.2.1. Profitability...
5.2.2. Domestic Resource Cost ...
Effects of Divergences or Policy Transfers...
Effects of Fertilizer Subsidy...
VI. IMPACT OF POLICY DISTORTIONS ON RUBBER
PRODUCTION... 79
6.1.
6.2.
6.3.
Effects of an Increase in Producer Prices...
Effects of an Increase in Interest Rate...
Effects of Policy Distortions... 80
82
83
VII. CONCLUSIONS, POLICY IMPLICATIONS AND AREAS FOR
i
Number Page
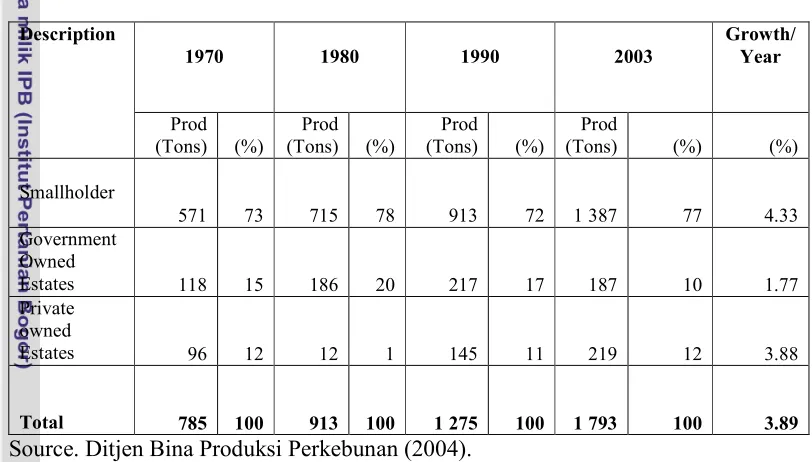
1. Rubber Area and Growth in Indonesia from 1970 to 2003... 2
2. Natural Rubber Production and Growth in Indonesia from 1970 to 2003... 3
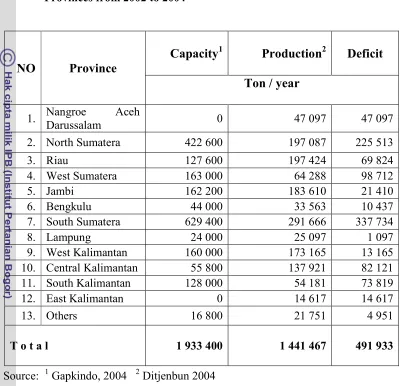
3. Capacity and Production of Crumb Rubber Factories Based on Provinces from 2002 to 2004... 19
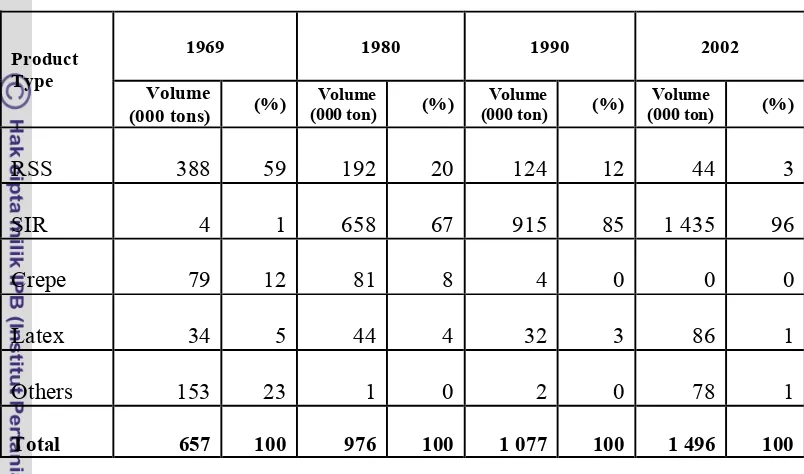
4. Export Volume of Indonesian Natural Rubber Based Product from 1969 to 2002... 21
5. Volume, Value and Average Price of Indonesian Exported Natural Rubber in Indonesia from 1969 to 2002... 22
6. Indonesian Rubber Export Based on Destination from 1996 to 2001... 23
7. 2007 Macroeconomic Parameters Used in Data Update... 46
8. The Policy Analysis Matrix... 48
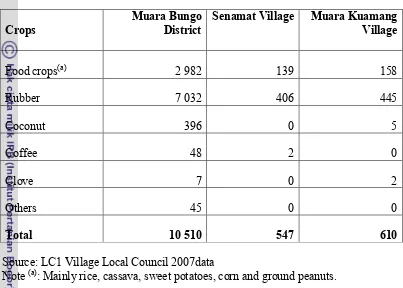
9. Planted Crop area by Important Crops and Administrative Locations in Hectares... 61
10. Land Area, Percentage to the Total Area, Population and Population Density 2005 Covered per District... 62
11. Number of Households by Occupation and Administrative Locations in 2005... 64
12. Cost Composition of Rubber Establishment in Private Prices... 66
13. Years of Positive Cash Flow and Operational Costs... 67
14. 30 Years Profitability Matrix for Smallholder Monoculture and Smallholder Agroforestry Systems... 70
ii
iii
Number Page
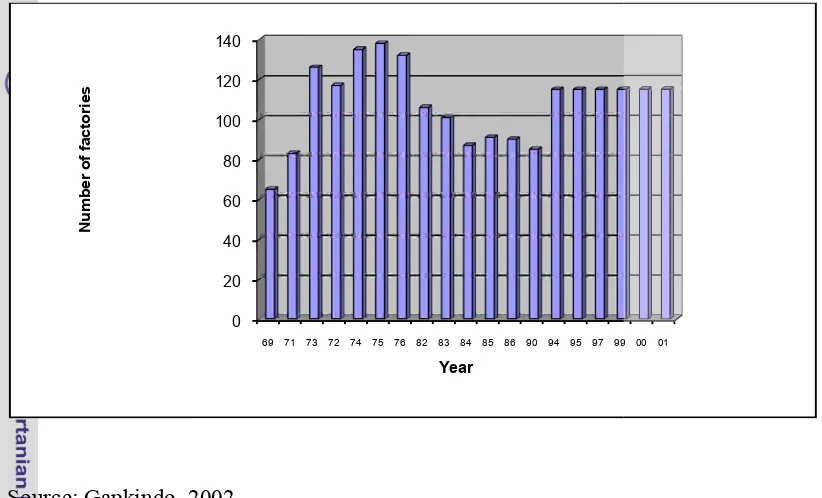
1. Number of Actively Producing Crumb Rubber Factories from 1969 to 2001... 18
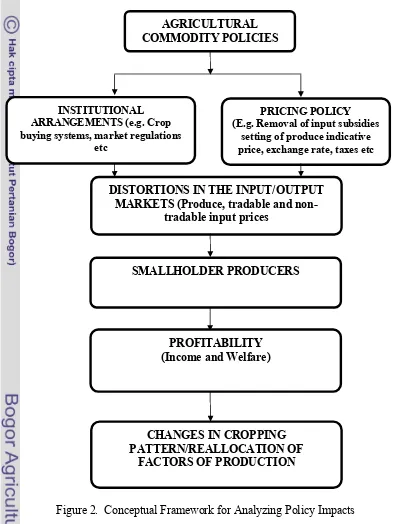
2. Conceptual Framework for Analyzing Policy Impacts... 37
iv
Number Page
v
Number Page
1. Private and Social Price Table for Smallholder Rubber Monoculture
System... 96
2. Private and Social Price Table for Smallholder Rubber Agroforestry
System... 97
3. Input-Output Table for Smallholder Rubber Monoculture
System... 98
4. Input-Output Table for Smallholder Rubber Agroforestry
System... 102
5. Private Budget Table for Smallholder Rubber Monoculture
System... 107
6. Private Budget Table for Smallholder Rubber Agroforestry
System... 112
7. Social Budget Table for Smallholder Rubber Monoculture
System... 117
8. Social Budget Table for Smallholder Rubber Agroforestry
System... 122
9. Cash Flow for Smallholder Rubber Monoculture
System... 127
10. Cash Flow for Smallholder Rubber Agroforestry
System... 130
11. Extended PAM Table for Smallholder Rubber Monoculture
System... 133
12. Extended PAM Table for Smallholder Rubber Agroforestry
System... 134
13. Labor Requirement for Smallholder Rubber Monoculture
vi
15. Labor Allocation for Smallholder Rubber Monoculture
System... 145
16. Labor Allocation by Stages for Smallholder Rubber Agroforestry
System... 146
17. Import Parity Price Calculation of Rice at Farm Gate... 147
18. Import Parity Price of Fertiliser... 150
19. Export Parity Price of Rubber at Farm Gate... 152
20. Domestic Timber Price of Merati... 154
21. Domestic Timber Price of Rubber Wood... 155
22. Paddy & Rice Price in Jambi... 156
23. Fertilizer Retail Price in Jambi... 157
24. Chemical Retail Prices in Jambi... 158
25. Domestic Price of Dry Rubber Content... 159
26. Real Interest Rate in 2007... 160
27. Wage Rate in Jambi... 161
1.1. Background
The uniqueness of agroforestry system has been documented in many reports.
Torquebiau (1984), Mary and Michon (1987) and Michon (1993) reveal that
agroforestry is like a forest like land use system invented by local people over
generations living at the margin of rainforest.
Natural rubber is an important export commodity for Indonesia with
approximately 1.3 million farm households relying on rubber cultivation that
accounts for 75% of national production (Director General of Estates, 2002). The
predominant traditional rubber agroforestry system, has two characteristics of
interest: firstly the crop is owned by smallholder farmers (with 2-5 ha plots on
average) and secondly it is a result of local farmers adapting rubber as a cash crop
into their crop fallow system rotation from the early 20th century (Van Noordwijk et
al, 1995; Penot and Sunario, 1997; Joshi et al, 2002). In this system, a range of
products additional to rubber can be harvested for self consumption or sale. The
system provides regular income for farmers, mostly from the rubber, plus the
temporary benefits of food and cash crops in the initial years and fruit, timber and other
products in later years.
The yields of rubber-based agroforestry system can be classified into three
product groups namely: (1) latex (2) rubber wood and (3) yields of the intercrops.
Smallholder natural rubber area in Indonesia covers 3 million ha (hectares) out
2003). The total area growth of rubber in Indonesia was 1.27 from 1970 to 2003
(Direktorat Jenderal Bina Produksi Perkebunan (2004).
Table 1. Rubber Area and Growth in Indonesia from 1970 to 2003
Description
Source. Ditjen Bina Produksi Perkebunan (2004)
Smallholder’s rubber area had the highest growth of 1.64%, while the
government owned and private owned estates area decreased to -0.04 and -0.10%
growthrespectively(Table 1). The highest production growth on smallholder’s rubber
was 4.33% annually while the government owned and private estates were 1.77% and
3.88% growth annually as illustrated in Table 2.
From the natural conservation point of view, Muara Kuamang agroforestry
affords environmental benefit. The forest like structure of agroforestry allows the
conservation of large part of natural forest biodiversity (de Foresta and Michon,
1994). The mature agroforestry is made up of an intimate mixture of various tree
strata and occupy high value products such as fruits and high grade timber. As far as
wild animals are concerned, agroforests harbor too many wild species and most of
them are protected by the Indonesian law. These animals include; monkeys, gibbons,
siamang etc.
Table 2. Natural Rubber Production and Growth in Indonesia from 1970 to 2003
Estates 118 15 186 20 217 17 187 10 1.77
Private owned
Estates 96 12 12 1 145 11 219 12 3.88
Total 785 100 913 100 1 275 100 1 793 100 3.89
Source. Ditjen Bina Produksi Perkebunan (2004).
From the economic perspective, agroforestry land use system provides a wide
range source of income to farmers, their neighborhood and actors along the trading
chain (Levang, 1989; Dupain 1994; Bouamrane, 1996). Trees with about 65% of the
tree community provide regular cash income from the harvesting and total sales. Fruit
trees comprise almost a quarter of the tree community although not on a monthly
basis, also provide additional cash income.
The interesting part of the story lies in the way farmers initiate and develop
dry land paddy) are planted alongside rubber and fruit trees such as durian, duku,
rambutan and other trees which have economic value for additional household
income. Wherever possible, smallholder farmers plant any kind of vegetable for their
own need.
Crop mixture has economic importance as it makes the basis of succession of
harvestable commercial products before positive cash flow (i.e. 9th year for
agroforestry system). Food crops (dry land paddy and vegetables) are the first yields
that are harvested mainly used for daily consumption before other commercial crops
are harvested. Farmers have additional annual income from harvesting these fruit
trees.
It is clear that rubber establishment creates sources of income for the
operators as well as its neighborhood in harvesting the yields alongside before
positive cash flow. It is also clear that there are conservation measures involved in the
agroforestry system that provide income related incentives to farmers.
However, one of the major issues amongst smallholders under rubber
agroforestry is how efficient and profitable their system is as compared to
smallholder monoculture rubber production considering whether it is financially
viable or not. Some of the evidences on this issue were considered, by analyzing the
production structure and the arguments made for smallholders production efficiency
and profitability. The expected outputs of the efficient production system are good
price, improved product quality and enhancement of a better welfare of farmers and
1.2. Statement of the Problem
Over years, developing countries have experienced a wide variety of
agricultural policy regimes (Westlake, M. J. 1987). Promotion of one objective
conflict with one or both; to a considerable extent, government policies often favor
particular parties at the expense of the others in the use of agricultural resources, in
addition to factor market imperfections. In this situation, policy makers need to
trade-off the gains in one objective against the losses in the substantial use of land for
smallholder rubber cultivation which might be not tolerated if the action could not
bring about significant improvement. This makes it necessary to measure the effect of
policies on the smallholder’s rubber agroforestry system while comparing it with the
smallholder monoculture system.
Agricultural policies are influenced by government interventions mostly
through price and trade policies. Looking at agriculture sector it cannot be treated in
isolation, as it is substantially influenced by macro-economic factors. Some of the
problems facing the sector could be attributed to market distortions. A distortion, in
this case, is a degree of divergence between a situation with a particular intervention
and a situation without the intervention.
Despite the current increase in price of rubber, previously Indonesian
government was encouraging the replanting of rubber areas with oil palm in Jambi
and other areas in Indonesia because of low price of rubber that existed at the world
market (Peyman, 2003). Effectively it would take 10 to 15 years of consistent
predicted that rubber could see a decade of higher prices, which is estimated at least
double of the present market price. Price fluctuations affect production of rubber
under agroforestry system than monoculture system looking at the production base of
this study in Jambi. Farmers are facing problems like low yields caused by lack of
technology know how, lack of capital, lack of certified planting material, poor
selection of clones, low productive SPH (stand per hectare), high tapping interference
and lack of uniform productive stand amongst smallholders which have led to low
rubber productivity and reduction in smallholders income and product profitability.
However, multipurpose uses are considered to attain highest productivity and land
uses could be available for successions of more productive crop. It is very essential to
establish other shade loving crops or creepers viz. Durian, Pertai, Duku and cassava,
etc., in rubber plantation for economic and ecological benefit. Due to the existing
problems scanned under rubber agroforestry system, it was compared with rubber
monoculture system for better results.
In some recent literature, knowledge on quantitative effects of policy
distortions on smallholder rubber agroforestry production in Jambi is still insufficient.
Given this background, it is the objective of the study to analyze the direction and
extent of distortions that will empirically fill the literature gap.
1. Is the production of rubber more efficient and profitable under smallholder rubber
monoculture or smallholder rubber agroforestry system?
2. Do policy distortions affect rubber production efficiency under smallholder
1.3. Objectives of the Study
1. To analyze production efficiency and profitability of smallholder rubber
monoculture and smallholder rubber agroforestry systems in Jambi.
2. To find out the impacts of policy distortions towards rubber production
efficiency under smallholder rubber monoculture and smallholder rubber
agroforestry systems in Jambi.
1.4. Scope
This study attempted to analyze the production efficiency and the policy
distortions affecting smallholders under rubber agroforestry while comparing them
with smallholders under rubber monoculture in Muara Bungo - Jambi.
Production efficiency had to be obscured and to reveal the system’s
commodities production practices, evaluation of potential gains in economic
efficiency terms, policy distortions, and private profitability compared with potential
social profitability. Policy analysis matrix (PAM) framework was used to analyze the
impact of government's agricultural policies and other factors that might have
affected the systems performance. Since PAM is a static model, a sensitivity analysis
was used to explore the effect of potential changes in various factors that influence
profitability and efficiency of smallholders.
Although systems efficiency can be measured in terms of biological,
environmental and ecological perspectives etc, this thesis did not look at any of them.
2.1. Smallholder Rubber
Rubber cultivation fits farmer’s basis resource satiation reasonably since it
only requires minimal cash expenditure for relatively inexpensive items as seeds and
hand tools (Barlow, 1990). Furthermore, commercial rubber production on a small
scale was cleverly adapted to the indigenous institution of traditional land systems,
under which chief output of land could be acquired almost without cost. In due
course, farmers are able to exploit the growing demand for rubber to an extent
permitted by their basic resources and market links. This attracted many other small
farmers who are convinced by significance of continuous cash income from rubber in
supplementing their subsistence.
Introduction of rubber to the local people opened up opportunities for utilizing
land more economically instead of leaving the land fallow after one or two years of
food crop farming small farmers intercropped with rubber. After 8 to 10 years, with
negligible labor input for up keeping young trees, the land became valuable rubber
garden and generated continuous income as supplement to their subsistence. Profits
secured from rubber during the price boom encouraged many farmers to shift to
rubber cultivation as source of livelihood. But to varying degrees, they continued to
produce subsistence crops, which later proved valuable when rubber markets were so
depressed. According to Knorr (1945), in the 1920’s Indonesia smallholders were less
dependent on rubber than their Malaysia counterparts. Their diversified farming
depression. Judging from the continuously increasing planted area of smallholder
rubber, it may be inferred that the relative importance of rubber in smallholders must
be increased too.
Rubber is one of the Indonesia’s major resources: a major source of household
income for over eight million people, and among the country’s list, it’s the largest
agricultural generator of foreign exchange (Barlow, 1990). This makes Indonesia to
be among the world’s largest rubber producers. Rubber that is produced on large
plantations or estates employs modern agricultural technologies, heavy capital
investments, and a wage labor force. But the bulk of Indonesia’s rubber, 75% at the
most count in 1990 by Colin Barlow, produced in tiny gardens of hectare by
smallholder agroforesters Barlow and Muharminto (1982) who produce rubber with
household labor to meet certain part typically not the major part of their household’s
income requirements. Rubber is ideally suited to this purpose, in the words of Barlow
(1990), it offers “flexible management… limited reliance on skill… easy disposal of
output … and a good cash potential”.
Colin Barlow in 1996 classified the period of rubber growth in three phases; (1)
Subsistent economic phase indicated by traditional farming i.e. selling and buying
process, shifting cultivation and little involvement of the government; (2) early
transformation of farming indicated by the dominancy of commercialized agriculture
in rubber marketing including international marketing, the beginning of the
implementation of rubber cultivation technology, and (3) the development of
agriculture in which the agricultural sector was dominant but both industrial and
increased, transportation costs decreased, innovation of planting materials improved
and government roles started to increase as well. In the current state, Indonesian
rubber sector is in the third phase.
2.1.1. Rubber Agroforestry System
Agroforestry is a new name for a very old farming system and to get a picture
of its concept, ICRAF (World Agroforestry Centre) defines agroforestry as a
collective name for land use systems and practices in which woody perennials are
deliberately integrated with crops and or animals on the same land management unit.
The integration can be either in a spatial mixture or in a temporal sequence with both
ecological and economic interactions between woody and non-woody components.
In 1994, the World Agroforestry Centre (ICRAF), in collaboration with
CIRAD-France and the Indonesian Rubber Research Institute, established a network
of improved Rubber Agroforestry Systems (RAS) on-farm demonstration plots in
Jambi, West Sumatra and West Kalimantan. These RAS (Box 1) are less intensive
than intensive monoculture systems but more appropriate for smallholder farmers.
In Jambi agroforestry is very important for the farmers and ranges from 20 to
60% of the cultivated land (Kabai and Dässman, 1997). Looking at rubber
agroforestry, it is particularly interesting for two reasons. Firstly, it is relatively
profitable and secondly, it is entirely smallholder-oriented. One of the best ideas with
rubber agroforestry is that the smallholders are able to generate income from different
farmers to plant trees on production forest land and this is to create important buffer
zones around protected areas.
In many cases, where communities have an economic incentive to implement
agroforestry systems, many of which are environmentally benign, these systems
frequently appear to be financially more attractive (as well as environmentally sound,
compared with alternative uses of forests). For example, research by IPB in 2002 Box 1: Rubber Agroforestry Systems (RAS) best for smallholder farmers
The first system, RAS-1, is similar to the traditional jungle rubber system, but recommended clones are used instead of unselected rubber seedlings. The clones must be able to compete with the natural secondary forest growth. Various planting densities (550 and 750 trees/ha) and weeding protocols were tested to ascertain the minimum management necessary for optimum production. Intensive weeding is limited to the two-meter strip of rubber rows; the space between rubber rows is less intensively weeded. This is important for smallholder farmers who need to maintain or increase labour productivity. The system is very much in line with the fallow enrichment concept and suits a large number of smallholders because of its simplicity.
The second system, RAS-2, is a more complex agroforestry system. Rubber trees are planted at normal density (550 stems/ha) along with perennial timber and fruit trees (92 to 270 trees/ha) after slashing and burning. Annual crops, mainly upland rice, are intercropped for the first two or three years, under various rates of fertilization. Planting densities of selected species were tested according to pre-established tree typology. Tree species such as rambutan, durian and petai were included. Natural regeneration is allowed in between rubber rows and farmers decide which naturally regenerating species to maintain.
In RAS-3, annual crops, mainly rice, are grown in the first year only, with legume crops such as Mucuna, Pueraria and Flemingia planted immediately after the rice harvest. Fast growing multipurpose trees (such as Paraserianthes falcataria, Acacia mangium and Gmelina arborea) can also be used. These trees can shade Imperata in the early years of rubber establishment while after seven to eight years; these can be harvested and sold to the pulp industry to provide farmers with extra income.
West Lampung shows a substantial financial advantage of the complex agroforestry
systems practiced by customary communities over rubber or oil palm monocultures.
2.1.2. Rubber Monoculture System
This is comprises of a single crop i.e. rubber rather than multiple of crop
species. In most cases monoculture is a response to the intensification of farming and
a drive to increase yields.
Many projects have been implemented in Indonesia in recent decades to
improve rubber productivity by introducing more intensive monoculture systems.
These include the Nucleus Estate and Smallholder project; the Rehabilitation and
Replanting for Export Commodities project; the Smallholder Rubber Development
Project (SRDP), the Tree Crops Smallholder Development project and the Tree Crops
Smallholder Sector project. Outside government project areas, most smallholders
cannot use recommended technologies because they are limited because they are both
financially and resourcefully incapacitated.
Between 1980’s and 1990’s the Indonesian government policy for the
development of clonal rubber plantations for smallholders at the national scale
resulted in the introduction of “clones”1, mainly in the form of rubber monoculture.
This particular cropping system, which is quite different from the traditional one, was
based on a technological package involving a high level of inputs (fertilizers,
pesticides and herbicides, cover crops etc.). The project started with 15 % of
smallholder rubber producers in Indonesia (350 000 ha) with clonal planting material
which allows threefold multiplication of rubber yields (i.e. 1500 kg/ha/year with
1
clones). The disadvantage of monoculture lies in the fact that it is not easily
reproducible by smallholders due to lack of capital, credit, availability of planting
material and technical information.
Because rubber does not yield a return on investments for 6 to 7 years, which
is a serious disadvantage, monoculture requires a relatively high starting capital to
purchase the necessary inputs for the first three years in order to get quick returns.
The cost of clonal planting material is high as well as the quality and availability
leaving a lot to be desired and emerging network of private nurseries is not yet
sufficiently advanced.
2.2. Policies Affecting Agriculture
Policies influencing the agricultural sector in Indonesia fall into of two
categories; i.e. agricultural price policies and macro-economic policies. Agricultural
price policies are commodity specific. Each price policy targets only one commodity
(e.g., rubber) at a time. Price policies also can influence agricultural inputs.
Macro-economic policies are nation-wide in coverage. Macro policies thus affect all
commodities simultaneously.
2.2.1. Agricultural Price Policy Instruments
All agricultural price policy instruments create transfers either to or from the
producers or consumers of the affected commodity and the government budget. Some
price policies affect only two of these three groups, whereas other instruments affect
all three groups. In all instances, at least one group loses and at least one other group
instruments e.g. taxes and subsidies, international trade restrictions, and direct
controls.
Taxes and subsidies on agricultural commodities result in transfers between the
public budget and producers and consumers. Taxes transfer resources to the
government, whereas subsidies transfer resources away from the government. For
example, a direct production subsidy transfers resources from the government budget
to agricultural producers.
International trade restrictions are taxes or quotas that limit either imports or
exports. By restricting trade, these price policy instruments change domestic price
levels. Import restrictions raise domestic prices above comparable world prices,
whereas export restrictions lower domestic prices beneath comparable world prices.
Direct controls are government regulations of prices, marketing margins or
cropping choices. Typically, direct controls must be accompanied by trade
restrictions or taxes/subsidies to be effective. Otherwise, “black markets” of illegal
trade render the direct controls ineffective. Occasionally, some governments have
sufficient police power to enforce direct controls in the absence of accompanying
trade regulations. Direct controls of cropping choices can be enforced, for example, if
the government allocates irrigation water or purchased inputs.
2.2.2. Macro-economic Policies Affecting Agriculture.
Agricultural producers and consumers are heavily influenced by
macro-economic policies even though they often have little influence over the setting of
fiscal policies, foreign exchange rate policies, and factor price, natural resource, and
land use policies affect agriculture Walter P. Falcon, and Scott R. Pearson (1995).
Monetary and fiscal policies are the core of macro-economic policy because
together they influence the level of economic activity and the rate of price inflation in
the national economy, as measured by increases in indexes of consumer or producer
prices. Monetary policies refer to controls over the rate of increase in the country’s
supply of money and hence the aggregate demand in the economy. If the supply of
money is increased faster than the growth of aggregate goods and services,
inflationary pressure ensues. Fiscal policies refer to the balance between the
government taxing policies that raise government revenue and the public expenditure
policies that use that revenue. When government spending exceeds revenue, the
government runs a fiscal deficit. That result creates inflation if the government covers
the deficit by expanding the money supply.
Foreign exchange rate policies directly affect agricultural prices and costs.
The foreign exchange rate is the conversion ratio at which domestic currency
exchanges for foreign currency. Most agricultural commodities are traded
internationally, and most countries either import or export a portion of their
agricultural demand or supply. For internationally tradable commodities, the world
price sets the domestic price in the absence of trade restrictions. The exchange rate
thus directly influences the price of an agricultural commodity because the domestic
price (in local currency) of a tradable commodity is equal to the world price (in
Factor price policies directly affect agricultural costs of production. The primary
factors of production are land, labor, and capital. Land and labor costs typically make up
a substantial portion of the costs of producing most agricultural commodities in
developing countries. Governments often enact macro policies that affect land rental
rates, wage rates, or interest rates throughout the economy. Other factor price policies,
such as minimum wage floors or interest rate ceilings, influence some sectors more than
others. Some governments introduce special policies to attempt to control land uses or to
govern the exploitation of natural resources, such as minerals or water. These macro
policies can also influence the costs of agricultural production.
2.3. Smallholder Export Crop Production
The rural economy of many developing countries is based on export crop
production. Export crops are grown for international markets. Most of them share
some common characteristics.
Firstly, they are high value commodities handled through reasonably
concentrated marketing systems. Secondly, their production relies on the use of some
purchased inputs. Finally, they are also internationally tradable, such that their
domestic price is closely linked to a world market price mediated through the
domestic exchange rate (Dorwardet. al., 1998).
The World Bank (2005) recognized a number of contributions that export crops
could make to agricultural development at the household level. Export crops are the
nucleus around which extension services, input supply and marketing are built. Food
in rotation. Export crops also allow the purchase of productivity enhancing equipment
and accumulation of capital for other investments.
It should be noted that critical issues facing export crop production under
market liberalization are somewhat different from those facing food crops. Many
staple food crops in Indonesia are essentially non-tradable internationally, as low
value-to-weight ratios preclude profitable trade and/or because they are not widely
consumed outside the country. Even where international trade might exist (as for
example with rice and maize), intra-country transport costs might inflate prices within
producing regions, thus hindering goods movements into the world market. Some of
the core requirements of the reform policies, including real exchange rate
depreciation coupled with the removal of subsidies on purchased inputs, have
dramatically reduced profitability of input use of most major food crops. Indeed, such
cases of reduced profitability have been reported in Jambi (Hawassi et al 2003).
Changes in relative input-output price ratios have been less adverse for export crops
than for food crops. In general therefore, the use of purchased inputs remains
profitable for export crops as compared to food crops.
Crumb rubber factories were introduced by the government; most of them
were private and depended only on the raw material from smallholder rubber
growers. State owned crumb rubber factories were integrated with the private owned
estates but the number was limited (Gapkindo 2004).
In 1968, crumb rubber processing technology was introduced and
commercially applied in Indonesia. Success and popularity of this crumb rubber
135 in 1974 (Gapkind
again significantly in 1
Source: Gapkindo, 200
Figure 1. Number of A 2001
In 1984 the num
capacity of raw rubber
get raw rubber and si
their operation.
pkindo, 2002). This number decreased to 87 in 1
tly in 1994 to 115 factories.
2002.
er of Actively Producing Crumb Rubber Factor
the number of crumb rubber factories decreased du
rubber raw material. There was tight competition a
and since the factories could not compete, they e
ability of crumb rubber industry depends strongly
rial from smallholder rubber farmers. The balanc
raw rubber material production should be
ons cause macro inefficiency especially in transp
0
7 in 1984 but increased
actories from 1969 to
sed due to the decreased
tition among factories to
they ended up stopping
trongly on the supply of
balance between factory
ld be maintained. Poor
transportation.
Table 3. Capacity and Production of Crumb Rubber Factories Based on Provinces from 2002 to 2004
NO Province
Capacity1 Production2 Deficit
Ton / year
1. Nangroe Aceh
Darussalam 0 47 097 47 097
2. North Sumatera 422 600 197 087 225 513
3. Riau 127 600 197 424 69 824
4. West Sumatera 163 000 64 288 98 712
5. Jambi 162 200 183 610 21 410
6. Bengkulu 44 000 33 563 10 437
7. South Sumatera 629 400 291 666 337 734
8. Lampung 24 000 25 097 1 097
9. West Kalimantan 160 000 173 165 13 165
10. Central Kalimantan 55 800 137 921 82 121
11. South Kalimantan 128 000 54 181 73 819
12. East Kalimantan 0 14 617 14 617
13. Others 16 800 21 751 4 951
T o t a l 1 933 400 1 441 467 491 933
Source: 1Gapkindo, 2004 2Ditjenbun 2004
Totally there was a difference of 491 933 tons (Table 3). This number reflects a
deficit in raw rubber material. The largest number was in the largest raw rubber
producing provinces i.e. North and South Sumatera. This condition is caused by; a
relatively tight competition in the raw rubber material marketing system. Another
influence caused by the shortage of raw rubber material is the irrational traffic of raw
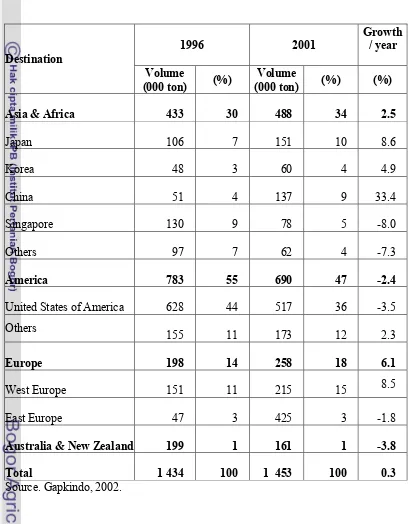
According to Table 3, the largest rubber producing provinces are North
Sumatera and South Sumatera. The reasons could be due to relatively tight
competition in the raw rubber material and the irrational traffic of raw rubber viewed
from the transportation side. Indonesian natural rubber export destination countries
(Table 6) are United States, Western European Countries, Japan, China, Singapore
and South Korea. The export to the U.S decreased to -3.5% from 1996 to 2001 due to
the slowdown in economics and automobile industries in the U.S. Export to the Asian
countries increased by 23.3% annually, China increased by 33.4% annually due to
the fast growth of economics at an average rate of 10% annually. Export to western
European countries also increased to 8.5% annually (Table 6).
According to the Indonesian Rubber Association (Gabungan Perusahaan Karet
Indonesia, Gapkindo in 2002 there were 91 crumb rubber Standard Indonesian
Rubber (SIR) factories, with 21 560 workers and 89 Ribbed Smoked Sheet (RSS)
factories all around Indonesia, in Java, Sumatera, and Kalimantan Islands and
concentrated latex or crepe factories. Most of the crumb rubber factories belonged to
private companies, smoked sheet factories to government-owned estates. In 2003
total capacity of the factories that belonged to Gapkindo members were 2.2 million
tons, 20% more than the raw rubber material produced, which meant that factories
should be more aggressive in buying raw rubber material. The Gapkindo members
were government-owned estates, private companies, processors, exporters, traders,
Table 4. Export Volume of Indonesian Natural Rubber Based Product from
Source: International Rubber Study Group (2002).
In 1969 Indonesian Natural Rubber (NR) export was dominated by Ribbed
Smoked Sheet (RSS), but ten years later by technically specified rubber (Standard
Indonesian Rubber SIR) and in 2002 SIR dominated, 96% of the total export. The
growth of Indonesian NR export based on the type of product during 1969-2002 is
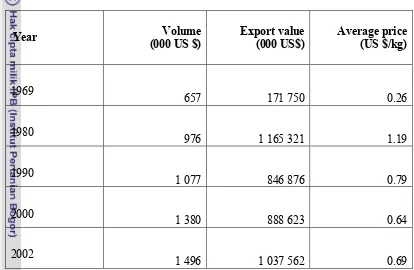
shown in Table 4. Based on its value, the Indonesian NR export fluctuated (Table 5),
export price was very much influenced by the international rubber price, supply and
demand, and competitiveness of Indonesian NR export compared to export from
other exporting countries such as Malaysia.
Since the economic crisis which was triggered by the monetary crisis in middle
of 1997 in several South East Asian countries, the economic growth was negative and
as well as the supply. This was shown by the negative growth and a drastic decrease
in exchange rate of the main natural rubber producing countries.
Table 5. Volume, Value and Average Price of Indonesian Exported Natural Rubber from 1969 to 2002
Year Volume
(000 US $)
Export value (000 US$)
Average price (US $/kg)
1969
657 171 750 0.26
1980
976 1 165 321 1.19
1990
1 077 846 876 0.79
2000
1 380 888 623 0.64
2002
1 496 1 037 562 0.69
Source. Ditjen Bina Produksi Perkebunan, 2004.
According to Burger and Smit (2001), between 1997 and 2000 the world
rubber market experienced a turbulence development, as well as serious shock from
11th September 2001 tragedy (The World Trade Center attack). In this respect, the
Table 6. Indonesian Rubber Export Based on Destination from 1996 – 2001
Destination
1996 2001
Growth / year
Volume
(000 ton) (%)
Volume
(000 ton) (%) (%)
Asia & Africa 433 30 488 34 2.5
Japan 106 7 151 10 8.6
Korea 48 3 60 4 4.9
China 51 4 137 9 33.4
Singapore 130 9 78 5 -8.0
Others 97 7 62 4 -7.3
America 783 55 690 47 -2.4
United States of America 628 44 517 36 -3.5
Others
155 11 173 12 2.3
Europe 198 14 258 18 6.1
West Europe 151 11 215 15 8.5
East Europe 47 3 425 3 -1.8
Australia & New Zealand 199 1 161 1 -3.8
Total 1 434 100 1 453 100 0.3
2.4. Review on Measuring of Efficiency
It thus appears that the amount of output from a currently known way of
production is determined not only by levels of inputs but also the existing
organizational arrangements i.e. institutions. An institutional factor is entered into the
production calculus in terms of its influence on the efficiency resource use. The
conventional perception is that institutions may have great influence on the ability
and willingness of a producer to correctly allocate resources at hand subject to his
objective e.g. output maximization, profit or revenue maximization, cost
minimization etc.
In deriving testable hypotheses of producer behavior, efficient production is
usually taken for granted. The standard assumption is that markets and information
are perfect, allowing equilibrium prices to clear any excess demand for and supply
inputs and output. This leads to a production situation with zero profit, which ensures
that inefficient producers may exist in the short run only and will eventually be driven
out of the industry during the transition towards long run equilibrium. Such
equilibrium is simply a conceptualization of a pareto-optimal state of production and
consumption with a somewhat dynamic property. In reality, an economy or industry
may experience a continuous transition from one state of equilibrium to another,
during which some inefficient producers may survive regardless of competitive
pressures. More importantly, inefficiency often perpetuates over a long period, mostly
as a result of imperfect information concerning the methods of input application as
differ significantly from one producer to another, leading to a production situation
characterized by markedly different efficiency.
In its early application, the concept of efficiency deals with output variation
by considering one input at the time. In this way, input use efficiency is shown in
terms of productivity of an input under consideration. Later development of the
concept makes it possible to measure the efficiency if input application for more than
one by some index of input use. However there is a problem in providing a
satisfactory index of input use, as different inputs may only be measured in different
units Farrel, (1957); Griliches, (1987). Some economists have tried to get round this
problem by suggesting cost comparisons as a measure of production efficiency but
such a measure can only be meaningful if all producers face the same input and
output prices.
Farrell (1957) suggested one method for measuring efficiency of input use
through estimation of ‘production frontiers’, from which a deviation of observed
output, at a given level of inputs technology is measured to give the degree of system
efficiency of that particular production. When factor prices are taken into account,
measurements of efficiency at observed level of output give ‘price efficiency’ or, as it
is often called, allocative efficiency. The combination of system and price
inefficiencies then gives ‘overall efficiency’, which is also called economic
efficiency.
Farrell’s approach is considered a sensitive way to simultaneously measure
the efficiency of all relevant inputs applied in a production process. But more
absence of computational techniques for estimating a production frontier.
Understandably, the applications of Farrell’s approach are simply confined to
efficiency measurements, which are obtained by comparing output of individual
producers to an average output of the industry. Lau and Yotopoulos (1971), for
example used the approach in comparing efficiency of a production unit relative to
another. By fitting an average production function for each production separately,
they then compared the constant terms to give relative efficiency measurements.
Although their method (i.e. unit-output-price profit function) can get round the
problem of model specification for physical input – output relationships, it does not
measure the efficiency of a particular unit (e.g. farm or firm) from the maximum
possible output under actual circumstances of production. In addition, this method
becomes impractical when comparing the efficiency of more than two production
units. Further, this methods fails to specifically distinguish the source of differences
in the performance of production units considered, in a sense, it does not show the
relative importance of two components of ‘efficiency parameter’ (i.e. efficiency
related error terms and white noise). In other words, a difference in the efficiency of
two production units may be statistically significant, but it cannot be ascertained
whether the difference is due to efficiency –related error terms (i.e. methods of input
application) or random errors. Unless these two error terms can be decomposed, there
is a possibility for making an incorrect conclusion about efficiency differentials. For
example, production units under investigation may be equally (in) efficient, but
considered as being different because their efficiency parameters are statistically
With the advent of more sophisticated econometric techniques, production
possibility frontiers with decomposed error terms can be estimated with great ease. A
parametric representation of production with decomposed error terms was first and
independently suggested by Aigner, Lovell and Schmidt (1977), Meeusen and Broeck
(1977), Battesse and Cora, (1977). As noted by Bauer (1990), Econometric
techniques for the estimation of production function basically remain unchanged. The
only advancement is found in the specification of error terms, which consists of two
parts. There is statistical noise with a normal distribution and inefficiency with a
one-sided distribution.
2.4.1. Smallholders Production Efficiency
A fair amount of attention has been directed at assessing the relative
efficiency of smallholders. However as Carr (2003) points out, many smallholders are
not trying to maximize production but to take a risk-free strategy given the policy
constraints. Higher smallholder productivity would be possible if these constraints
were removed. He argues that unlike food crops, which are grown everywhere, export
crops are only grown in areas well suited for their growth. There are few ecological
constraints and many well developed technologies available for the smallholders.
However, unlike food production export production is very sensitive to government
policies on agriculture, exchange rates and retailing. Technical matters require further
research but to a great extent production increases will be achieved more by policies
which remove the constraints on smallholders using technology.
The accumulated evidence suggests that smallholders are not as efficient if
of returns to land. Smallholders can adopt a low-input and low-output strategy and
continue making a profit at prices that would not be economically viable for estates.
‘Such flexibility offers the possibility of efficient resource allocation in response to
the diversification of economic opportunities in the developing economies, as well as
being a form of insurance against the uncertainties inherent in world markets (Tiffen
and Mortimore, 1990). Furthermore, the political case for smallholder rubber
agroforestry farming rests not only on efficiency, but also on equity considerations in
the distribution of land and in the regional knock-on effects that smallholdings would
generate.
2.4.2. Adopted Model on Measuring Efficiency
The Policy Analysis Matrix (PAM), developed by Monke and Person (1989),
provides an organizational framework, which identifies patterns of incentives for
economic sectors at each level of the commodity chain, and analyses the impact of
direct policy on these patterns at each level as well as their effects on different
production technologies, Staal and Shapiro, (1994). The impact of specific
commodity and macro-economic policies is gauged by comparing results in the
presence and absence of the policy Scarborough and Kydd, (1992). According to
Shapiro and Staal (1995), policy in the context of marketing of agricultural
commodities is defined as those government decisions (market interventions) which
alter the prices economic agents (such as farmers, traders, processors, wholesalers,
retailers and consumers) face and which affect their incomes and welfare.
The PAM is a matrix of information about agricultural and natural resource
system budget calculated at private and social prices (Monke and Pearson, 1995).
Private prices are the prices that farm households are facing (local or domestic market
price of input and output). Therefore, profitability or NPV valued at private prices, so
called private profitability, is an indicator for production incentive Tomich et al,
(1998). Social prices are the economic prices that remove the impact of policy
distortion (taxes, subsidy and other local levies) and market imperfections. Usually it
is derived from export or import parity prices of particular inputs or outputs.
Profitability measured at social prices, so called social profitability, is an indicator of
potential profitability.
In brief, the Domestic Resource Cost (DRC) approach uses social profitability
to measure efficiency; the greater the profitability, the stronger the efficiency (Monke
and Pearson, 1989). Specifically, systems efficiency can be measured by a DRC ratio:
DRC = Value of domestic factors at economic prices per unit of output
Value added at economic prices per unit of output
In addition to computing profitability, the PAM is used to compute protection
coefficients such as DRC, EPC, ERP, NPC and NRP of which DRC is the most
important. For this study DRC is computed to determine the production efficiency of
the rubber smallholders under agroforestry and monoculture systems respectively.
DRC is a summary measure of the efficiency of domestic production and is
interpreted as the costs required for earning a unit of foreign exchange. DRC is also
used in comparing relative efficiency among agricultural commodities and is defined
tradable value added. In other words DRC indicates whether the use of domestic
factors is socially profitable or not.
Commodities are ranked according to DRC value, and this ranking can then
be taken as an indication of competitive advantage or disadvantage.
It should be noted that social profitability needs to be gauged under “shadow”
instead of market prices. As opposed to observable market prices, shadow prices are
“social” prices reflecting the value of social benefits or costs. For example,
agroforestry high profitability in rubber may not reflect efficient resource utilization,
but could result from direct or indirect government interventions artificially lowering
the production costs or raising the output prices. Therefore, using distorted market
prices to measure profitability tends to result in a “false” indication of efficiency; and
shadow prices, which measure the true or social value of production costs and
revenues, should be used in calculating DRC ratios for efficiency assessment.
Empirical DRC analyses are often conducted based on the “Policy Analysis Matrix”
(PAM), which is a standard apparatus for policy decision-makings (Monke and
Pearson, 1989) and used widely in efficiency analysis of related to agriculture
commodities.
2.5. Measuring Distortions
2.5.1. Distortions in Agricultural Commodity Markets
More efforts have been put in place recently in measuring distortions in the
agricultural sector. Several studies have sought to evaluate the costs of such trade
producer prices for cereals relative to other competing opportunities, thus increasing
incentives for food production. A good example is shown in the study in Kenya by
Jabara (1985). The study revealed that producer prices (output prices deflated by
input prices) for food and other crops increased substantially from 1979 to the early
1980s and these increases in prices were associated with the increase in marketed
agricultural production. In another major study on pricing policy in developing
countries, the United Nations Food and Agriculture Organization (FAO) (1985) noted
that, while international cereal prices fell to 18 per cent between years 1978 and
1982, developing countries domestic producer prices rose on average by 5 per cent
over the same period.
The study by Byerlee and Sain (1986) found no consistent evidence of price
disincentives for agricultural commodity producers in less developed countries.
Although the countries kept prices low to consumers, according to the Byerlee and
Sain study, the countries did so using policies that did not directly tax producers. It is
clear that government taxation of the exportable commodities, which is embraced in
the controlled prices set by the government, is a policy considered unfavorable.
Westlake (1987) draws attention to the policy distortions that existed in developing
countries major agricultural subsectors and tried to visualize the empirical method to
estimate distortions on national levels.
2.5.2. Adopted Model
Standard ratios reflecting the degree of price divergences or distortions are
normally calculated to compare profitability and efficiency of different crops. These
process and outputs are dissimilar. A number of protection coefficients are calculated
in a standard PAM. The most commonly used protection coefficients are Nominal
Protection Coefficients (NPC) and Effective Protection Coefficient (EPC).
Many studies have quantified the distortions of input prices to be caused by
policies (Repetto, 1985; Tjornhom, 1995; Lee and Espinosa, 1997), and there are a
few techniques to evaluate the degree of protection or subsidy. Most of the techniques
that have used methods in which the distortion is observed by the comparison of
world price, or border price, and the prevailing market price, which allows the use of
the conceptual framework constructed.
2.5.3. Subsidy on Inputs
The method used by Repetto (1995), Lee and Espinosa (1997) compared the
subsidy on pesticides and fertilizers against that on other inputs. Conceptually, their
subsidized prices were the same as the private prices in most other analyses.
However, a difference was that the subsidized prices were estimated by adding up
costs of importation, transportation, and sale with current subsidies.
The unsubsidized prices set as benchmark prices are different from the social
costs in several studies. These are calculated as if fertilizers and pesticides are treated
as any other production input. “(t) his approach compares the specific sources of
fertilizer and pesticide subsidies (currency overvaluation, favorable tariff treatment,
tax exemptions, etc.) against a counterfactual which measures the “standard” social
costs of inputs and goods (particularly imported goods) in an economy.” Lee,