International Conference on Teaching & Learning in Higher Education (ICTLHE 2011)
The impacts of PBL on Student’s Performances
Faaizah Shahbodin1 and Che Ku Nuraini Che Ku Mohd2, Faculty of Information and Communication Technology,
University of Technical Malaysia Melaka (UTeM),
Locked Bag No. 1752, 76100 Durian Tunggal, Melaka,MALAYSIA
Corresponding email: [email protected], [email protected]
Abstract
The purpose of this paper is to evaluate the impacts of PBL on students’ performances. 56 respondents were enrolled in the Human Computer Interaction course that are in the second year of study from Universiti Teknikal Malaysia Melaka. Three phases involved in this research methodology which is 1) Analysis, 2) Designing and Development and 3) Testing and Evaluation. There are three research instruments gathered to evaluate the project which are questionnaire, interview and prototype development. A t-test was conducted to analyze student’s performances. Findings of this study revealed that the use of PBL approach could increase student’s understanding towards the topic that has been taught.
International Conference on Teaching & Learning in Higher Education (ICTLHE 2011)
1. INTRODUCTION
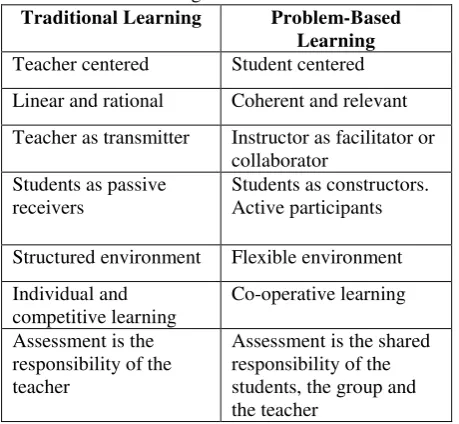
Even since ICT becomes popularly used in teaching and learning, there is enormous to integrate PBL within online environment (Watson G., 2002; Savin-Baden, 2007). Problem will drive the learning where students are not only required to seek a correct answer for the problem, but they have to interpret the problem, gather needed information, identify possible solutions, evaluate options, and present conclusions that are related to the problem (Zaidatun Tasir et al.,2005). Problem Based Learning (PBL) is a pedagogical strategy for posing significant, contextualized, real world situations, and providing resources, guidance, and instruction to learners as they develop content knowledge and problem-solving skills (Mayo et al, 2000). PBL also encourages collaborative and cooperative learning among students and their peers; students play the key role in encouraging learning in this collaborative setting (Neo, 2003). Below is the comparison between traditional learning and PBL.
Table 1: Comparison between Traditional Learning and Problem-Based Learning
Traditional Learning Problem-Based Learning Teacher centered Student centered Linear and rational Coherent and relevant Teacher as transmitter Instructor as facilitator or
collaborator Students as passive
receivers
Students as constructors. Active participants Structured environment Flexible environment Individual and
There are 56 undergraduate respondents from Interactive Media course. The course will be held at second semester of study at Universiti Teknikal Malaysia Melaka (UTeM). The preliminary data were gathered to justify the difficult topic in HCI subject.
Table 2: Preliminary Analysis
Topic Mean N Std.
Deviation
Introduction 2.06 56 .818
Cognitive Psychology 2.72 56 .834 User Interface Design 3.82 56 1.119 Accessibility Issues 3.10 56 .839
Design Issues 3.12 56 .872
Table 2 shows the preliminary data for choosing the HCI difficult topic. Based on findings, the highest mean is 3.82 and standard deviation is 1.119. It is found that the most difficult topic in HCI subject is User Interface Design compared to other listed topics. The HCI subject is chosen because it is a compulsory subject for computer science students in Media Interactive course. Specifically HCI is concerned developing new interfaces and interaction techniques.
2.2 Context
The research is carried out at UTeM that organizes its curriculum according to principles of PBL. The HCI subject will cover Chapter 3 on User Interface Design. Students will be presented with a problem. The problem is initially discussed. The information gathered is shared and elaborated upon. Tutor acts as a facilitator to facilitate and scaffold student learning process.
2.3 Instrument
There are three instruments that have been developed for this research:
a) Questionnaire – Questions are distributed to students to grade the difficulties of each topic. Students were asked to respond to these items on a five-point Likert scale .
b) Interview- HCI lecturers are interviewed and selected students regarding HCI topics. c) Prototype – The prototype is developed
International Conference on Teaching & Learning in Higher Education (ICTLHE 2011)
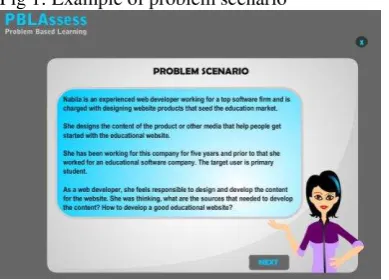
Fig 1: Example of problem scenario
3. FINDINGS AND ANALYSIS
3.1 Pre and Post Test Result
Table 3 shows the result of t-test and p-value for self and peer assessment using PBLAssess. The test employs paired sample t-test. Based on the performance of the students in t-test using self assessment and peer assessment assessment preferences in PBLAssess, the t-value is 9.427 and the significance of two tailed value, p is 0.000. In the next series, peer assessment preferences in PBLAssess, the t-value is -11.955 and the significance of two tailed values, p is 0.000. The result shows, p< 0.05, thus there is a significant difference between using of self assessment and peer assessment in PBL. Hence, the null hypothesis H01 is rejected.
Table 3: Pre and Post Test Result Testing
Based on the result, peer assessment performs highest mean compare to self assessment in PBL. Hence, the result indicates that peer assessment perform better that self assessment among students at UTeM. The Human Computer Interaction (HCI) subject focuses on the User Interface Design topic as a case study in this research. Peer assessment also can be used to enhance
the quality of students’ personal improvement and
their contribution on group work (Roberts T.S., 2006).
3.2 Relationship between PBL assessment between
student’s performance and preference
Table 4: Mean and Standard Deviation Student’s group that prefers peer assessment is 2.580 and p-value is 0.023. Since the p-value is smaller than 0.05 (p<0.05), there is a significant difference between the result of using peer assessment and self assessment. Thus, there is a positive relationship between peer assessment student preferences and their performances.
Besides that, students with self assessment, who have been using peer assessment in PBLAssess perform the highest average with 57.50 (SD = 10.875) compared to group using self assessment which the average is 56.50 (SD = 8.835). The results also reveal that students using self assessment with average score of 56.50. The tvalue for the group that prefers self assessment is -0.632 and p-value is 0.000. The p-value is smaller than 0.05 (p>0.05), there is a significant difference between the result of using self and peer assessment. Thus, there is a negative relationship between linear
student’s preferences and their performances.
4. IMPLICATION
International Conference on Teaching & Learning in Higher Education (ICTLHE 2011)
directed learning skills and teamwork skills should be assessed.
In the testing that conducted among students, it proves that using the peer assessment give the students the experience of having to clearly explain their thoughts and to refine those that were not clear to their fellow students. Self and peer assessment promote the values of the learning process. The self assessment allows the learners to compare the standards achieved by the other learners against their own work (Race P. et al., 2005). It usually allows them to assess aspects of their work such as the range of vocabulary, originality and structure. It is also recognized that peer assisted learning which can have a motivating effect on the teams and mentoring between teams should be encouraged and rewarded (Frank, M., & Barzilai, A., 2004).
5. CONCLUSION
At the end of the PBL session, it was observed that majority of students enjoy using the PBL approach in the course. With the development of prototype, it enhances learning especially assessment part because it gives new opportunities for sharing information, resources and expertise. It is important to build trust among students and between facilitators and the learners so they are able to create a relaxed atmosphere especially in PBL environment. The process of PBL lends itself well to the definition of learning as understanding because assessment is regarded as an integral element in the facilitation of learning
(O’Grady G., 2004). There are also many areas in PBL
and assessment that are still open issues. Other educators should also consider using PBL in the classes and the assessment techniques used can easily be applied to study its impact on enhancing student learning in their course.
ACKNOWLEDGMENT
We would like to thank Universiti Teknikal Malaysia Melaka (UTeM) and Centre for Research & Innovation Management (CRIM) which funded this research project. Finally, everyone that participated in the project and gave constructive criticism during its development is gratefully acknowledged.
REFERENCES
[1] Abu Hassan , Mohd Ariffin and Mohd Yusof, Khairiyah and Abd Hamid, Mohd Kamaruddin and Hassim, Mimi Haryani and Abdul Aziz, Azila and Syed Hassan, Syed Ahmad Helmi (2004). A review and survey of Problem Based Learning application in Engineering Education. In: Conference on Engineering Education (CEE 2004), 14-15 December 2004, Kuala Lumpur.
[2] Che Ku Nuraini Che Ku Mohd & Faaizah Shahbodin (2009) Assessment techniques in PBL for teaching Human Computer Interaction. International Conference on Software Engineering and Computer System (ICSECS09), 19-21 Oct 2009, UMP, Pahang.
[3] Frank, M., & Barzilai, A. (2004). Integrating alternative assessment in a project-based learning course for preservice science and technology teachers. Assessment & Evaluation in Higher Education, Vol. 29(1), pp.41-61.
[4] Mayo, W. P., M. B. Donnelly, et al. (2000). Characteristics of the ideal problem-based learning tutor in clinical medicine. Evaluation and the Health Professions Vol. 18(2), pp. 124-136. [5] Neo. T. K. (2003). Using multimedia in a
constructivist learning environment in the Malaysian classroom. Australian Journal of Educational Technology,Vol. 19(3), pp. 293-310. [6] Race, P., et al. (2005). 500 tips on assessment.
London: Routledge Falmer, second edition.
[7] Savin-Baden, M. (2007).A Practical Guide to Problem Based Learning Online, Routledge. [8] Uden, L. and C. Beaumont (2006), Technology
and Problem Based Learning. Hershey, PA: Information Science Publishing.
[9] Watson, G. (2002).Using Technology to Promote Success in PBL Courses. Available from : http://technologysource.org/article/using_technolo gy_to_promote_success_in_pbl_courses/