ANALYSIS OF THE INSTITUTIONAL CAPACITY
AS A PART OF THE INSTITUTIONAL
ECONOMICS: EVIDENCE FROM THE
ORGANIZATIONAL CAPACITY OF SURAKARTA
CITY LOCAL GOVERNMENT
Agung Riyardi
1, Widojono
2and Muzakar Isa
21
Muhammadiyah University of Surakarta, Economics Department of Economics and
Business Faculty
Jalan A. Yani Tromol Pos 1, Pabelan Kartasura, Jawa Tengah 57102, Indonesia
2Muhammadiyah University of Surakarta, Management Department of Economics and
Business Faculty
Jalan A. Yani Tromol Pos 1, Pabelan Kartasura, Jawa Tengah 57102, Indonesia
Agung.Riyardi@ums.ac.id (Agung Riyardi)
Abstract
The institutional capacity is a part of the institutional economics. There are two standards of
the institutional capacity. The first standard is the
optimality
capacity
of micro, mezzo, and macro levels. The second standard is the criteria of expertise,
specificity, and incentives. However, analysis on the concept of institutional capacity is
limited.
Therefore,
this study
aimed
to analyze
the
application
of
the
institutional capacity in Surakarta city local government and to obtain empirical facts of the
optimal capacity of micro, mezzo and macro levels and its correlation with the institutional
criteria. Descriptive method was applied to measure the capacity optimization in the
micro, mezzo, and macro levels and to describe its correlation with the institutional criteria,
namely expertise, specificity, and incentives. To examine the level of the capacity
optimization, the percentage of the expected and prevailed was analyzed, whereas the
dynamics of each criterion since 2005 to 2011 was analyzed to illustrate the correlation
with the institutional criteria. The study indicated the overall capacity of Surakarta city
government has not been optimal, due to their suboptimal mezzo and macro levels capacity.
In addition, the capacity of micro, mezzo and macro level of Surakarta government turns to
have correlation with the institutional criteria. The micro level correlates with the expertise
criterion, the mezzo level with the specificity in authority and incentives criteria, and
the macro level with the specificity in responsiveness criteria.
1.
Introduction
Human behaves as a response to surrounding institution. The choices and the articulated of human behavior are mostly affected by the surrounding environment. For instance, some Muslims are inconvenient with the usury of conventional bank, consequently, Islamic financial organizations emerge widely in Indonesia (Muttaqien, 2008). Schramm and Taube (2003) also figure out the the relation between corruption among the government officials and the surrounding institution in China. It turns out that corruption among the officers in the traditional values institution is higher compared to those in the anti-corruption modern institution.
Various studies have conducted regarding with the issue. Wardhono (2009), for example, analyzed the institutional factors such as the land law and its relevance with the transformation of land ownership in Klompangan village, Jember. Baksh and Ahmad (2008) analyzed the relation between credit institution and sugar cane farmers. Ngumar and Budi (2003) analyzed the integrated-investment institution in East Java. Maflahah (2010) analyzed the institutional factors that are important in reducing disorder in the supply chain of taro industry. Those studies analyzed institutions and human behavior as the response to institutions around them. Meanwhile, capacity is essential for an institution as it causes various related parties to behave and respond appropriately to the institution. Anantanyu (2011) reaffirms the importance of capacity as shown by the increase of farmer living standard as the result of proper institutional capacity of agriculture.
Despite its significance, studies on institutional capacity of local government are rarely conducted. This study aimed to analyze the organizational capacity as an institution in Surakarta City Local Government. Analysis on organizational capacity would be based on the studies conducted by Sragen Local Government (Pemerintah Daerah Sragen) in 2011 and Riyardi et al. in 2013. In addition, analysis on institution consisted of examination on expertise, specificity, and incentive. It is expected that the research will encourage further study regarding with institutional capacity at local government level to enrich understanding on the institutional capacity and institutional economics.
2.
Literature Review
Economic Capacity
The economic capacity can be defined theoretically and technically. The theoretical definition of the economic capacity is related to the equilibrium condition. Equilibrium condition refers to the state of economic full capacity, while non-equilibrium conditions may indicate economic under or over capacity. These various states are mainly caused by the balance of supply and demand. High supply without demand suitability would result in over-capacity and conversely, supply is less than demand will lead to under capacity.
Technically, the economic capacity is defined as the capacity utilization. It is assumed that economic capacity cannot easily utilize resources and produce goods to meet the demand. The utilization can be higher or lower than the demand. As a consequence, a lag between the actual and potential output occurs. The economic capacity describes the level of the capacity utilization in the economy.
The organizational capacity can be used as an approach to the economic capacity. It is because the organization is more easily observed than the economy. For instance, the organization of seller and buyer is more easily observed than the overall economy that includes seller and buyer. Therefore, determining the economic capacity and utilization can be approached through the organizational capacity and utilization.
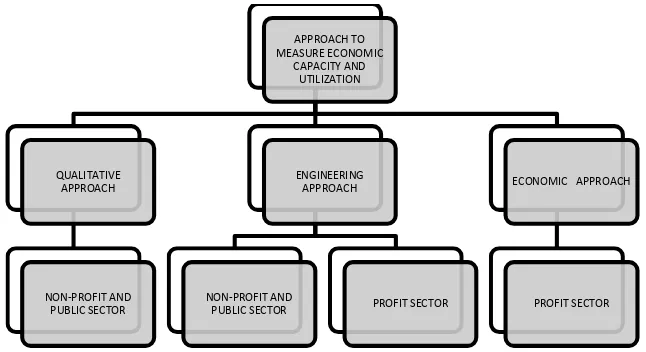
Fig. 1 Classification of Groups Studying Economic Capacity and Utilization
Sato et al. (2000), Plescovic et al. (2002) and Yuswijaya (2008) are included in the first group. Sato examined organizational capacity of projects under ODA authority in Bangladesh, Thailand and Indonesi, which were the rural electrification development project and the backward village infrastructure development project. Three criteria were used to assess organizational capacity, namely, expertise, specificity, and incentives. Those studied figured out the role of organizational capacity in increasing the project’s performance. Plescovic et al. (2002) who used the perception of the various groups that are considered having competence in the matter as an analysis technique argued that indigenous capacity was needed in the field of education and research in the transition economies. Yuswijaya (2008) who used perception of the employees as a technique to measure the organizational capacity analyzed that the organizational capacity of Civil Service Police Unit in Lahat municipality at individual, organization and system level is optimal.
The second group is represented by Riyardi et al. (2013). The engineering technique used to analyze the organizational capacity was comparing the percentage between the expected capacity and the existing capacity. It is found that the organizational capacity at all levels in Sragen municipality local government was inoptimal.
The second group includes the studies of Johanson (1968) and Berndt and Morrison (1981). Johanson (1968) is the first proponent who used engineering approach, whereas Berndt and Morrison (1981) used the economic approach. Based on their approaches, the engineering and economic approaches are developed. They are the second and third group of economic capacity and utilization approach for profit sector.
Institutional Economics
[image:3.595.159.446.643.733.2]Institutional Economics discusses the relation between economic agents and institution around them. Figure 2, as stated by Hodgson (1998) shows the relation that occurs in institutional economics. As shown in Figure 1, on the right side the institution forms and send information, whereas on the bottom and right sides, it is shown that the agents will make a decision and do a behavior based on the information signed by the institution. Furthermore, as shown in the right-top side, the cyclical and dynamic adjustment happens. The behavior will be responded by the institution.
Fig. 2 Interation in Institutional Economics APPROACH TO
MEASURE ECONOMIC CAPACITY AND
UTILIZATION
QUALITATIVE APPROACH
NON-PROFIT AND PUBLIC SECTOR
ENGINEERING APPROACH
NON-PROFIT AND
PUBLIC SECTOR PROFIT SECTOR
ECONOMIC APPROACH
PROFIT SECTOR
Institution
Behavior Information
Petrović and Stefanovic (2009) explain two theories of Institutional Economics, namely, Old Institutional Economics Theory and the New Institutional Economics Theory. Old Institutional Economics assumed that the institution is not easy to be trusted by agents and the theory seeks and discusses sociological, psychological, technological and laws factors which determine un-trusted behaviors to the failed institution done by agents. The theory analyzed the reasons of a non-maximization based behavior.
Old Institutional Economics Theory is known as an opposition to the Neo-classical Economic Theory. The reason is the contradiction values. The Old Institutional Economics Theory assumed the probability of a non-maximization based behavior, whereas the Neo-classical Economic Theory assumed agents always have a profit maximization orientation.
Some exponents after exponents of Old Institutional Economics Theory tried to continue the economic concept of Old Institutional Economics Theory with an emphasis on the efforts to give an answer to the failure of the assumption of the Neo-classical Economic Theory. J. Schumpeter, G. Myrdal and K. Galbraith are among those exponents. Santosa (2008) classified their concepts into Institutional Quasi Economics that are different from the Old and New Institutional Economics. The New Institutional Economics Theory puts more emphasis on the conceptualization of various things that accompany the relationship between institution, information, and decision-making. Various conceptualizations include the concept of transaction costs, property rights, public choice and game theory. The decision-making may or may not be based on profit maximization. The choices in the decision-making emerge because there is an information from institution. The information is analyzed and processed based on one or more concept of transaction costs, property rights, public choice and game theory.
Santosa (2008) analyzed that the conceptualization strengthened the position of Institutional Economics Theory as 'opponent' of Neo-classical Economics Theory, market economy or such. The conceptualization in Institutional Economics Theory can be divided into institutional environment and institutional arrangement. This conceptualization can lead to the understanding of the essence of holistic approach and the diversity of the economic education. Institutional Economics considers that institution, either formal or informal, is different from organization. Institution, according to Rutherford (2001), is broader than organization. Institution includes organizations, various forms of laws and regulations, culture, technology and agents, whereas organization as mentioned by Sato et al. (2000) is groups bound by some common purpose. Institution provides strong sign for the agent behaviors.
3.
Research Method
Research Design
The study was a descriptive research. There are two types of descriptive design. The first type is descriptive design to analyze the organizational capacity of Surakarta city government. The second type is descriptive design to analyze the readiness of the organization of Surakarta city government to be responded by surrounding parties.
There are four variables, namely the capacity variables of micro, mezzo, macro level and the whole level. The capacity variable of micro, mezzo and macro level has sub variables. Each sub-variable has assessment indicators. Table 1 shows the variables and the sub variables. The indicators are not shown. The data in this research were taken from the documents available. Those documents were taken from Statistics Central Bureau and various agencies in Surakarta city government.
Tab. 1 Variables and Sub-variables
VARIABLES SUB VARIABLES
Overall Micro
The Number of Surakarta local government civil servant The quality of Surakarta local government civil servant
System capacity Local fiscal capacity Local fiscal sustainability Macro Public service quality
Public service accessibility
Data Analysis Technique
This research employed two data analysis techniques. The first technique was used to describe the organizational capacity of Surakarta city government. The second technique was used to describe the form of the institutional economics in Surakarta city government. The first technique is executed following Riyardi, et al. (2013) with the following steps:
1. Calculated the percentage of the target variables and sub variables using tools of statistical linear trend.
2. Calculated the percentage of optimization capacity by comparing the percentage of the performance with the target that has been computed on the entire sub variable and variable. 3. Classified the level of capacity optimization of sub variables and variables into optimal, not yet
optimal and not optimal based on certain criteria.
The second technique is executed by measuring the institutional dynamics at all sub variables and variables. There are three steps in this technique:
1. Classified variables and sub variables based on characteristics as proposed by Sato et al (2000) in the form of expertise, specificity and incentive.
2. Measured the dynamics of each characteristic based on the state of dynamic. It is called dynamic if a characteristic shows an increase from year to year. It is called not dynamic if a characteristic shows a decrease from year to year.
3. Concluded that one or whole characteristics correspond to responsiveness factor of institutional characteristics. A characteristic is responsive if it meets the dynamic criteria.
4.
Results and Analysis
Organizational Capacity of Surakarta City Government
Overall, the organizational capacity of Surakarta city government is not optimal. The overall average indicates that the percentage of organizational capacity is 89,90% of the ideal capacity. The overall capacity, as can be seen in Table 2, is contributed by micro level capacity (99.73%), mezzo level capacity (83.62%), and macro level capacity (86.35%). Thus, the organizational capacity of Surakarta city government is not optimal
Tab. 2 Organizational Capacity of Surakarta City Government
LEVEL CAPACITY (%)
Micro 99.73 Mezzo 83.62 Macro 86.35 Average 89.90
Note: The capacity value is a calculation result. The raw data is not presented but available in the research report.
Tab. 3 Organizational Capacity of Micro Level in Surakarta City Government
Note: The capacity value is a calculation result. The raw data is not presented but available in the research report.
The organizational capacity of mezzo level in Surakarta city government is not optimal. As illustrated in Table 4, this condition is caused by Administration Capacity and System Capacity sub variables. The Administration Capacity is above the ideal state (120%), while the System Capacity is 60% of the ideal capacity. The Administration Capacity which is above optimal is caused by the expenditure of goods and capital that reachs 145.40% of the ideal expenditure, while the System Capacity is not optimal because there are several units and SKPDs which have operated but did not have a renstra, SOP and SPM.
Tab. 4 Organizational Capacity of Mezzo Level in Surakarta City Government
MEZZO LEVEL CAPACITY (%)
Administration Capacity 120.65 System Capacity 60.32 Local Fiscal Capacity 97.94 Fiscal Sustainability Capacity 92.59 Average 83.62
Note: The capacity value is a calculation result. The raw data is not presented but available in the research report.
The organizational capacity of macro level in Surakarta city government is not optimal. The definition of macro level in this case is the relationship between the local government and its environment in the form of public service. The focus of public service and its capacity is the capacity of quality in giving public service and the capacity of its accessibility. Table 5 shows that in Surakarta city government, the public service quality are not in an optimal state.
Tab. 5 Organizational Capacity of Macro Level in Surakarta City Government
MACRO LEVEL CAPACITY (%)
Capacity of Public Service Quality 72.7 Capacity of Public Service Accessibility 100 Average 86.35
Note: The capacity value is a calculation result. The raw data is not presented but available in the research report.
Institutionalism of Surakarta City Government
Surakarta city government is a responsive institution. It can be seen from the correspondence of every level of organizational capacity with expertise, specificity in responsibility and accountability and incentive characteristics. Micro level corresponds to expertise characteristic, mezzo level is in the form of sub-level administration on expenditure of goods and capital, macro level in the form of public service quality and accessibility corresponds to specificity characteristic: responsiveness, mezzo level in the form of system capacity corresponds to specificity characteristic: accountability, and mezzo level in the form of budget either from higher government or local government revenue
MICRO LEVEL CAPACITY (%)
corresponds to incentives characteristic. Table 6 shows the correspondence between levels and sub-levels of organizational capacity and institutional characteristics.
Tab. 6 Correspondence Between Levels/Sub-levels of Organizational Capacity and Institutional charactheristics
Level Sub-Level Institutional Characteristics
Micro level
Number of civil servants
Expertise
Quality of civil servants Commitment of civil servants
Mezzo level
Administration of good and capital
expenditure Specificity: Responsiveness System capacity Specificity: Authority
Local government expenditure Incentives
Sustainability of local government
expenditure Incentives
Macro level Quality of public service Specificity: Responsiveness
Public service accessibility
Note: The institutional characteristics are based on the data provided in Table 7, 8, and 9
Micro level of Surakarta city government has an institutional characteristic, namely expertise because the three components of micro level had an increasing dynamics from 2006 to 2011. The three components of the micro level of Surakarta city government are the number of civil servants, the quality of civil servants and the commitment of civil servants. Table 7 describes the micro level of Surakarta city government and its dynamics.
The number of civil servants in Surakarta city government has decreased since 2009. The decrease in 2011 was higher than the decrease in 2009 and 2010. The number of civil servants in 2011 decreased by around 4% from the previous year, while the number of civil servants in 2010 and 2009 decreased by under 1, 5%. The decrease in the number of civil servants corresponds to a hope that civil servants should focus more on a term “poor in structure but rich in function" as stated by Pujiyono (2006) or Yustiono (2008).
Tab. 7 Micro Level Dynamics of Surakarta City Government
Years
Number of Civil Servants Based on Formal Education Level
Violation Settlement Total <Junior
high
Senior high
Senior high <civil servants<S1
Bachelor degree
(S1)
Master degree (S2)
with lower than bachelor degree education background (D3 diploma degree, D2 diploma degree, D1 diploma degree, high school degree, junior high school and elementary school degrees) decreased, while the number of civil servants with bachelor (S1) and master (S2) degree increased. The number of civil servants with S1 degree has decreased since 2009, but since 2006 the number of civil servants with S1 degree increased. The second indication is the domination in number of civil servants with higher education over civil servants with primary and secondary education. For example, in 2012, the number of civil servants with S1 and S2 degree reached approximately 60% of the total civil servants in Surakarta.
In addition, the commitment of Surakarta city government civil servants, using an approach to violation settlement, also shows expertise characteristic. General violations, not extra ordinary violations like corruption and terrorism, which could be solved have decreased since 2010. It shows that there were less violations committed by the civil servants. On the contrary, it shows that the civil servants have a great commitment to their job.
Mezzo level of Surakarta city government organization also demonstrates it as an institution because the mezzo level describes the system, administration, local fiscal and local fiscal sustainability which have similarity with institutional criteria, i.e. specificity and incentives. Table 8 shows the dynamics of mezzo level of Surakarta city government.
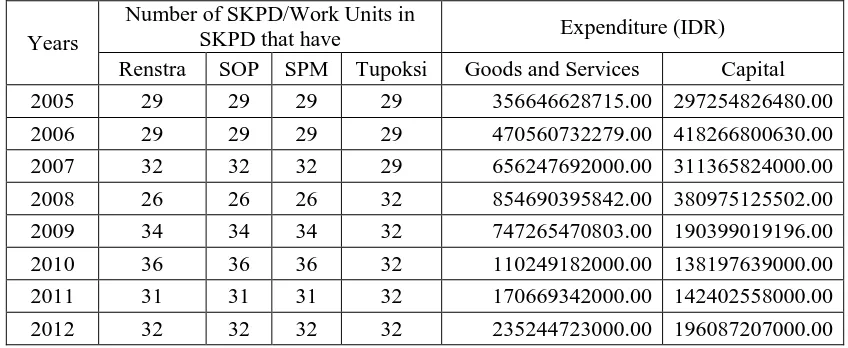
Tab. 8 Dynamics of Mezzo Level in Surakarta City Government: System and Administration
Years
Number of SKPD/Work Units in
SKPD that have Expenditure (IDR) Renstra SOP SPM Tupoksi Goods and Services Capital 2005 29 29 29 29 356646628715.00 297254826480.00 2006 29 29 29 29 470560732279.00 418266800630.00 2007 32 32 32 29 656247692000.00 311365824000.00 2008 26 26 26 32 854690395842.00 380975125502.00 2009 34 34 34 32 747265470803.00 190399019196.00 2010 36 36 36 32 110249182000.00 138197639000.00 2011 31 31 31 32 170669342000.00 142402558000.00 2012 32 32 32 32 235244723000.00 196087207000.00 Note: (1) Source: Surakarta City Agency of Development Planning and Surakarta Statistics, (2) Renstra is strategic planning, SOP is standard Operating and Procedure, SPM is Minimum Service Standard and Tupoksi is job description.
Mezzo level in the form of system can be measured from local government of work unit called SKPD (Satuan Kerja Perangkat Daerah) in Surakarta city government that already have a strategic planning called Renstra (Rencana Strategis), SOP (Standard Operating and Procedure), Minimum Service Standard called Standard Pelayanan Minimal (SPM) and jo description called Tupoksi (Tugas Pokok dan Fungsi). Since 2012, all SKPDs Units have already had Renstra and Tupoksi. It shows that Surakarta city government has institutional characteristics, namely specificity in authority.
Mezzo level in the form of administration is analyzed using expenditure of goods and services approach. It is undertaken to describe administration that leads to public service because the expenditure of goods, services and capital produce goods, services and capital that are used to serve public. Since 2010, as shown in Table 8 the expenditure of goods, services and capital has increased. It shows that Surakarta city government has institutional characteristic, namely specificity in responsiveness.
[image:8.595.85.509.330.504.2]incentives because they are used for Surakarta city government expenditure. The greater the revenue and fund, the greater the government expenditure.
Tab. 9 Dynamics of Mezzo Level in Surakarta City Government: Fiscal Sustainability 1
Years Local Government Fiscal
PAD DAU DAK DBH Regional Loan
2005 66086575400 218045000000 5500000000 63197827116 1400000000 2006 78637865549 334287000000 16470000000 38242000000 0 2007 89430977982 374500999992 25900400000 50878370323 7500000000 2008 102909501970 420911721000 31007000000 61481691439 72402000000 2009 101972318682 435470810000 38765000000 74088717915 32913000000 2010 113946007542 499448133000 29118400000 74490132000 50000000 2011 181096816152 473888738000 34895100000 62541000000 0 2012 231672100429 681813458000 28972180000 44479389343 32441000000 Note: (1) Source: Surakarta Statistics, (2) PAD (Pendapatan Asli Daerah) is the local government own source revenue, DAU (Dana Alokasi Umum) is a general fund allocated by central government for Surakarta city, DAK (Dana Alokasi Khusus) is a special fund allocation by central government for Surakarta City, DBH (Dana Bagi Hasil) is revenue sharing fund between central government and Surakarta city government.
The special allocation fund, DAK, fluctuated since 2010, while the revenue sharing Fund, DBH, and regional loan fluctuated since 2006. Even in 2006 and 2011 there was not a regional loan. Fluctuations of DAK, DBH and regional loan happens because they are allocated by central government based on the Surakarta specialty and the financing requirement. The amount however, still indicates that they are incentives.
Fiscal sustainability of Surakarta city local government ensure that the Surakarta local government fiscal is an incentive. The total revenue from PAD until local loan always increases year to year since 2005. At the same time the the Gross Regional Domestic Product (GRDP) on the basis of 2000 constant prices also continued to increase. It means that Surakarta city government fiscal causes economic increasing. However, since 2009 the domestic investment (PMDN) were less interested in fiscal incentives, so that their investment decreased.
Tab. 10 Dynamics of Mezzo Level in Surakarta City Government: Fiscal Sustainability 2
Local Government Fiscal Sustainability
Macro level of Surakarta city government also corresponds to institutional criteria, namely specificity in responsiveness. It is because the macro level of Surakarta city government in the form of public service accessibility has been prepared two forms. The first form is the number of SKPD established. Since 2006, there were 33 units. The second form is the service provided that consists of education, health, civil administration, local business licensing and permission to use local government asset servicing. All of them show that the macro level has an institutional criterion, namely specificity in responsiveness.
5.
Conclusion and Recommendation
The institutional capacity is a part of the Institutional Economics that focus on the importance of the institution. The institutional capacity can be approached by two standards, namely, the optimal organizational capacity and the institutional criteria. The institutional capacity encourages the institution to provide a good sign to all of the economic agents so that the agents can behave appropriately.
There are three levels of organizational capacity, namely micro, mezzo, and macro levels. The institution criteria capacity consists of expertise, specificity in authority and responsiveness, and incentives. Optimal organizational capacity which fulfills the institutional criteria indicates the institution has a good performance. Overally, the organizational capacity of Surakarta city local government was inoptimal, yet it occupied various institutional criteria. The micro level fulfilled the expertise criterion, the mezzo level filled up the specificity in authority and incentives criteria, and the macro level met the specificity in responsiveness criterion.
Surakarta government should improve the capacity of mezzo and macro levels to optimize its capacity. In addition, strong incentives should be provided as one of the institutional criteria. The improvement is expected to increase not only the aggregate production but also the domestic investment.
The limitation of this research is laid on the using of the organizational level to analyze the institutional criteria and the well-responded institution. The organization level comprehends the organizational capacity but only focuses on the internal orientation. To be closer to the institution criteria and well-responded institution, it needs more comprehensive approach so that the organization is described as focusing on the internal and external orientation. If described comprehensively, then the organization is easy to be analyzed based on the institution criteria and the well-responded institution. Even, the support to the poor people can be analyzed. It is suggested for the future research to use the public sector balanced scorecard approach. The approach can bridge the organizational level to the institution criteria and the well-responded institution. Even, the customer and citizen perspective as one of the perspectives of balanced scorecard can be used to analyze the public sector as a pro-poor institution.
References
[1]
Muttaqien, D. (2008), Reformasi Regulasi dan Kelembagaan Ekonomi Islam.
La_Riba vol 2(1). 9-22.
[2]
Wardhono, A. 2009. Transformasi Kelembagaan Kepemilikan Tanah Desa
Klompangan Kabupaten Jember. J-SEP Vol. 3(2). 1-10.
[3]
Baksh, R and Ahmad E.Y. 2008. Sugarcane Farmers in East Java: Institutional
Arrangement Perspective. Journal of Indonesian Applied Economics Vol 2(1). 43-56.
[4]
Ngumar, S and Ikhsan B.R. 2003. Identifikasi Faktor-faktor dalam Mengembangkan
Model Kelembagaan Investasi Terpadu di Provinsi Jawa Timur. Ekuitas Vol.10(1).
42-62.
[5]
Maflahah, I. 2010. Model Sistem Kelembagaan Pengembangan Industri Talas.
Agrointek Vol. 4(2). 87-99.
[6]
Anantanyu, S. 2011. Kelembagaan Petani: Peran dan Strategi Pengembangan
Kapasitasnya. SEPA Vol. 7(2). 102-109.
Pemerintah Daerah. Pemda Sragen: Sragen.
[8]
Sato, I., Hisaaki M. and Hiroko S. 2000. Organizational Capacity of Executing
Agencies in the Developing Countries Case Studies on Bangladesh, Thailand and
Indonesia. JBIC Review, No. 1. 83-106.
[9]
Plescovic, B, Anders A, William B and Robert C. 2002. Capacity Building in
Economics: Education and Research in Transition Economies. World Bank Police
Research Working Paper Number 2763.
[10]
Yuswijaya. 2008. Analisis Pengembangan Kapasitas Organisasi Kantor Satuan Polisi
Pamong Praja Kabupaten Lahat. Jurnal Ilmu Administrasi, Vol IV(1). 85–99.
[11]
Riyardi, A. and Widojono. 2011. Analisis Efisiensi, Efektifitas dan
Responsibilitas Sumber Daya Manusia Pemerintah Daerah Sragen. Jejak. Vol 4(2).
91–101.
[12]
Riyardi, A, Widojono and Muzakar I. 2013. Analysis of the Sragen Local Government
Organizational Capacity. Asean Journal of Economics, Management and Accounting
Vol 1(2). 1-10.
[13]
Johanson, I. 1968. Production Functions and the Concept of Capacity, Collection
Economie et Mathematique et Econometrie, 2. 46–72
[14]
Berndt, E and J. Morrison. 1981. Capacity Utilization Measures: Underlying
Economic Theory and an Alternative Approach. American Economic Review, 71,
1981. 48–52.
[15]
Petrofić, D. and Zoran S. 2009.
Methodological Position(s) of Institutional
Economics. Economics and Organization Vol 6(2). 105–114.
[16]
Hodgson, G.M. 1998. The Approach of Institutional Economics. Journal of
Economic Literature Volume XXXVI, March 1998. 166–192.
[17]
Santosa, P.B. 2008. “Relevansi dan Aplikasi Aliran Ekonomi Kelembagaan”
Jurnal Ekonomi Pembangunan Vol 9 (1). 46–60.
[18]
Pujiyono (2006). Struktur Organisasi Birokrasi Daerah yang Ideal Berdasarkan
Peraturan Pemerintah (PP) Nomor 8 Tahun 2003 Tentang Pedoman Organisasi
Perangkat Daerah. Yustisia Edisi Nomor 69. 44-54.
[19]
Rutherford, M. 2001. Institutional Economics: Then and Now. Journal of Economics