EXPLORING COMMUNITY ASSEMBLY OF
FRESHWATER SHRIMPS (GENERA
CARIDINA
AND
MACROBRACHIUM
) BASED ON PHYLOGENETIC
COMMUNITY STRUCTURE IN EAST JAVA AND BALI
PROVINCES
RENA TRI HERNAWATI
GRADUATE SCHOOL
BOGOR AGRICULTURAL UNIVERSITY BOGOR
STATEMENT LETTER
This thesis entitledExploring Community Assembly of freshwater Shrimps (GeneraCaridina and Macrobrachium) Based on Phylogenetic Community Structure in East Java and Bali Provincesis really my work under the directionsof supervisor committee and has not previously been submitted to any other educational institution. To the best of my knowledge, this thesis contains no material from any other source, except where due reference is made.
I hereby assign copyright of my written work to the Bogor Agricultural University.
SUMMARY
RENA TRI HERNAWATI. Exploring Community Assembly of Freshwater Shrimps (Genera Caridina and Macrobrachium) Based on Phylogenetic Community Structure in East Java and Bali Provinces. Supervised by BAMBANG SURYOBROTO, NICOLAS HUBERT, DAISY WOWOR.
Exploring Community Assembly through phylogenetic community structure is a new approach to investigate how colonization process happens. The utility of DNA barcoding to study community assembly has been used in varieties flora and fauna. So far, there is no study about community assembly of freshwater shrimps based on COI (Cytochrome Oxidase Subunit I Gene) from Java and Bali Provinces. The aims of this study are to explore the diversity of the freshwater shrimp families Atyidae and Palaemonidae based on DNA barcoding, and explore the dynamics of community assembly through community phylogenetic structure. This research was conducted at twenty sites; altitude, longitude and ecological information was also recorded. The samples wereoriginated from two freshwater shrimpgenera, i.e. Caridina and Macrobrachium.
An ultrametric tree shows that Caridina and Macrobrachium from East Java and Bali Provinces share a MRCA at 16.33 Ma and 13.74Ma respectively. Cryptic diversity occurs in both landlock (M. pilimanus) and amphidromous species (C. cf. brachidactyla, C. cf. papuana, and C. cf. gracilipes). The mean genetic distance within all samples is high 4.4%, and it is caused by the high genetic distances among BIN inside morpho-species. Thus, one species can result in several BINs or molecular lineages.
Distributions of species richness and phylogenetic diversity in this study are heterogeneous and they show that altitude become barrier for landlock species and conversely for amphidromous. Thus, community assembly of freshwater shrimps is influenced by life history traits, however, community assembly for amphidromous species is generally through neutral process. There is only one site (DW 1416) in Bali Province that has non-neutral pattern with significant p-value = 0. It may be caused by the present of a dam that inhibit the freshwater shrimps to colonize. Randomizing test shows clustered phylogenetic relationships of nine BINs at node 30. For example, the existence of C. cf. brachidactyla sp. 2 in both East Java and Bali Provinces compared to the existence of C. cf. brachidactyla sp. 1 exclusively in Bali. It suggests a fragmentation between East Java and Bali Provinces.The remaining BINs, of 30 BINs, present random phylogenetic relationships.
RINGKASAN
RENA TRI HERNAWATI. MenyelidikiPenyusunanKomunitasUdang Air Tawar (Genus CaridinadanMacrobrachium) BerdasarkanStrukturKomunitasFilogenetik di ProvinsiJawaTimurdan Bali. Dibimbingoleh BAMBANG SURYOBROTO, NICOLAS HUBERT, DAISY WOWOR. gen COI (Cytochrome Oxidase Subunit I Gene) dariProvinsiJawaTimurdan Bali. Tujuandaripenelitianiniadalahuntukmenyelidikikeanekaragamanudang air tawarFamili Atyidae and Palaemonidae berdasarkanDNA barcoding, danmenyelidikidinamikapenyusunankomunitasmelaluistrukturkomunitasfilogeneti k. Penelitianinidilakukanpada 20 lokasi yang mana data-data ketinggian, titikkoordinatdaninformasi-informasiekologi turut dicatat juga. Sampelberasaldaridua genus udang air tawar yang paling banyak spesiesnya, yaituCaridina and Macrobrachium.
Sebuahpohonultrametrikmenunjukkanbahwaspesies yang berasaldari genus Caridina and MacrobrachiumdariProvinsiJawaTimurdan Bali
memilikiMost Recent Common Ancestor (MRCA)
ataunenekmoyangterkiniberumur 16.33 Ma dan 13.74 Ma. Keanekaragamankriptikterjadipadakeduaspesieslandlock (M. pilimanus) danamphidromous (C. cf. brachidactyla, C. cf. papuana, dan C. cf. gracilipes). Rata-rata jarakgenetikdidalamseluruhsampeltinggi 4.4%, dandisebabkan olehjarakgenetik yang tinggidiantaraBarcode Index Number (BIN)dalammorfo-spesies. Sehingga, satuspesiesbisamenghasilkanbeberapaBINataugarisketurunan.
Distribusikekayaan
spesiesdankeanekaragamanpadapenelitianinibersifatheterogendanmenunjukkanba hwaketinggianlokasimenjadisebuahbarrieruntukspesieslandlockdansebaliknyabag iamphidromous. Sehingga, penyusunankomunitasudang air tawardipengaruhiolehciri-cirisejarahhidup,
namunpenyusunankomunitasuntukspesiesamphidromoussecaraumummelalui proses netral.Hanyaadasatulokasi (DW 1416) di Provinsi Bali yang memilikipolatidaknetraldengansignifikansip-value = 0. Hal itumungkindisebabkanolehadanyabendungan yang menghambatudang air tawaruntukmengkolonisasi.
Ujipengacakanmenunjukkanhubungankekerabatanfilogenetikmengelompok
Copyright © 2016 Bogor Agricultural University
All Rights Reserved
It is prohibited to cite all or a part of this thesis without referring to and mentioning the source. Citation is permitted for the purposes of education, research, scientific paper, report, or critism writing only; and it does not defame the name and honour of Bogor Agricultural University
Thesis
Submitted in partial fulfilment of the requirements for a Master Degree
in
Animal Bioscience Major
EXPLORING COMMUNITY ASSEMBLY OF
FRESHWATER SHRIMPS (GENERA
CARIDINA
AND
MACROBRACHIUM
) BASED ON PHYLOGENETIC
COMMUNITY STRUCTURE IN EAST JAVA AND BALI
PROVINCES
GRADUATE SCHOOL
BOGOR AGRICULTURAL UNIVERSITY BOGOR
2016
PREFACE
First of all I would like to thank Allah SWT, for all His guidance and giving while I was preparing, doing andfinishing this Master thesis.This research on Barcoding of Indonesian Crustacea isa partof Barcoding of Indonesian Fishescampaign, a collaboration researchbetween IRD France and Indonesian Institute of Sciences (LIPI). It was conducted from April 2014 to April 2015. The samples were collected from 20 locations in East Java and Bali Provinces.
I would like to express my deep gratitude to my supervisor DrBambangSuryobroto, DrNicolas Hubert and Dr Daisy Wowor for their guidance and suggestions. My grateful goes also to Dr Daisy Wowor, Mr Ujang Nurhaman and MrSopianSauri of LIPI for collecting the specimens and the environmental data which whom this study could not be conducted. I would like to thank the head and the staffsof the Crustacea andthe Genetic Laboratories, Research Center for Biology LIPI, Cibinong for allowing me to work in their laboratories and helping me during my research. I am grateful to my colleagues in Animal Biosciences and WismaShambala. Special thanks to my family and EmkaLuqman for their love and support.
Writing this thesis has been hard but in the process of writing I have learned a lot and I can share my experience with the readers. Hopefully this scientific work will be useful.
CONTENT LIST
LIST OF TABLES vi
LIST OF FIGURES vi
LIST OF APPENDIXES vi
GLOSSARY vii
1 INTRODUCTION 1
Background 1
Objective 2
2 METHOD 2
Time and Sampling Site 2
Genetic Analysis 2
Data Analysis 3
3 RESULTS AND DISCUSSION 5
Results 5
Discussion 11
4 CONCLUSSION AND SUGGESTION 13
Conclussion 13
Suggestion 13
REFERENCES 14
APPENDIXES 17
LIST OF TABLES
1 The Genetic distances between BINs in morpho-species with more than one BIN 5 2 Genetic distances (K2P) within species and genera 7
LIST OF FIGURES
1 Sampling locations in East Java and Bali Provinces 2 2 Neighbor Joining Tree based on K2P distances. The scale is in number of
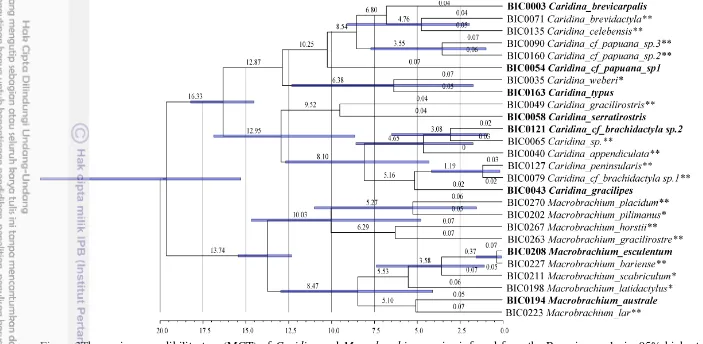
substitutions per site and the values above branches are bootstrap values 6 3 The Maximum Credibility Tree (MCT) of Caridina and Macrobrachium species inferred from the Bayesian analysis. 95% highest posterior density (HPD) in blue bars. Species sampled in both Java and Bali are highlighted in bold, *East
Java, and **Bali
8
4 Phylogenetic β Diversity among communities (a) the sampling location, (b) the cluster of communities, scale is in million years 9 5 Distribution of species richness (SR) and the phylogenetic diversity (PD Faith) across the 20 communities of the present study 9 6 SESMPD and p-values in each community 10 7 SESMNTD and p-values in each community 10 8 Randomization test across node turnover in phylogenetic diversity through
time 10
LIST OF APPENDIXES
1 30 Barcode Index Number (BINs) 18
2 Sampling Locations of 211 specimens4 21
3 Location of four cryptic species 30
4 Cryptic species in C. cf. brachidactyla spp. 1-2 31
5 Cryptic species in C. gracilipes spp. 1-2 32
6 Cryptic species in C. cf. papuana spp. 1-3 33
GLOSSARY
acquisition, storage, analysis and publication of DNA barcode recordsCytochrome Oxidase Subunit I (COI)
: A gene of mtDNA that designed as a barcode marker for metazoan
Markov Chain Monte Carlo (MCMC)
: A technique for estimating by simulation of random processes in a stationary distribution and generally useful for the evaluation of posterior distributions in complex Bayesian models organisms in a group are directly descended Operational Taxonomy Unit
Standardized Effect Size of MPD (SESMPD)
: The difference between phylogenetic distances in the observed communities vs. null communities of MPD generated with some randomization method
Standardized Effect Size of MNTD (SESMNTD)
3
Ultrametric tree : Considering the distances from the root to every branch tip are equal
UPGMA :The simplest phylogenetic methodassumesthat sequences evolve at the same rate and the distance between two clusters is simply defined as the mean of the distances between speciesin the two clusters.
1
INTRODUCTION
Background
According to the geological history of the archipelago, patterns of species distribution in Indonesia result from an intricate alternate of dispersal and vicariance eventsince the late Mioceneas a consequence of major fluctuations of islands connectivity (Lohman et al. 2011).Availability of ecological resources and connectivity among island play a major role during the assembly of species in ecological community and speciation.Community assembly in insular environments is one of the field of research that determine how the processesof colonization, habitat filtering, competitive interaction and speciation contribute to the establishment of ecological communities(Emerson and Gillespie 2008). The topography of East Java and Bali Provinces comprises mountain ranges that can be a barrier among populations. Generally, dispersal between the mainland and the islands of the Sunda Shelf has been enabled by sea level fluctuations, in particular sea level low stands, during the Pleistocene (Lohman et al. 2011; Voris 2000).
Themajority of the members of the freshwater shrimps and prawns of the world belong to the families Atyidae and Palaemonidae with the genera Caridina and Macrobrachium being the most abundant and speciose. For instance, Caridina is present in six biogeographical regions (Oriental, Neotropical, Australasian, Afrotropical, Palaearctic, and Pacific Oceanic Island) and Macrobrachiumis scattered in Palaearctic, Nearctic, Neotropical, Afrotropical, Oriental, Australasian and Pacific Oceanic Island(De Grave et al. 2008). Species from both genera may be divided into two categories according to their life cycle: (1) species that spent their entire life cycle in freshwater (i.e. landlocked species), (2) species that spent a part of their life in marine (i.e. amphidromous species)(Closs et al. 2003; Joy and Death 2013).This diversity of life history traits has consequences on population connectivity and amphidromous species may be expected to have a higher potential of colonization and connectivity due to their marine larval stage(Thuesen et al. 2011).
Morphological identification in freshwater shrimps are often based on morphological characters that have been characterized on adults and dominant males, thus limiting their application to a few specimens. In this context, the use of DNA sequences is very useful to perform identifications as molecular-based identification may be applied to a wider range of samples.DNA barcoding is designated as the use of the COI (Cytochrome Oxidase Subunit I) mitochondrial gene for species identification.DNA barcoding has been applied in a large array of biodiversity research including the detection ofcryptic diversity,estimation of inter or intra population genetic variability, and explore processes such as migration and genetic drift (Hajibabaei et al. 2007).
2
structure, which is a new approach to study community assembly in aquatic (Hubertet al. 2011; Hultgren and Duffy 2012) and terrestrial communities (Cavender-Bares et al. 2004). MPD (Mean Phylogenetic Distance) and MNTD (Mean Nearest Taxon Distance) are the common metrics to present the pattern of community assembly (Webb et al. 2002). Boyle and Adamowick (2015)evidenced that phylogenetic trees based on COI sequences provided similar estimates of phylogenetic community structure compared to phylogenetic treesderived from multiple genes.
Objectives
The objectives of this study are: (1) to explore the diversity of the freshwater shrimp Genera Caridina and Macrobrachiumin East Java and Bali Provinces based on DNA barcoding, (2) explore the dynamics of community assembly of the East Java and Bali freshwater shrimps through community phylogenetic structure.
2
METHOD
Time and Sampling Site
3
thecodes of specimen collectors, i.e. Daisy Wowor and UjangNurahman. All of the species in a sampling site were recorded as a community and treated as an ecological community in the phylogenetic structure analyses.
Genetic Analysis
A total of 211 specimens belong to both families were sampled and preserved in a 96% ethanol solution. The voucher specimens have been deposited in the Museum ZoologicumBogoriense, Research Centre for Biology, Indonesian Institute of Sciences. Morphological identification was conducted using the identification keys developed byCai (2003)andWowor (2004).Tissues were taken fromabdominal muscle and genomic DNA was extracted usingQiagen kit(www.qiagen.com). A total of 654 base pairs of COI sequences were amplified using primer cocktails including the primers LepF1 5’
-ATTCAACCAATCATAAAGATATTGG-3'and LepR1 5’
-TAAACTTCTGGATGTCCAAAAAATCA-3'(Hebert et al. 2004), the primers LCO-1490 5’GGTCAACAAATCATAAAGATATTGG-3'and HCO21985’ -TAAACTTCAGGGTGACCAAAAAATCA-3'(Folmer et al. 1994), and with the primers M13F (−21)5’-TGTAAAACGACGGCCAGT-3' and M13R (−27)5’ -CAGGAAACAGCTATGAC-3'(Ivanova et al. 2007). Amplifications were conducted as follow: initial denaturation at 98°C for 5 min followed by 30 cycles denaturation at 98°C for 5s, annealing at 56°C for 20s and extension at 72°C for 30s, followed by a final extension step at 72°C for 5 min.DNA barcodes, photographs and collecting data were deposited in the Barcode of Life Datasystem (BOLD) in the project ‘DNA barcoding of freshwater Atyidae and Palaemonidae from East Java and Bali (BICA)’ in the container ‘Barcoding Indonesian Crustaceans’ of the ‘Barcoding Fish (FishBOL) campaign. DNA barcodes were Figure 1Sampling site in East Java (eight sites) and Bali (12 sites) Provinces
4
also deposited in GenBank; accessions number are available through the specimen records in BICA project.
Data Analysis
Sequences were aligned based on Amino-Acid translation as implemented inBOLD system (http://www.boldsystems.org/) and genetic distances were estimated using Kimura two Parameter (K2P) model (Kimura 1980). Genetic distanceswere visualized through a Neighbor Joining (NJ)tree. Barcode Index Number (BIN) diversity was explored using the RESL (Refine Single Linkage) algorithm of lineage delineation implemented in BOLD. Genetic distances within species, genera and families were calculated in BOLD.The genetic distances between BIN within species,as identified with morphological characters, were calculated using K2P distances in MEGA 6.
In order to explore community phylogenetic structure, an ultrametric tree was first inferred in order to account for varying substitution rates among species. The ultrametric tree was computed using a molecular clock analysesin order to estimate the age of the Most Recent Common Ancestor (MRCA) and derived taxa. Selection of substitution model was performed by maximum likelihood using Jmodeltest v3.06 software(Posada and Crandall 1998). There is no reliable fossil age availablefor the genera Caridina and Macrobrachium in the Indonesian archipelago. Several studies (De Bruyn et al. 2005; Jimoh et al. 2013; Page and Hughes 2007)estimated molecular clocks for mitochondrial markers, including COI,amongCaridina and Macrobrachium using fossil calibration and obtained a substitution rateof 1,1 - 1,4% per Ma at COI gene in Caridean shrimps (Knowlton et al. 1993; Knowlton and Weigt 1998). Following this, the mean divergence of each MRCA was estimated using the molecular clock of 1,1 – 1,4% per Ma. Mean divergence to the MRCA of Caridina and Macrobrachium was estimated using MEGA6. The Bayesian analysis was run using these two MRCA age estimates and parameters of the substitution model as inferred using Jmodeltest under a relaxed exponential clock model in BEAST v1.8.2. (Drummond et al. 2006).Yule speciation is a common speciation model(Yule 1924), while the tree model was using UPGMA tree as a starting tree in BEAST. Markov Chain Monte Carlo (MCMC) were run for 1 x 10⁷ generations and with trees sampled every1000 iterations. The best chronograms were combined using TreeAnnotator v1.8.2 using burn-in period 6000 trees to build a consensus tree.Posterior probabilities were derived using TreeAnnotator v1.6 with a confident interval 95% HPD (highest posterior density region). Bayesian tree were visualized using Figtree v1.4.0 (http://tree.bio.ed.ac.uk/).
Several parameters of phylogenetic community structure were calculated using Picante R Package(Kembel et al. 2010)to estimatethe Faith’s Phylogenetic Diversity (PDFaith), the Mean Pairwise Distance (MPD), the Mean Nearest Taxon
Distance (MNTD), the Standardized Effect Size of MPD (SESMPD), the
Standardized Effect Size of MNTD (SESMNTD) and Phylogenetic Beta (β)
5
Mean Phylogenetic Diversity (MPD) considers all taxa to calculate the mean phylogenetic distance between species in a community and the Mean Nearest Taxon Index (MNTD) only considers the nearest taxa to calculate the mean phylogenetic distance. ST is the mean phylogenetic distancebetween species
found in different sites compared with species found within sites, and requires only incidence data (presence/absence of each species in each site). Standardized effect sizes estimates and ST describe the difference between phylogenetic
distances in the observed communities versus null communities generated through randomization. The null hypothesis of random community assembly was tested using two-tailed test with p-value threshold of 2.5% as both tails of the statistical distribution are considered(Legendre and Legendre 1998). In practice, the two-tailed test is designed to test the significant departure of (-) SES values (p.value< 0.025) for clustered community and (+) SES values (p.value< 0.025) for disperse community.The incidence data (presence/absence matrix) within local communities were used for randomizing by nodes the tips of the phylogeny to test for significant departure of the ST, including ΠST> 0 for community phylogenetic
clustering and ΠST< 0 for community phylogenetic overdispersion(Hardy and
Senterre 2007).
3
RESULTS AND DISCUSSION
Results
DNA barcoding
From the 211 specimens, only sixspecimenswere not identified and were labeled as Caridina sp. A total of 22and one unidentified species were identified using morphological characters that resulted in 30 BINs (Barcode Index Numbers) or molecular lineages as delineated following the RESL algorithm in BOLD and further identified as BINs. Figure 2 shows unrooted NJ tree based on COI sequences. In several cases, multiple BIN were observed per species such as in Macrobrachium pilimanus, Caridinacf. papuana, C. cf. brachidactylaand C. gracilipesthat have four, three, two, and two BINs respectively and have a total number of samples of 10, 26, 25, and nine specimens, respectively. These lineages were referred to as M. pilimanus spp.1-4 (in four locations, UN 1, UN 2, UN 4 and UN 10),C. cf. papuana spp.1-3 (from seven sites, i.e. UN 12 (East Java), and UN 14, UN 18, UN 19, UN 20, UN 22, DW 1423 (Bali),C. cf. brachidactyla spp.1-2 (from seven locations, UN6, UN 12, and UN 13 (East Java), and UN 15, UN 18, DW 1416, and DW 1417 (Bali), and C. gracilipes spp.1-2 (from two sites, UN 6 and UN 14, East Java and Bali, respectively).
6
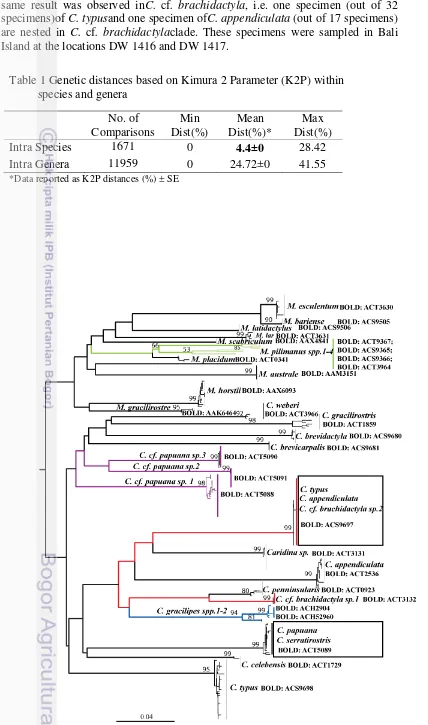
of C. serratirostris. This specimen was sampled in Bali Island at UN 14. The same result was observed inC. cf. brachidactyla, i.e. one specimen (out of 32 specimens)of C. typusand one specimen ofC. appendiculata (out of 17 specimens) are nested in C. cf. brachidactylaclade. These specimens were sampled in Bali Island at the locations DW 1416 and DW 1417.
Figure 2 Neighbor joining tree based on Kimura 2 Parameter (K2P) distances. The Table 1 Genetic distances based on Kimura 2 Parameter (K2P) within
species and genera No. of Comparisons
Min Dist(%)
Mean Dist(%)*
Max Dist(%)
Intra Species 1671 0 4.4±0 28.42
Intra Genera 11959 0 24.72±0 41.55
7
Molecular Dating
Table 2 Genetic distances between Barcode Index Numbers (BIN) in morpho-species with more than one BIN
Between BIN (barcode index number) Distances Std. Err. C. cf. brachidactyla sp. 1 C. cf. brachidactyla sp. 2 0.193 0.041 C. gracilipes sp. 1 C. gracilipes sp. 2 0.040 0.016 C. cf. papuana sp. 1 C. cf. papuana sp. 2 0.162 0.033 C. cf. papuana sp. 1 C. cf. papuana sp. 3 0.162 0.035 C. cf. papuana sp. 2 C. cf. papuana sp. 3 0.126 0.031 M. pilimanus sp. 1 M. pilimanus sp. 2 0.053 0.019 M. pilimanus sp. 1 M. pilimanus sp. 3 0.060 0.021 M. pilimanus sp. 1 M. pilimanus sp. 4 0.077 0.022 M. pilimanus sp. 2 M. pilimanus sp. 3 0.046 0.018 M. pilimanus sp. 2 M. pilimanus sp. 4 0.079 0.023 M. pilimanus sp. 3 M. pilimanus sp. 4 0.062 0.019 Explanation: C. cf. brachidactyla spp. 1-2: (BOLD: ACS9697; BOLD: ACT3132, respectively),
C. gracilipes spp. 1-2 (BOLD: ACH2904; BOLD: ACH2906, respectively), C. cf.
papuana spp. 1-3: (BOLD: ACT5088; BOLD: ACT5091; BOLD: ACT5090,
8
Figure 3Themaximun credibility tree (MCT) of Caridina and Macrobrachiumspecies inferred from the Bayesian analysis. 95% highest posterior density (HPD) in blue bars. Species sampled both in Java and Bali are highlighted in bold, *East Java, and **Bali
Phylogenetic Community Structure
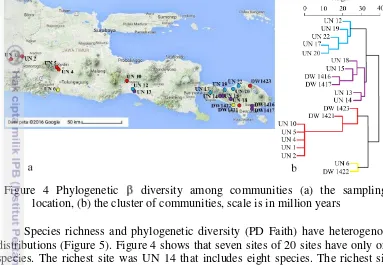
Among communities (sampling sites) species turnover was compared and sampling sites were grouped according to a phyloordination based on species distribution and phylogenetic similarityas in Figure 4A and 4B. The communities are clustered into four groups that consists of five, six, seven, and two sites for each group with average of elevation 126, 122, 265, and 31 m asl respectively.
Species richness and phylogenetic diversity (PD Faith) have heterogenous distributions (Figure 5). Figure 4 shows that seven sites of 20 sites have only one species. The richest site was UN 14 that includes eight species. The richest site also displays the highest phylogenetic diversity (PD Faith = 107.15 Ma) and it is located in Bali at 82 masl. Seven sites (UN 1, UN 2, UN 4, UN 5, UN 10, UN 17 and DW 1421) have only one species and the phylogenetic diversity is homogeneous (PD Faith = 19.57-19.59 Ma).
Among the 20 communities sampled, phylogenetic community structure was explored for sites with more than a single species. Among the 13 sites with at least Figure 4 Phylogenetic diversity among communities (a) the sampling
location, (b) the cluster of communities, scale is in million years
Figure 5 Distribution of species richness (SR) and the phylogenetic diversity (PD Faith) across the 20 communities of the present study.
10
two species, four and nine sites have positive and negative value of Standard Effect Size of MPD (SESMPD), respectively. These sites, however, show no
departure from random aggregation of species and only one site has a species composition significantly different from random with a p-value <2.5% (two-tailed test), i.e. site DW 1416 (Figure 6). The Standard Effect Size of MNTD (SESMNTD)
shows that none of the sites display significant departure from a random pattern of species aggregation (Figure 7).
Testing of null hypothesis were conducted for each node to get ST and
P-value (Figure 7) of randomization test. Randomization test across node shows differentiation ( ST values > 0), however, only the node 30 has clustered
phylogenetic relationships at 7.11 Ma with a highly significant p-value = 0, see Figure 7. Node 30 consists of nine BINs of the total 30 BINs.
Figure 6Standardized Effect Size of MPD (SESMPD)and p-values in each
community
0.41 0.29 0.63 0.64 0.29 0.55 0.28
0.16 0.19 0.02 0.03 0.34 0.22
UN 6 UN 12 UN 13 UN 14 UN 15 UN 18 UN 19 UN 20 UN 22 DW 1416 DW 1417 DW 1422 DW 1423 ses MPD p.value
Figure 7Standardized Effect Size of (SESMNTD)andp-values in each community
-0.76
Figure 8 Randomization test across node turnover in phylogenetic diversity through time
0.75
0.30 0.34 0.39 0.27 0.31 0.54 0.33 0.26
11
Discussion
Clade Ages of Caridina and Macrobrachium
Murphy and Austin (2005) calculated molecular dating among the species of the genus Macrobrachium based on mitochondrial 16S rRNA sequences from Asia, Central/South Africa, and Australia and suggested that the origin of Macrobrachiumoccurred during in the late Oligocene or early Miocene, a result later supported by Short (2000). So far, there is no study of the phylogenetic relationships of the genus Caridina across the distribution range of the genus. The MRCA of the species from the genus Caridina and Macrobrachium sampled in East Java and Bali is dated at 16.33 Ma and 13.74Ma, respectively, during the middle Miocene.These age estimates only document the origin of the MRCA of the species sampled in the present study and don’t represent the age of the genera Caridina and Macrobrachium.
Diversityand Concordance between Morphological and Molecular
Characters
Mean genetic distance across all species are high 4.4% (Table 1), it caused by the large cryptic diversity in the present study. Cryptic diversity is observed in both landlocked and amphidromous species of the genera Caridina and Macrobrachium. This result is consistent with a previous study that evidenced cryptic diversity in Caridina(Page and Hughes 2007). Only one species of Palaemonidaehas more than one BIN, i.e. Macrobrachium pilimanus, a landlocked species that display four molecular lineages (BINs) (yellow branches in Figure 2). For the Atyidae (13 species), three cryptic lineages were detected within the amphidromous species Caridina cf. papuana,C.cf. brachidactylaand C. gracilipesthat have three, two, and two molecular lineages (BINs), respectively (blue, red and pink branches in Figure 2). The cryptic lineagesof M. pilimanus, C. cf. papuana spp.1-3,C. cf. brachidactyla spp.1-2 were sampled in a variety of locations (near coast, middle river or waterfall). Some intraspecific variations were observed in C. cf. papuana spp. 1-3 for the rostrum size, while C. cf. brachidactyla spp.1-2 display small differences in the size of their preanal carina. If confirmed, these morphological variations may represent diagnostic morphological features that have not been previously recognized.
12
Phylogenetic Community Structure
Previous studies of community assembly provided support for either a niche-based or neutral assembly depending on the ecological communities under scrutiny (Kraft et al. 2007; Webb et al. 2002). In the present study, owing to the amphidromous life cycle of the species, dispersal may be expected to happen between East Java and Bali. Nevertheless, a heterogenousdistribution of species and phylogenetic distance was observed in this study. The results show that communities with the highest species richness also display the highest phylogenetic diversity (Figure 4). The highest phylogenetic diversity is observed in site UN 14 at 82 masl. Contrary, the lowest phylogenetic diversity is found in five of the seven sites with a single species consisted of the landlocked species M. pilimanus (Wowor 2004), that never reach downstream. These sites consist of monospecific assemblages of M. pilimanusobserved at 300 m aslon average. By contrast, C. typus was the single species sampled in site UN 17 at 122 m asl, while site DW 1421 was occupied by M. horstii at 203 masl. C. typus and M. horstii are amphidromous speciesthat have wide distribution ranges and can reach high elevation(Cai 2003).For other instance, the third highest value of phylogenetic diversity was observed at site UN 18 (a waterfall) that is located at 500 m aslin Bali and contains five amphidromous species. It is compared with the second highest values of phylogenetic diversity that is site UN 6 (downstream, 33m asl) that contains six amphidromous species.Both sites UN 18 and UN 6 show slight differences in phylogenetic diversity (76.32 and 77.43 Ma, respectively). This suggests that altitude is not a barrier for amphidromous species providing that suitable sites are available.Therefore, community assembly of the freshwater shrimp families Atyidae and Palaemonidae is influenced by life history traits. For instance, M. pilimanus has lower fecundity (large egg size) and recruitment by contrast with amphidromous species (Wowor et al. 2009). Wowor (2016, personal communication) gave a statement that M. pilimanuscan be found with other amphidromous shrimps of family Atyidae (for instance, Atyopsismoluccensis (De Haan, 1849) in Cisadane River, West Java). When the amphidromous shrimp live in brackish-water, they cannot go back to the upper stream due to water pollution. It can influence the monospecific assemblages of freshwater shrimp in the upper stretch of a river.
Based on the SESMPD values, only one site is not random, i.e. DW 1416
(phylogenetic clustering, p-value < 2.5%, two tailed test) (see Table 2), while according to SESMNTD values, phylogenetic community structure is not departing
from random pattern (random dispersion). This result suggests that community assembly among amphidromous species is influenced by random processes and neutral assembly. This is not unexpected considering the high variability of dispersal and recruitment for amphidromous species. This may implies that for amphidromous species, all the sites explored during the present study are ecologically equivalent and the species has equivalent ability to colonize them (Hubbell 2001). Site DW 1416, however, suggests that non-neutral mechanisms may be acting in given conditions and resulting in the aggregation of closely related species in some cases. It may be caused by a dam which is situated in upper of site of DW 1416. This site is a coastal area nearby mouth of the river.
13
using randomization test across the phylogeny shows that only node 30 displays a significant departure of ST value. The value is not random as expected but shows
cluster relationships instead(p-value <0.001). This result suggests that nine BINs on node 30 are more closely related than expected. It may be caused by fragmentation or habitat differentiation. The four BINs on node 30are found in both East Java and Bali, while five BINs are found only in Bali. For example, C. cf. brachidactyla sp.2 was found in both East Java and Bali, whereas C. cf. brachidactyla sp.1 only found in Bali. It suggests that the presence of fragmentation between the two islands has been influencing the diversification of some taxa within this clade. The other nodes across the tree display have no significant departure from expected at random.
4
CONCLUSSION AND SUGGESTION
Conclusion
DNA barcoding revealed a substantial amount of cryptic diversity such as observed in M. pilimanus spp.1-4, C. cf. brachidactyla spp.1-2, C. gracilipes spp.1-2, and C. cf. papuana spp.1-3. Cryptic lineages display high genetic distances. Besides that, DNA barcoding also show introgression phenomenon inside C. cf. brachidactyla sp.2 and C. serratirostris clades. Community phylogenetic structure gives important information about the dynamics of community assembly among freshwater shrimps in Java and Bali Provinces. Molecular dating of the freshwater shrimps from East Java and Bali suggests that the Most Recent Common Ancestor of the species sampled during this study happened at 16.33 Ma, for Caridina and Macrobrachium at13.74 Ma. Community assembly of freshwater shrimps seems to happen mainly through neutral assembly processes and is dominated by random phylogenetic structure. Only one site, DW 1416, is not random. The pattern of random dispersion in our study may be caused by life history traits such as amphidromy. Major clades showed random phylogenetic relationships, however,one node displayed a pattern of phylogenetic species. It indicates that fragmentation happen between some populations in East Java and Bali.
Suggestion
14
REFERENCES
Boyle EE, Adamowick SJ. 2015. Community phylogenetics: assessing tree reconstruction methods and the utility of DNA barcodes. PLoS ONE 6(10):1-18.
Cai Y. 2003. Systematic of freshwater shrimps of the Family Atyidae De Haan, 1849 (Crustacea: Decapoda: Caridea: Palaemonidae) of East and Southeast Asia [Dissertation]. Singapore (SG): Nat Univ Singapore.
Cavender-Bares J, Ackerly DD, Baum DA, Bazzaz FA. 2004. Phylogenetic overdispersion in Floridian Oak communities. Amer Nat. 163(6):823-842. Closs GP, Smith M, Barry B, Markwitz A. 2003. Non‐diadromous recruitment in
coastal populations of common bully (Gobiomorphus cotidianus). New Zeal. J. Mar. Fresh. 37(2):301-313.
De Bruyn M, Nugroho E, Hossain MM, Wilson J, Mather P. 2005. Phylogeographic evidence for the existence of an ancient biogeographic barrier: the Isthmus of Kra Seaway. Hered. 94:370-378.
De Grave S, Cai Y, Anker A. 2008. Global diversity of shrimps (Crustacea: Decapoda: Caridea) in freshwater. Hydrobiologia 595:287–293.
Drummond AJ, Ho SYW, Phillips MJ, Rambaut A. 2006. Relaxed phylogenetics and dating with confidence. PloS Biol. 4(5):0699-0710.
Eastman JM, Paine CE, Hardy OJ. 2011. SpacodiR: Structuring of phylogenetic diversity in ecological communities. Bioinform. 27(17):2437-8.
Emerson BC, Gillespie RG. 2008. Phylogenetic analysis of community assembly and structure over space and time. Trends Ecol Evol. 23(11):619-631. Folmer, Black M, Hoeh W, Lutz R, Vrijenhoek R. 1994. DNA primers for
amplification of mitochondrial cytochrome c oxidase subunit I from diverse metazoan invertebrates. Mol Mar Biol Biotechnol. 3(5):294-299. Hajibabaei M, Singer GA, Hebert PD, Hickey DA. 2007. DNA barcoding: how it
complements taxonomy, molecular phylogenetics and population genetics. Trends Genet. 23(4):167-72.
Hardy OJ, Senterre B. 2007. Characterizing the phylogenetic structure of communities by an additive partitioning of phylogenetic diversity. J. Ecol. 95:493-506.
Hebert PDN, Penton EH, Burns JM, Janzen DH, Hallwachs W. 2004. Ten species in one: DNA barcoding reveals cryptic species in the neotropical skipper butterfly Astraptes fulgerator. PNAS. 101(41):14812-14817.
Hubbell SP. 2001. The unified neutral theory of biodiversity and biogeography. New Jersey (US): Princeton Univ Pr.
Hubert N, Paradis E, Bruggemann H, Planes S. 2011. Community assembly and diversification in Indo-Pacific coral reef fishes. Open Access:229-277. Hultgren KM, Duffy JE. 2012. Phylogenetic community ecology and the role of
social dominance in sponge-dwelling shrimp. Ecol Lett. 1-10.
Ivanova NV, Zemlak TS, Hanner RH, Hebert PDN. 2007. Universal primer cocktails for fish DNA barcoding. Mol Ecol Notes. 7(4):544-548.
15
and morphological classification of Macrobrachium prawns from Southern Nigeria: Cryptic freshwater species and brackish water morphotypes. Aquacult. 410-411:25-31.
Joy MK, Death RG. 2013. Freshwater biodiversity. In:Dymond JR, editor. Ecosystem services in New Zealand – conditions and trends. Lincoln, New Zealand Manaaki Whenua Press. substitutions through comparative studies of nucleotide sequences. J Mol Evol. 16:111-120.
Knowlton N, Weight LA, Solorzano LA, Mills DK, Bermingham E. 1993. Divergence of proteins, mitochondrial DNA and reproductive compatibility across the Isthimus of Panama. Sci. 260(5114):1629-1632. Knowlton N, Weigt LA. 1998. New dates and new rates for divergence across the
Isthimus of Panama. Roc R Soc Land B. 265:2257-2263.
Kraft NJB, Cornwell WK, Webb CO, Ackerly DD. 2007. Trait evolution, community assembly, and the phylogenetic structure of ecological communities. Amer Nat. 170(2):271-283.
Legendre P, Legendre L. 1998. Numerical ecology. Amsterdam (AN): Elsevier Sci.
Liu M-Y, Cai Y-X, Tzeng C-S. 2007. Molecular systematics of the freshwater prawn genus Macrobrachium Bate, 1868 (Crustacea: Decapoda: Palaemonidae) inferred from mtDNA sequences, with emphasis on East Asian species. Zoological Studies 46(3):272-289.
Lohman DJ, de Bruyn M, Page T, von Rintelen K, Hall R, Ng PKL, Shih H-T, Carvalho GR, von Rintelen T. 2011. Biogeography of the Indo-Australian archipelago. Annu Rev Ecol Evol Syst. 42(1):205-226.
Murphy NP, Austin CM. 2005. Phylogenetic relationships of the globally distributed freshwater prawn genus (Crustacea: Decapoda: Palaemonidae): biogeography, taxonomy and the convergent evolution of abbreviated larval development. Zool Scr. 34:187–197.
Page TJ, Hughes JM. 2007. Radically different scales of phylogeographic structuring within cryptic species of freshwater shrimp (Atyidae: Caridina). Limnol Oceanogr. 52(3):1055–1066.
Posada D, Crandall KA. 1998. MODELTEST: testing the model of DNA substitution. Bioinform. 14(9):817-818.
Short J. 2000. Systematics and biogeography of Australian Macrobrachium (Crustacea: Decapoda: Palaemonidae) — with descriptions of other new freshwater Decapoda [Dissertation]. Australia (AU): Univ Queensland. Thuesen PA, Ebner BC, Larson H, Keith P, Silcock RM, Prince J, Russell DJ.
16
continental Australian streams, to oceanic islands of the West Pacific. PLoS ONE. 6(10):e26685.
Von Rintelen K, Von Rintelen T, Meixner M, Luter C, Cai Y, Glaubrecht M. 2007. Freshwater shrimp–sponge association from an ancient lake. Biol Lett. 3:262–264.
Voris HK. 2000. Maps of Pleistocene sea levels in Southeast Asia: shorelines, river systems and time durations. J Biogeogr. 27:1153-1167.
Webb CO, Ackerly DD, McPeek MA, Donoghue MJ. 2002. Phylogenies and Community Ecology. Annu Rev Ecol Syst. 33:475–505.
Wowor D. 2004. A systematic revision of the freshwater prawns of the genus Macrobrachium (Crustacea: Decapoda: Caridea: Palaemonidae) of Sundaland [Dissertation]. Singapore (SG): Nat Univ Singapore.
Wowor D, Muthu V, Meier R, Balke M, Cai Y, Ng PKL. 2009. Evolution of life history traits in Asian freshwater prawns of the genus Macrobrachium (Crustacea: Decapoda: Palaemonidae) based on multilocus molecular phylogenetic analysis. Mol Phylogenet Evol. 52:340–350.
17
Appendix 1 30 Barcode Index Number (BINs) No.
Species per BIN Number
examined Habitat
Elevation
(m asl) Locality code Distribution
19
(m asl) Locality code Distribution
Life
1421, DW 1423 (Bali) Indo-West Pacific A 23. M. lar
BOLD:ACT3631 5
Middle
20
(m asl) Locality code Distribution
Life
21
Appendix 2 Sampling location of 211 specimens
No. Sample ID Species Province City Exact site Latitude Longitude
1 BIC-0001 C. brevicarpalis East Java Tulungagung Ngeluh R. 8.279528 111.914306 2 BIC-0002 C. brevicarpalis East Java Tulungagung Ngeluh R. 8.279528 111.914306 3 BIC-0003 C. brevicarpalis East Java Tulungagung Ngeluh R. 8.279528 111.914306 4 BIC-0004 C. gracilipes East Java Tulungagung Ngeluh R. 8.279528 111.914306 5 BIC-0005 C. cf. brachidactyla sp2 East Java Tulungagung Ngeluh R. 8.279528 111.914306 6 BIC-0006 C. gracilipes East Java Tulungagung Ngeluh R. 8.279528 111.914306 7 BIC-0007 C. gracilipes East Java Tulungagung Ngeluh R. 8.279528 111.914306 8 BIC-0008 C. gracilipes East Java Tulungagung Ngeluh R. 8.279528 111.914306 9 BIC-0009 C. cf. brachidactyla sp2 East Java Lumajang Pataman R. 8.272778 113.225806 10 BIC-0010 C. cf. brachidactyla sp2 East Java Lumajang Pataman R. 8.272778 113.225806 11 BIC-0011 C. cf. brachidactyla sp2 East Java Lumajang Pataman R. 8.272778 113.225806 12 BIC-0012 C. cf. brachidactyla sp2 East Java Lumajang Pataman R. 8.272778 113.225806 13 BIC-0013 C. cf. brachidactyla sp2 East Java Lumajang Pataman R. 8.272778 113.225806 14 BIC-0014 C. cf. papuana sp1 East Java Lumajang Pataman R. 8.272778 113.225806 15 BIC-0015 C. cf. papuana sp1 East Java Lumajang Pataman R. 8.272778 113.225806 16 BIC-0016 C. cf. papuana sp1 East Java Lumajang Pataman R. 8.272778 113.225806 17 BIC-0017 C. cf. papuana sp1 East Java Lumajang Pataman R. 8.272778 113.225806
18 BIC-0018 C. typus East Java Lumajang Pataman R. 8.272778 113.225806
19 BIC-0019 C. typus East Java Lumajang Pataman R. 8.272778 113.225806
20 BIC-0020 C. typus East Java Lumajang Pataman R. 8.272778 113.225806
21 BIC-0021 C. typus East Java Lumajang Pataman R. 8.272778 113.225806
22 BIC-0022 C. typus East Java Lumajang Pataman R. 8.272778 113.225806
22
Continue…
No. Sample ID Species Province City Exact site Latitude Longitude
26 BIC-0026 C. cf. brachidactyla sp2 East Java Lumajang Mujur R. 8.221417 113.166667 27 BIC-0027 C. cf. brachidactyla sp2 East Java Lumajang Mujur R. 8.221417 113.166667 28 BIC-0028 C. serratirostris East Java Lumajang Mujur R. 8.221417 113.166667 29 BIC-0029 C. serratirostris East Java Lumajang Mujur R. 8.221417 113.166667 30 BIC-0031 C. serratirostris East Java Lumajang Mujur R. 8.221417 113.166667 31 BIC-0032 C.serratirostris East Java Lumajang Mujur R. 8.221417 113.166667
32 BIC-0033 C. weberi East Java Lumajang Mujur R. 8.221417 113.166667
33 BIC-0034 C. weberi East Java Lumajang Mujur R. 8.221417 113.166667
34 BIC-0035 C. weberi East Java Lumajang Mujur R. 8.221417 113.166667
35 BIC-0036 C. appendiculata Bali Jembrana YehEmbang R. 8.366861 114.752028 36 BIC-0037 C. appendiculata Bali Jembrana YehEmbang R. 8.366861 114.752028 37 BIC-0038 C. appendiculata Bali Jembrana YehEmbang R. 8.366861 114.752028 38 BIC-0039 C.appendiculata Bali Jembrana YehEmbang R. 8.366861 114.752028 39 BIC-0040 C. appendiculata Bali Jembrana YehEmbang R. 8.366861 114.752028
40 BIC-0041 C.gracilipes Bali Jembrana YehEmbang R. 8.366861 114.752028
41 BIC-0042 C. gracilipes Bali Jembrana YehEmbang R. 8.366861 114.752028
42 BIC-0043 C. gracilipes Bali Jembrana YehEmbang R. 8.366861 114.752028
43 BIC-0044 C. gracilipes Bali Jembrana YehEmbang R. 8.366861 114.752028
44 BIC-0045 C.gracilipes Bali Jembrana YehEmbang R. 8.366861 114.752028
23
Continue…
No. Sample ID Species Province City Exact site Latitude Longitude
50 BIC-0051 C. papuana Bali Jembrana YehEmbang R. 8.366861 114.752028
51 BIC-0052 C. cf. papuana sp1 Bali Jembrana YehEmbang R. 8.366861 114.752028 52 BIC-0053 C. cf. papuana sp1 Bali Jembrana YehEmbang R. 8.366861 114.752028 53 BIC-0054 C.cf. papuana sp1 Bali Jembrana YehEmbang R. 8.366861 114.752028 54 BIC-0055 C. serratirostris Bali Jembrana YehEmbang R. 8.366861 114.752028 55 BIC-0056 C. serratirostris Bali Jembrana YehEmbang R. 8.366861 114.752028 56 BIC-0057 C. serratirostris Bali Jembrana YehEmbang R. 8.366861 114.752028 57 BIC-0058 C. serratirostris Bali Jembrana YehEmbang R. 8.366861 114.752028 58 BIC-0059 C.serratirostris Bali Jembrana YehEmbang R. 8.366861 114.752028
59 BIC-0060 C. typus Bali Jembrana YehEmbang R. 8.366861 114.752028
60 BIC-0062 C. typus Bali Jembrana YehEmbang R. 8.366861 114.752028
61 BIC-0063 C. typus Bali Jembrana YehEmbang R. 8.366861 114.752028
62 BIC-0064 C. cf. brachidactyla sp2 Bali Jembrana Nusamara R. 8.359639 114.7505
63 BIC-0065 C. sp. Bali Jembrana Nusamara R. 8.359639 114.7505
64 BIC-0066 C. sp. Bali Jembrana Nusamara R. 8.359639 114.7505
65 BIC-0067 C. sp. Bali Jembrana Nusamara R. 8.359639 114.7505
66 BIC-0068 C. sp. Bali Jembrana Nusamara R. 8.359639 114.7505
67 BIC-0069 C. brevidactyla Bali Jembrana Nusamara R. 8.359639 114.7505
68 BIC-0070 C. brevidactyla Bali Jembrana Nusamara R. 8.359639 114.7505
69 BIC-0071 C. brevidactyla Bali Jembrana Nusamara R. 8.359639 114.7505
70 BIC-0072 C. typus Bali Jembrana Inlet of Bekel Dam 8.283167 114.606528
71 BIC-0073 C. typus Bali Jembrana Inlet of Bekel Dam 8.283167 114.606528
72 BIC-0074 C. typus Bali Jembrana Inlet of Bekel Dam 8.283167 114.606528
24
Continue…
No. Sample ID Species Province City Exact site Latitude Longitude
74 BIC-0076 C. typus Bali Jembrana Inlet of Bekel Dam 8.283167 114.606528
75 BIC-0077 C. cf. brachidactyla sp1 Bali Jembrana JuwukManisWaterfall 8.388889 114.906028 76 BIC-0078 C. cf. brachidactyla sp1 Bali Jembrana JuwukManisWaterfall 8.388889 114.906028 77 BIC-0079 C. cf. brachidactyla sp1 Bali Jembrana JuwukManisWaterfall 8.388889 114.906028 78 BIC-0080 C. cf. brachidactyla sp1 Bali Jembrana JuwukManisWaterfall 8.388889 114.906028 79 BIC-0081 C.cf. papuana sp1 Bali Jembrana JuwukManisWaterfall 8.388889 114.906028 80 BIC-0082 C. cf. papuana sp1 Bali Jembrana JuwukManis Waterfall 8.388889 114.906028 81 BIC-0083 C. cf. papuana sp1 Bali Jembrana JuwukManis Waterfall 8.388889 114.906028 82 BIC-0084 C. cf. papuana sp1 Bali Jembrana JuwukManis Waterfall 8.388889 114.906028
83 BIC-0085 C. sp. Bali Jembrana JuwukManisWatefall 8.388889 114.906028
84 BIC-0086 C. sp. Bali Jembrana JuwukManis Waterfall 8.388889 114.906028
85 BIC-0087 C. typus Bali Jembrana JuwukManis Waterfall 8.388889 114.906028 86 BIC-0088 C. typus Bali Jembrana JuwukManis Waterfall 8.388889 114.906028 87 BIC-0090 C. cf. papuana sp3 Bali Buleleng TukadBanyuraras R. 8.224 114.895583 88 BIC-0091 C. cf. papuana sp3 Bali Buleleng TukadBanyuraras R. 8.224 114.895583 89 BIC-0092 C. cf. papuana sp3 Bali Buleleng TukadBanyuraras R. 8.224 114.895583 90 BIC-0093 C. cf. papuana sp3 Bali Buleleng TukadBanyuraras R. 8.224 114.895583 91 BIC-0094 C. peninsularis Bali Buleleng TukadBanyuraras R. 8.224 114.895583
92 BIC-0095 C. typus Bali Buleleng TukadBanyuraras R. 8.224 114.895583
93 BIC-0096 C. typus Bali Buleleng TukadBanyuraras R. 8.224 114.895583
94 BIC-0097 C.typus Bali Buleleng TukadBanyuraras R. 8.224 114.895583
95 BIC-0098 C. typus Bali Buleleng TukadBanyuraras R. 8.224 114.895583
25
Continue…
No. Sample ID Species Province City Exact site Latitude Longitude
26
Continue…
No. Sample ID Species Province City Exact site Latitude Longitude
27
Continue…
No. Sample ID Species Province City Exact site Latitude Longitude
146 BIC-0155 C. brevicarpalis Bali Tabanan TukadBalian R. 8.498611 114.967639 147 BIC-0156 C. brevicarpalis Bali Tabanan TukadBalian R. 8.498611 114.967639 148 BIC-0157 C. cf. papuana sp2 Bali Buleleng YehMampeh Waterfall 8.153556 115.360278 149 BIC-0158 C. cf. papuana sp3 Bali Buleleng YehMampeh Waterfall 8.153556 115.360278 150 BIC-0159 C. cf. papuana sp2 Bali Buleleng YehMampeh Waterfall 8.153556 115.360278 151 BIC-0160 C. cf. papuana sp2 Bali Buleleng YehMampeh Waterfall 8.153556 115.360278
152 BIC-0161 C. typus Bali Buleleng YehMampeh Waterfall 8.153556 115.360278
153 BIC-0162 C. typus Bali Buleleng YehMampeh Waterfall 8.153556 115.360278
154 BIC-0163 C. typus Bali Buleleng YehMampeh Waterfall 8.153556 115.360278
155 BIC-0164 C. typus Bali Buleleng YehMampeh Waterfall 8.153556 115.360278
156 BIC-0165 C. typus Bali Buleleng YehMampeh Waterfall 8.153556 115.360278
157 BIC-0169 M. pilimanus Central Java KarangAnyar Samin R. 7.654389 111.081444 158 BIC-0170 M. pilimanus Central Java KarangAnyar Samin R. 7.654389 111.081444
159 BIC-0175 M. pilimanus East Java Magetan Tinil R. 7.587967 111.315275
160 BIC-0181 M. pilimanus East Java Kediri Bruni R. 7.914833 111.950028
161 BIC-0184 M. pilimanus East Java Kediri Bruni R. 7.914833 111.950028
162 BIC-0186 M. pilimanus East Java Kediri Bruni R. 7.892611 111.903333
163 BIC-0188 M. pilimanus East Java Kediri Bruni R. 7.892611 111.903333
28
Continue…
No. Sample ID Species Province City Exact site Latitude Longitude
170 BIC-0197 M. esculentum East Java Tulungagung Ngeluh R. 8.279528 111.914306 171 BIC-0198 M. latidactylus East Java Tulungagung Ngeluh R. 8.279528 111.914306
172 BIC-0202 M. pilimanus East Java Lumajang Bicoro R. 8.279528 111.914306
173 BIC-0203 M. pilimanus East Java Lumajang Bicoro R. 8.279528 111.914306
174 BIC-0206 M. pilimanus East Java Lumajang Bicoro R. 8.279528 111.914306
175 BIC-0207 M. esculentum East Java Lumajang Mujur R. 8.221417 113.166694
176 BIC-0208 M. esculentum East Java Lumajang Mujur R. 8.221417 113.166694
177 BIC-0209 M. esculentum East Java Lumajang Mujur R. 8.221417 113.166694
178 BIC-0210 M. esculentum East Java Lumajang Mujur R. 8.221417 113.166694
179 BIC-0211 M. scabriculum East Java Lumajang Mujur R. 8.221417 113.166694
180 BIC-0221 M. lar Bali Jembrana YehEmbang R. 8.366861 114.752028
181 BIC-0222 M. lar Bali Jembrana YehEmbang R. 8.366861 114.752028
182 BIC-0223 M. lar Bali Jembrana YehEmbang R. 8.366861 114.752028
183 BIC-0224 M. lar Bali Jembrana YehEmbang R. 8.366861 114.752028
184 BIC-0225 M. lar Bali Jembrana YehEmbang R. 8.366861 114.752028
185 BIC-0226 M. bariense Bali Jembrana YehEmbang R. 8.366861 114.752028
186 BIC-0227 M. bariense Bali Jembrana YehEmbang R. 8.366861 114.752028
187 BIC-0231 M. horstii Bali Jembrana Nusamara R. 8.359639 114.783833
188 BIC-0232 M. horstii Bali Jembrana Nusamara R. 8.359639 114.783833
189 BIC-0233 M. horstii Bali Jembrana Nusamara R. 8.359639 114.783833
190 BIC-0234 M. horstii Bali Jembrana JuwukManis Waterfall 8.388889 114.906028 191 BIC-0235 M. horstii Bali Jembrana JuwukManis Waterfall 8.388889 114.906028 192 BIC-0236 M. horstii Bali Jembrana JuwukManis Waterfall 8.388889 114.906028
29
Continue…
No. Sample ID Species Province City Exact site Latitude Longitude
194 BIC-0249 M. horstii Bali Tabanan Yeh Ho R. 8.504556 115.075861
195 BIC-0250 M. horstii Bali Tabanan Yeh Ho R. 8.504556 115.075861
196 BIC-0251 M. horstii Bali Tabanan Yeh Ho R. 8.504556 115.075861
197 BIC-0252 M. australe Bali Tabanan TukadBalian R. 8.498611 114,967,639
198 BIC-0253 M. australe Bali Tabanan TukadBalian R. 8.498611 114,967,639
199 BIC-0254 M. australe Bali Tabanan TukadBalian R. 8.498611 114,967,639
200 BIC-0255 M. esculentum Bali Tabanan TukadBalian R. 8.498611 114,967,639
201 BIC-0258 M. esculentum Bali Tabanan TukadBalian R. 8.498611 114,967,639
202 BIC-0259 M. esculentum Bali Tabanan TukadBalian R. 8.498611 114,967,639
203 BIC-0260 M. esculentum Bali Tabanan TukadBalian R. 8.498611 114,967,639
Appendix 3 Locations of four cryptic species
31
32
33
34
35
CURRICULUM VITAE