88
BAB IV
KESIMPULAN DAN SARAN
A.
Kesimpulan
Peneliti telah berhasil mengumpulkan data dari 100 responden
remaja dengan rentang usia 12-20 tahun di beberapa tempat kos di
Yogyakarta, untuk meneliti tentang analisis perbandingan tingkat
kepuasan pengguna internet terhadap
Friendster
dan
di
kalangan remaja. Adapun peneliti mencoba meneliti 100 responden
tersebut dengan membandingkan antara harapan terhadap situs jejaring
sosial
(Gratification Shought), dengan kinerja
Facebook dan
Friendster
(Gratification Obtain).
Harapan dan kinerja yang dibandingkan tersebut meliputi fungsi
situs jejaring sosial sebagai media yaitu meliputi penggunaan media
sebagai media untuk menambah wawasan
(cognition),media untuk
mengisi waktu luang
(stimulation), media pelarian dari masalah yang
sedang dihadapi
(relaxation), media untuk membebaskan emosi
(emotional release),media untuk menjalin relasi dengan teman atau
keluarga
(social utility)
,dan media untuk menciptakan hambatan antara
dirinya sendiri dengan orang lain atau aktivitas yang sedang tidak ingin
dilakukan (withdrawal).
Berdasarkan hasil penelitian yang telah dijabarkan pada bab-bab
89
1.
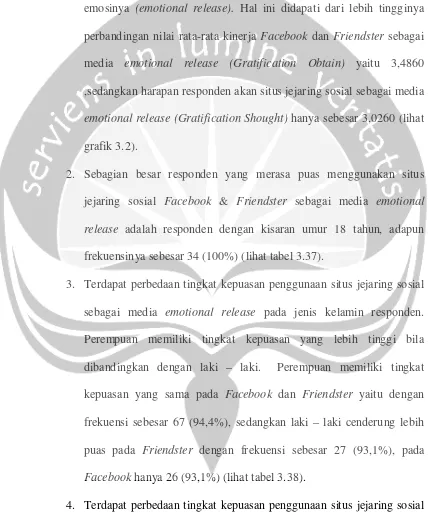
Pada penelitian ini, peneliti mendapati bahwa sebagian besar
responden (96%) merasa puas menggunakan situs jejaring sosial
Facebook maupun
Friendster sebagai media untuk membebaskan
emosinya
(emotional release). Hal ini didapati dari lebih tingginya
perbandingan nilai rata-rata kinerja Facebook
dan Friendster sebagai
media
emotional release (Gratification Obtain) yaitu 3,4860
,sedangkan harapan responden akan situs jejaring sosial sebagai media
emotional release (Gratification Shought) hanya sebesar 3,0260 (lihat
grafik 3.2).
2.
Sebagian besar responden yang merasa puas menggunakan situs
jejaring sosial
&
Friendster sebagai media
emotional
release adalah responden dengan kisaran umur 18 tahun, adapun
frekuensinya sebesar 34 (100%) (lihat tabel 3.37).
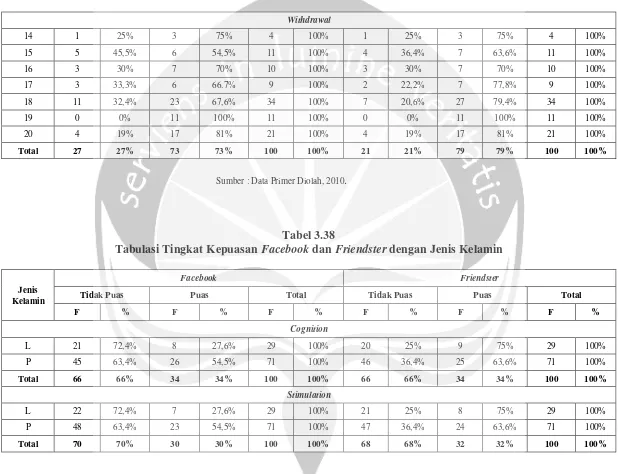
3.
Terdapat perbedaan tingkat kepuasan penggunaan situs jejaring sosial
sebagai media
emotional release pada jenis kelamin responden.
Perempuan memiliki tingkat kepuasan yang lebih tinggi bila
dibandingkan dengan laki – laki. Perempuan memiliki tingkat
kepuasan yang sama pada
Facebook dan
Friendster yaitu dengan
frekuensi sebesar 67 (94,4%), sedangkan laki – laki cenderung lebih
puas pada
Friendster dengan frekuensi sebesar 27 (93,1%), pada
Facebook hanya 26 (93,1%) (lihat tabel 3.38).
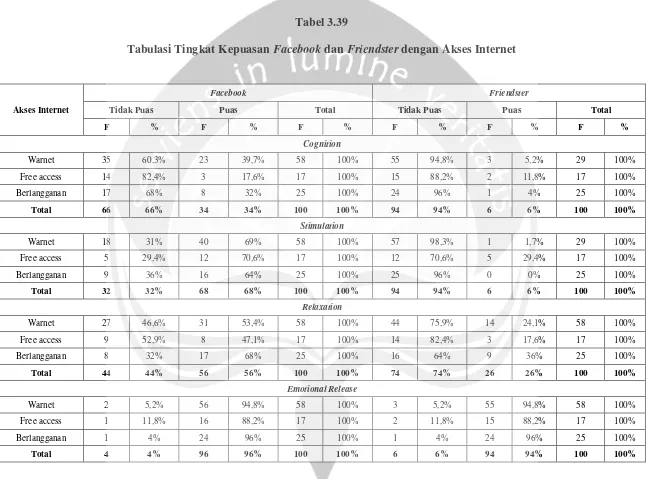
4.
Terdapat perbedaan tingkat kepuasan penggunaan situs jejaring sosial
[image:2.595.86.514.195.719.2]90
situs jejaring sosial melalui warnet,
free access, dan internet
berlangganan. Pengguna warnet memiliki tingkat kepuasan yang
paling tinggi dengan frekuensi 56 (94,8%) pada
Facebook dan 55
(94,8%) pada
Friendster. Sedangkan pengakses
Facebook maupun
Friendster yang menggunakan free access memiliki tingkat kepuasan
terendah yaitu sebesar 16 (88,2%) (lihat tabel 3.39).
B.
SARAN
1.
Saran Akademis
Peneliti menyadari bahwa masih terdapat banyak kekurangan yang
terdapat pada penelitian ini, oleh karena peneliti berharap pada
penelitian berikutnya untuk dapat lebih mengkaji fenomena situs
jejaring sosial, misalnya dengan memperluas lingkup responden tidak
lagi pada remaja saja, karena mengingat situs jejaring sosial yang
bersifat universal dapat dinikmati oleh berbagai kalangan,baik individu
maupun komunitas tertentu.
2.
Saran Praktis
Menilik dari hasil penelitian yang didapati bahwa remaja lebih
cenderung menggunakan situs jejaring sosial sebagai media untuk
membebaskan emosinya
(emotional release), peneliti mengharapkan
pada perusahaan pembuat situs jejaring sosial agar dapat terus
mempertahankan dan mengembangkan berbagai fitur yang dapat
91
mengingat hal tersebut merupakan suatu kecenderungan, peneliti
berharap bahwa situs jejaring sosial tidak hanya membuat penggunanya
merasa puas menggunakan situs jejaring sosial sebagai media emotional
release saja, melainkan membuat sebuah inovasi yang lebih menarik
pada tataran penggunaan media seperti yang diketahui dalam teori uses
and gratification yaitu penggunaan media untuk menambah wawasan
(cognition), untuk mengisi waktu luang
(stimulation), pelarian dari
masalah yang sedang dihadapi
(relaxation), untuk membebaskan emosi
(emotional release), untuk menjalin relasi dengan teman atau keluarga
(social utility)
,dan untuk menciptakan hambatan antara dirinya sendiri
dengan orang lain atau aktivitas yang sedang tidak ingin dilakukan
(withdrawal).
Beberapa fitur yang telah ada memang cukup menunjang untuk
memenuhi kebutuhan penggunanya untuk pemuasan kebutuhan akan
situs jejaring sosial sebagai media. Namun ada beberapa hal yang bisa
ditambahkan seperti halnya, kebutuhan akan informasi yang selalu up to
date
(cognition)
nampaknya sering mendapatkan perhatian tersendiri
bagi para pengguna internet, hal ini dapat dimaksimalkan misalnya
dengan menambahkan fitur
news yang selalu
up to date
pada situs
jejaring sosial atau dengan menyertakan berbagai link situs berita untuk
memudahkan pengguna menikmati fungsi situs jejaring sosial sekaligus
dapat meng - up date informasi. Situs jejaring sosial sebagai situs yang
92
yang satu dengan yang lain melalui dunia maya, dapat pula
meng-improve fitur yang telah ada dengan menambahkan fasilitas
cam-live,
yang memungkinkan pengguna situs jejaring sosial mampu menikmati
fasilitas
video call. Sehingga situs jejaring sosial dapat menjadi sebuah
fenomena media
one stop on-line activities, yang memungkinkan
penggunanya melakukan berbagai aktivitas internet seperti halnya
browsing, blogging,
chatting dan lain sebagainya hanya dalam satu
1
DAFTAR PUSTAKA
Sumber Buku
Arikunto, S. 2006. Prosedur Penelitian Suatu Pendekatan Praktik, Edisi Revisi
VI, Cetakan Ketigabelas. Jakarta: Penerbit Rineka Cipta,
Bharata, A.S. 2008.
Ayo Buat Facebookmu Menarik, Jakarta: PT Elex Media
Komputindo.
Dominick, J. 2009. The Dynamics of Mass Communication, Tenth Edition, New
York: Mc Graw Hill.
Ghozali, I. 2005.
Analisis Multivariate SPSS, Semarang: Badan Penerbit
Universitas Diponegoro.
Goldberg, A.A. dan Larson, C.E. 1985.
Komunikasi Kelompok : Proses-Proses
Diskusi dan Penerapannya, Jakarta: UI-PRESS.
Hendroyono, T. 2009. Facebook, Yogyakarta: PT Bentang Pustaka,
Hair, J.R., Black, W.C., Babin, B.J., Anderson, R.E. and Tatham, R.L. 2006. Data
Multivariate Analysis, 6
thed. Upper Saddle River: Prentice Hall.
Kotler, P. and K. Keller. 2006. Marketing Management, 12
thed. Upper Saddle
River, NJ: Pearson Education, Inc.
Littlejohn, S.W. 1992.
Theories of Human Communication, 4
thed Wadsworth,
Inc.
Mangkulo, Hengky A. 2009.
Membangun Aplikasi Bisnis Online dengan
Friendster, Jakarta: PT.Elek Media Komputindo.
Neuman, W. L. 2000.
Social Research Methods:
Qualitative and Quantitative
Approach, A Pearson Education Company.
Papalia, D.E., Olds, S.W., & Feldman, R.D. 1986.
Human development, 8
thed.
Boston: McGraw-Hill.
Santoso, Singgih .2002 .
Buku Latihan SPSS: Statistik parametrik, Cetakan
Ketiga. Jakarta: PT. Elex Media Komputindo.
2
Sutisna. 2001.
Perilaku Konsumen dan Komunikasi Pemasaran, Bandung: PT.
Remaja Rosdakarya.
Tjiptono, F. 2008. Strategi Pemasaran, Yogyakarta: Andi Offset.
Toffler, A. 1989. Gelombang Ketiga, Jakarta: PT. Pantja Simpati.
Jurnal
Fasta, F. 2007. Motivasi Remaja Dalam Menonton Tayangan Piala Asia 2007.
Pusat Pengembangan Bahan Ajar-UMB, Jakarta.
Fatmawati, I. (2004), “Citra Rumah Sakit, Kepuasan dan Loyalitas
Pelanggan-Studi Pada Rumah Sakit PKU Muhammadiyah Yogyakarta,” Utilitas,
Vol. 12, No. 2, pp. 23-33.
Graham, J.M., Faix, A., and Hartman, L. (2009), “Crashing the Facebook
Party-One Library’s Experience in the Students’ Domain,”
Library Review,
Vol. 58, No. 3, pp. 228-236.
Hadiati, S. (2003), “Analisis Pengaruh Kualitas Pelayanan Terhadap Kepuasan
Nasabah Bank Widyana Malang,” Kompak, No. 8, pp. 298-311.
Harjati, L. (2003), “Analisis Kepuasan Dokter Sebagai Customer
Rumah Sakit X
di Jakarta Pusat,” Manajemen Pemasaran, Vol. 10, No.2, pp.128-147.
Keenan, A. And Shiri, A. (2009), “Sociability and Social Interaction on Social
Networking Websites,” Library Review, Vol. 58, No. 6, pp. 438-450.
Kluemper, D.H. dan Rosen, P.A. (2009), “Future Employment Selection Methods:
Evaluating Social Networking Websites,”
Journal of Managerial
Psychology, Vol. 24, No. 6, pp. 567-580.
3
Pizam, A. and Ellis, T. (1999), “Customer Satisfaction and its Measurement in
Hospitality Enterprises,”
International Journal of Contemporary
Hospitality Management, Vol. 11, No. 7, pp 326-339.
Ratna, D.A., Vienda, D., Florencius, S., dan Santi S. (2004), “Peranan Teknologi
Komunikasi dalam Menciptakan Masyarakat Informasi di Indonesia,”
Jurnal Ilmu Komunikasi, Vol. 1, No. 1, pp.73-86.
Steiner, H. (2009), “Reference Utility of Social Networking Sites: Options and
Functionality,” Library HiTech News, No. 5/6, pp.4-6.
Sumber Internet
No Name (2009) 10 fakta perilaku dan kebiasaan berinternet orang Indonesia.
On-line Journal
(http://id.88db.com/id/Knowledge/Knowledge_Detail.page/Computer_Internet/?ki
d=21916)
akses 7 okt 2009, 15.00
No Name (2009) Sejarah Facebook. On-line Journal
(http://publishedmind.blogspot.com/2008/03/sejarah-facebook.html)
akses 15 Jan
2010, 17.00
No Name (2009) Sejarah Friendster. On-line Journal
(
http://wartawarga.gunadarma.ac.id/tag/httpadeakamamed-blogspot-com200911sejarah-friendster-html/
) akses 15 Jan 2010, 17.00
www.alexa.com
Lain-lain
“Merek Inovatif Yang Menggurita”
94
Reliability
Case Processing Summary
N %
Cases Valid 30 100.0
Excluded(
a) 0 .0
Total 30 100.0
a Listwise deletion based on all variables in the procedure.
Reliability Statistics
Cronbach's
Alpha N of Items
.928 5
Item-Total Statistics
Scale Mean if Item Deleted
Scale Variance if Item Deleted
Corrected Item-Total Correlation
Cronbach's Alpha if Item
Deleted
GS1 15.7333 12.478 .833 .908
GS2 15.8667 13.637 .741 .925
GS3 15.8000 11.752 .934 .887
GS4 15.6000 12.248 .943 .887
GS5 15.4000 14.041 .624 .947
Scale Statistics
Mean Variance Std. Deviation N of Items
95
Reliability
Case Processing Summary
N %
Cases Valid 30 100.0
Excluded(
a) 0 .0
Total 30 100.0
a Listwise deletion based on all variables in the procedure.
Reliability Statistics
Cronbach's
Alpha N of Items
.795 4
Item-Total Statistics
Scale Mean if Item Deleted
Scale Variance if Item Deleted
Corrected Item-Total Correlation
Cronbach's Alpha if Item
Deleted
GS6 11.7667 1.909 .672 .741
GS7 11.8333 1.730 .680 .718
GS8 11.9333 1.375 .533 .828
GS9 11.7667 1.564 .682 .705
Scale Statistics
Mean Variance Std. Deviation N of Items
96
Reliability
Case Processing Summary
N %
Cases Valid 30 100.0
Excluded(
a) 0 .0
Total 30 100.0
a Listwise deletion based on all variables in the procedure.
Reliability Statistics
Cronbach's
Alpha N of Items
.862 5
Item-Total Statistics
Scale Mean if Item Deleted
Scale Variance if Item Deleted
Corrected Item-Total Correlation
Cronbach's Alpha if Item
Deleted
GS10 13.8333 9.109 .561 .861
GS11 14.4000 7.214 .831 .790
GS12 14.2333 7.564 .819 .794
GS13 14.2333 8.116 .690 .831
GS14 13.5667 10.392 .546 .867
Scale Statistics
Mean Variance Std. Deviation N of Items
97
Reliability
Case Processing Summary
N %
Cases Valid 30 100.0
Excluded(
a) 0 .0
Total 30 100.0
a Listwise deletion based on all variables in the procedure.
Reliability Statistics
Cronbach's
Alpha N of Items
.822 5
Item-Total Statistics
Scale Mean if Item Deleted
Scale Variance if Item Deleted
Corrected Item-Total Correlation
Cronbach's Alpha if Item
Deleted
GS15 12.4667 9.016 .697 .762
GS16 12.0000 10.276 .526 .818
GS17 11.9333 11.857 .513 .814
GS18 12.0667 10.340 .714 .761
GS19 12.0667 10.547 .673 .772
Scale Statistics
Mean Variance Std. Deviation N of Items
98
Reliability
Case Processing Summary
N %
Cases Valid 30 100.0
Excluded(
a) 0 .0
Total 30 100.0
a Listwise deletion based on all variables in the procedure.
Reliability Statistics
Cronbach's
Alpha N of Items
.837 5
Item-Total Statistics
Scale Mean if Item Deleted
Scale Variance if Item Deleted
Corrected Item-Total Correlation
Cronbach's Alpha if Item
Deleted
GS20 17.4333 3.013 .663 .798
GS21 17.4667 3.154 .575 .820
GS22 17.5667 2.875 .820 .759
GS23 17.5000 3.017 .677 .794
GS24 17.6333 2.723 .542 .849
Scale Statistics
Mean Variance Std. Deviation N of Items
99
Reliability
Case Processing Summary
N %
Cases Valid 30 100.0
Excluded(
a) 0 .0
Total 30 100.0
a Listwise deletion based on all variables in the procedure.
Reliability Statistics
Cronbach's
Alpha N of Items
.950 4
Item-Total Statistics
Scale Mean if Item Deleted
Scale Variance if Item Deleted
Corrected Item-Total Correlation
Cronbach's Alpha if Item
Deleted
GS25 7.4000 7.972 .871 .941
GS26 7.4667 6.740 .901 .929
GS27 7.3333 6.989 .835 .951
GS28 7.4000 7.283 .943 .917
Scale Statistics
Mean Variance Std. Deviation N of Items
100
Reliability
Case Processing Summary
N %
Cases Valid 30 100.0
Excluded(
a) 0 .0
Total 30 100.0
a Listwise deletion based on all variables in the procedure.
Reliability Statistics
Cronbach's
Alpha N of Items
.874 5
Item-Total Statistics
Scale Mean if Item Deleted
Scale Variance if Item Deleted
Corrected Item-Total Correlation
Cronbach's Alpha if Item
Deleted
GOFB29 15.0667 7.926 .761 .834
GOFB30 15.2667 6.961 .836 .812
GOFB31 14.8667 8.395 .588 .875
GOFB32 14.8000 8.166 .774 .833
GOFB33 14.4000 8.524 .580 .876
Scale Statistics
Mean Variance Std. Deviation N of Items
101
Reliability
Case Processing Summary
N %
Cases Valid 30 100.0
Excluded(
a) 0 .0
Total 30 100.0
a Listwise deletion based on all variables in the procedure.
Reliability Statistics
Cronbach's
Alpha N of Items
.826 4
Item-Total Statistics
Scale Mean if Item Deleted
Scale Variance if Item Deleted
Corrected Item-Total Correlation
Cronbach's Alpha if Item
Deleted
GOFB34 11.3333 2.299 .598 .804
GOFB35 11.6000 2.179 .746 .741
GOFB36 11.7333 1.857 .688 .772
GOFB37 11.5333 2.464 .612 .800
Scale Statistics
Mean Variance Std. Deviation N of Items
102
Reliability
Case Processing Summary
N %
Cases Valid 30 100.0
Excluded(
a) 0 .0
Total 30 100.0
a Listwise deletion based on all variables in the procedure.
Reliability Statistics
Cronbach's
Alpha N of Items
.800 5
Item-Total Statistics
Scale Mean if Item Deleted
Scale Variance if Item Deleted
Corrected Item-Total Correlation
Cronbach's Alpha if Item
Deleted
GOFB38 13.4333 7.633 .426 .809
GOFB39 13.8000 4.855 .751 .701
GOFB40 13.7000 6.010 .566 .767
GOFB41 14.0667 4.892 .674 .736
GOFB42 13.5333 6.671 .589 .767
Scale Statistics
Mean Variance Std. Deviation N of Items
103
Reliability
Case Processing Summary
N %
Cases Valid 30 100.0
Excluded(
a) 0 .0
Total 30 100.0
a Listwise deletion based on all variables in the procedure.
Reliability Statistics
Cronbach's
Alpha N of Items
.793 5
Item-Total Statistics
Scale Mean if Item Deleted
Scale Variance if Item Deleted
Corrected Item-Total Correlation
Cronbach's Alpha if Item
Deleted
GOFB43 13.9000 6.852 .671 .720
GOFB44 13.7667 8.323 .583 .758
GOFB45 14.5000 7.431 .563 .758
GOFB46 13.9000 7.334 .557 .761
GOFB47 13.6667 7.816 .518 .772
Scale Statistics
Mean Variance Std. Deviation N of Items
104
Reliability
Case Processing Summary
N %
Cases Valid 30 100.0
Excluded(
a) 0 .0
Total 30 100.0
a Listwise deletion based on all variables in the procedure.
Reliability Statistics
Cronbach's
Alpha N of Items
.786 5
Item-Total Statistics
Scale Mean if Item Deleted
Scale Variance if Item Deleted
Corrected Item-Total Correlation
Cronbach's Alpha if Item
Deleted
GOFB48 16.0000 4.414 .841 .686
GOFB49 15.8667 4.671 .576 .745
GOFB50 15.9333 4.892 .521 .762
GOFB51 16.1333 4.395 .814 .689
GOFB52 16.6000 3.421 .445 .875
Scale Statistics
Mean Variance Std. Deviation N of Items
105
Reliability
Case Processing Summary
N %
Cases Valid 30 100.0
Excluded(
a) 0 .0
Total 30 100.0
a Listwise deletion based on all variables in the procedure.
Reliability Statistics
Cronbach's
Alpha N of Items
.930 4
Item-Total Statistics
Scale Mean if Item Deleted
Scale Variance if Item Deleted
Corrected Item-Total Correlation
Cronbach's Alpha if Item
Deleted
GOFB53 7.4667 8.533 .824 .913
GOFB54 7.8667 9.085 .767 .931
GOFB55 7.7333 8.892 .863 .900
GOFB56 7.5333 8.809 .896 .889
Scale Statistics
Mean Variance Std. Deviation N of Items
106
Reliability
Case Processing Summary
N %
Cases Valid 30 100.0
Excluded(
a) 0 .0
Total 30 100.0
a Listwise deletion based on all variables in the procedure.
Reliability Statistics
Cronbach's
Alpha N of Items
.822 5
Item-Total Statistics
Scale Mean if Item Deleted
Scale Variance if Item Deleted
Corrected Item-Total Correlation
Cronbach's Alpha if Item
Deleted
GOFR29 11.5333 11.292 .469 .824
GOFR30 11.3333 9.333 .749 .749
GOFR31 11.1333 9.085 .803 .733
GOFR32 11.3333 9.885 .635 .781
GOFR33 10.9333 9.030 .505 .839
Scale Statistics
Mean Variance Std. Deviation N of Items
107
Reliability
Case Processing Summary
N %
Cases Valid 30 100.0
Excluded(
a) 0 .0
Total 30 100.0
a Listwise deletion based on all variables in the procedure.
Reliability Statistics
Cronbach's
Alpha N of Items
.784 4
Item-Total Statistics
Scale Mean if Item Deleted
Scale Variance if Item Deleted
Corrected Item-Total Correlation
Cronbach's Alpha if Item
Deleted
GOFR34 8.3333 3.126 .597 .741
GOFR35 8.4000 4.110 .489 .779
GOFR36 8.2000 3.476 .710 .671
GOFR37 8.0667 3.926 .607 .727
Scale Statistics
Mean Variance Std. Deviation N of Items
108
Reliability
Case Processing Summary
N %
Cases Valid 30 100.0
Excluded(
a) 0 .0
Total 30 100.0
a Listwise deletion based on all variables in the procedure.
Reliability Statistics
Cronbach's
Alpha N of Items
.873 5
Item-Total Statistics
Scale Mean if Item Deleted
Scale Variance if Item Deleted
Corrected Item-Total Correlation
Cronbach's Alpha if Item
Deleted
GOFR38 11.5333 11.016 .672 .853
GOFR39 11.5333 9.361 .923 .787
GOFR40 11.8000 10.372 .782 .826
GOFR41 11.9333 10.409 .688 .849
GOFR42 11.0667 12.064 .463 .899
Scale Statistics
Mean Variance Std. Deviation N of Items
109
Reliability
Case Processing Summary
N %
Cases Valid 30 100.0
Excluded(
a) 0 .0
Total 30 100.0
a Listwise deletion based on all variables in the procedure.
Reliability Statistics
Cronbach's
Alpha N of Items
.909 5
Item-Total Statistics
Scale Mean if Item Deleted
Scale Variance if Item Deleted
Corrected Item-Total Correlation
Cronbach's Alpha if Item
Deleted
GOFR43 10.2000 11.752 .826 .876
GOFR44 10.2333 11.633 .842 .873
GOFR45 10.3667 12.102 .905 .861
GOFR46 10.3667 14.309 .480 .947
GOFR47 10.1667 12.971 .852 .876
Scale Statistics
Mean Variance Std. Deviation N of Items
110
Reliability
Case Processing Summary
N %
Cases Valid 30 100.0
Excluded(
a) 0 .0
Total 30 100.0
a Listwise deletion based on all variables in the procedure.
Reliability Statistics
Cronbach's
Alpha N of Items
.930 5
Item-Total Statistics
Scale Mean if Item Deleted
Scale Variance if Item Deleted
Corrected Item-Total Correlation
Cronbach's Alpha if Item
Deleted
GOFR48 12.7333 12.616 .965 .882
GOFR49 12.6667 12.368 .928 .890
GOFR50 12.8000 13.131 .895 .897
GOFR51 12.8000 14.372 .939 .897
GOFR52 13.2667 16.892 .418 .981
Scale Statistics
Mean Variance Std. Deviation N of Items
111
Reliability
Case Processing Summary
N %
Cases Valid 30 100.0
Excluded(
a) 0 .0
Total 30 100.0
a Listwise deletion based on all variables in the procedure.
Reliability Statistics
Cronbach's
Alpha N of Items
.928 4
Item-Total Statistics
Scale Mean if Item Deleted
Scale Variance if Item Deleted
Corrected Item-Total Correlation
Cronbach's Alpha if Item
Deleted
GOFR53 7.4667 5.913 .868 .893
GOFR54 7.8000 6.924 .682 .952
GOFR55 7.6000 6.179 .870 .893
GOFR56 7.5333 6.051 .915 .878
Scale Statistics
Mean Variance Std. Deviation N of Items
113
Frequencies
Frequency Table
Untuk mendapatkan informasi lengkap mengenai suatu peristiwa yang bisa mempengaruhi Saya (GS)
Frequency Percent Valid Percent
Cumulative Percent
Valid TP 20 20.0 20.0 20.0
P 52 52.0 52.0 72.0
SP 28 28.0 28.0 100.0
Total 100 100.0 100.0
Untuk mendapatkan informasi yang detail mengenai isu-isu dan persoalan penting (GS)
Frequency Percent Valid Percent
Cumulative Percent
Valid TP 13 13.0 13.0 13.0
TT 20 20.0 20.0 33.0
P 46 46.0 46.0 79.0
SP 21 21.0 21.0 100.0
Total 100 100.0 100.0
Untuk memperoleh informasi yang detail tentang suatu hal yang dapat menambah pengetahuan/ wawasan (GS)
Frequency Percent Valid Percent
Cumulative Percent
Valid TP 20 20.0 20.0 20.0
TT 6 6.0 6.0 26.0
P 46 46.0 46.0 72.0
SP 28 28.0 28.0 100.0
114
Untuk memperoleh pandangan atau ide-ide baru terhadap masalah-masalah sosial di sekitar saya (GS)
Frequency Percent Valid Percent
Cumulative Percent
Valid TP 13 13.0 13.0 13.0
TT 7 7.0 7.0 20.0
P 46 46.0 46.0 66.0
SP 34 34.0 34.0 100.0
Total 100 100.0 100.0
Untuk mengikuti perkembangan teknologi (GS)
Frequency Percent Valid Percent
Cumulative Percent
Valid TP 12 12.0 12.0 12.0
P 41 41.0 41.0 53.0
SP 47 47.0 47.0 100.0
Total 100 100.0 100.0
Untuk mengisi waktu luang (GS)
Frequency Percent Valid Percent
Cumulative Percent
Valid TT 7 7.0 7.0 7.0
P 87 87.0 87.0 94.0
SP 6 6.0 6.0 100.0
Total 100 100.0 100.0
Untuk menghilangkan rasa bosan (GS)
Frequency Percent Valid Percent
Cumulative Percent
Valid TT 14 14.0 14.0 14.0
P 80 80.0 80.0 94.0
SP 6 6.0 6.0 100.0
115
Untuk beristirahat sejenak dari kegiatan rutin (misal: les, pekerjaan rumah, dsb) (GS)
Frequency Percent Valid Percent
Cumulative Percent
Valid TP 8 8.0 8.0 8.0
TT 12 12.0 12.0 20.0
P 70 70.0 70.0 90.0
SP 10 10.0 10.0 100.0
Total 100 100.0 100.0
Untuk menghilangkan kepenatan (GS)
Frequency Percent Valid Percent
Cumulative Percent
Valid TT 12 12.0 12.0 12.0
P 74 74.0 74.0 86.0
SP 14 14.0 14.0 100.0
Total 100 100.0 100.0
Untuk mengurangi stress (GS)
Frequency Percent Valid Percent
Cumulative Percent
Valid TP 12 12.0 12.0 12.0
TT 12 12.0 12.0 24.0
P 62 62.0 62.0 86.0
SP 14 14.0 14.0 100.0
Total 100 100.0 100.0
Untuk mengurangi rasa gelisah yang sedang saya alami (GS)
Frequency Percent Valid Percent
Cumulative Percent
Valid STP 3 3.0 3.0 3.0
TP 25 25.0 25.0 28.0
TT 26 26.0 26.0 54.0
P 39 39.0 39.0 93.0
SP 7 7.0 7.0 100.0
116
Untuk dapat melupakan masalah pribadi untuk sesaat (GS)
Frequency Percent Valid Percent
Cumulative Percent
Valid TP 25 25.0 25.0 25.0
TT 19 19.0 19.0 44.0
P 49 49.0 49.0 93.0
SP 7 7.0 7.0 100.0
Total 100 100.0 100.0
Untuk menenangkan pikiran (GS)
Frequency Percent Valid Percent
Cumulative Percent
Valid TP 25 25.0 25.0 25.0
TT 19 19.0 19.0 44.0
P 49 49.0 49.0 93.0
SP 7 7.0 7.0 100.0
Total 100 100.0 100.0
Untuk mencari hiburan (GS)
Frequency Percent Valid Percent
Cumulative Percent
Valid TP 3 3.0 3.0 3.0
TT 6 6.0 6.0 9.0
P 77 77.0 77.0 86.0
SP 14 14.0 14.0 100.0
Total 100 100.0 100.0
Untuk dapat melupakan sejenak tugas yang sedang dilakukan (GS)
Frequency Percent Valid Percent
Cumulative Percent
Valid STP 20 20.0 20.0 20.0
TP 33 33.0 33.0 53.0
TT 6 6.0 6.0 59.0
P 41 41.0 41.0 100.0
117
Untuk menemani kesepian (GS)
Frequency Percent Valid Percent
Cumulative Percent
Valid STP 7 7.0 7.0 7.0
TP 33 33.0 33.0 40.0
TT 6 6.0 6.0 46.0
P 48 48.0 48.0 94.0
SP 6 6.0 6.0 100.0
Total 100 100.0 100.0
Untuk membuat perasaan lebih tenang (GS)
Frequency Percent Valid Percent
Cumulative Percent
Valid TP 27 27.0 27.0 27.0
TT 26 26.0 26.0 53.0
P 47 47.0 47.0 100.0
Total 100 100.0 100.0
Untuk mencurahkan perasaan (GS)
Frequency Percent Valid Percent
Cumulative Percent
Valid TP 41 41.0 41.0 41.0
TT 12 12.0 12.0 53.0
P 47 47.0 47.0 100.0
Total 100 100.0 100.0
Untuk memperoleh hal-hal yang menarik hati (GS)
Frequency Percent Valid Percent
Cumulative Percent
Valid TP 41 41.0 41.0 41.0
TT 12 12.0 12.0 53.0
P 47 47.0 47.0 100.0
118
Untuk berinteraksi dengan keluarga dan teman-teman (GS)
Frequency Percent Valid Percent
Cumulative Percent
Valid P 53 53.0 53.0 53.0
SP 47 47.0 47.0 100.0
Total 100 100.0 100.0
Untuk dapat menjaga hubungan dengan keluarga dan teman-teman lama (GS)
Frequency Percent Valid Percent
Cumulative Percent
Valid P 56 56.0 56.0 56.0
SP 44 44.0 44.0 100.0
Total 100 100.0 100.0
Untuk dapat mencari keluarga atau teman lama yang selama ini jarang berkomunikasi (GS)
Frequency Percent Valid Percent
Cumulative Percent
Valid P 66 66.0 66.0 66.0
SP 34 34.0 34.0 100.0
Total 100 100.0 100.0
Untuk mendapatkan teman baru (GS)
Frequency Percent Valid Percent
Cumulative Percent
Valid P 60 60.0 60.0 60.0
SP 40 40.0 40.0 100.0
Total 100 100.0 100.0
Untuk membangun sebuah komunitas (GS)
Frequency Percent Valid Percent
Cumulative Percent
Valid TT 13 13.0 13.0 13.0
P 47 47.0 47.0 60.0
SP 40 40.0 40.0 100.0
119
Untuk menghindari pertemuan dengan seseorang yang enggan saya jumpai (GS)
Frequency Percent Valid Percent
Cumulative Percent
Valid STP 7 7.0 7.0 7.0
TP 53 53.0 53.0 60.0
TT 26 26.0 26.0 86.0
P 14 14.0 14.0 100.0
Total 100 100.0 100.0
Untuk dapat menghindar dari tugas - tugas yang harus saya kerjakan (GS)
Frequency Percent Valid Percent
Cumulative Percent
Valid STP 13 13.0 13.0 13.0
TP 60 60.0 60.0 73.0
P 27 27.0 27.0 100.0
Total 100 100.0 100.0
Untuk menghindari gangguan dari orang lain (GS)
Frequency Percent Valid Percent
Cumulative Percent
Valid STP 13 13.0 13.0 13.0
TP 47 47.0 47.0 60.0
TT 12 12.0 12.0 72.0
P 28 28.0 28.0 100.0
Total 100 100.0 100.0
Untuk menjaga jarak (menjauh) dari orang yang saya hindari (GS)
Frequency Percent Valid Percent
Cumulative Percent
Valid STP 7 7.0 7.0 7.0
TP 60 60.0 60.0 67.0
TT 12 12.0 12.0 79.0
P 21 21.0 21.0 100.0
120
Frequencies
Frequency Table
Untuk mendapatkan informasi lengkap mengenai suatu peristiwa yang bisa mempengaruhi Saya (FB)
Frequency Percent Valid Percent
Cumulative Percent
Valid TM 14 14.0 14.0 14.0
TT 26 26.0 26.0 40.0
M 53 53.0 53.0 93.0
SM 7 7.0 7.0 100.0
Total 100 100.0 100.0
Untuk mendapatkan informasi lengkap mengenai suatu peristiwa yang bisa mempengaruhi Saya (FB)
Frequency Percent Valid Percent
Cumulative Percent
Valid TM 27 27.0 27.0 27.0
TT 19 19.0 19.0 46.0
M 47 47.0 47.0 93.0
SM 7 7.0 7.0 100.0
Total 100 100.0 100.0
Untuk mendapatkan informasi yang detail mengenai isu-isu dan persoalan penting (FB)
Frequency Percent Valid Percent
Cumulative Percent
Valid TM 14 14.0 14.0 14.0
TT 13 13.0 13.0 27.0
M 60 60.0 60.0 87.0
SM 13 13.0 13.0 100.0
121
Untuk memperoleh informasi yang detail tentang suatu hal yang dapat menambah pengetahuan/ wawasan (FB)
Frequency Percent Valid Percent
Cumulative Percent
Valid TM 14 14.0 14.0 14.0
M 79 79.0 79.0 93.0
SM 7 7.0 7.0 100.0
Total 100 100.0 100.0
Untuk memperoleh pandangan atau ide-ide baru terhadap masalah-masalah sosial di sekitar saya (FB)
Frequency Percent Valid Percent
Cumulative Percent
Valid TM 7 7.0 7.0 7.0
TT 6 6.0 6.0 13.0
M 46 46.0 46.0 59.0
SM 41 41.0 41.0 100.0
Total 100 100.0 100.0
Untuk mengikuti perkembangan teknologi (FB)
Frequency Percent Valid Percent
Cumulative Percent
Valid TT 12 12.0 12.0 12.0
M 67 67.0 67.0 79.0
SM 21 21.0 21.0 100.0
Total 100 100.0 100.0
Untuk mengisi waktu luang (FB)
Frequency Percent Valid Percent
Cumulative Percent
Valid TT 25 25.0 25.0 25.0
M 68 68.0 68.0 93.0
SM 7 7.0 7.0 100.0
122
Untuk menghilangkan rasa bosan (FB)
Frequency Percent Valid Percent
Cumulative Percent
Valid TM 7 7.0 7.0 7.0
TT 24 24.0 24.0 31.0
M 62 62.0 62.0 93.0
SM 7 7.0 7.0 100.0
Total 100 100.0 100.0
Untuk beristirahat sejenak dari kegiatan rutin (misal: les, pekerjaan rumah, dsb) (FB)
Frequency Percent Valid Percent
Cumulative Percent
Valid TT 18 18.0 18.0 18.0
M 75 75.0 75.0 93.0
SM 7 7.0 7.0 100.0
Total 100 100.0 100.0
Untuk menghilangkan kepenatan (FB)
Frequency Percent Valid Percent
Cumulative Percent
Valid TT 30 30.0 30.0 30.0
M 70 70.0 70.0 100.0
Total 100 100.0 100.0
Untuk mengurangi stress (FB)
Frequency Percent Valid Percent
Cumulative Percent
Valid TM 27 27.0 27.0 27.0
TT 19 19.0 19.0 46.0
M 47 47.0 47.0 93.0
SM 7 7.0 7.0 100.0
123
Untuk mengurangi rasa gelisah yang sedang saya alami (FB)
Frequency Percent Valid Percent
Cumulative Percent
Valid TM 20 20.0 20.0 20.0
TT 17 17.0 17.0 37.0
M 63 63.0 63.0 100.0
Total 100 100.0 100.0
Untuk dapat melupakan masalah pribadi untuk sesaat (FB)
Frequency Percent Valid Percent
Cumulative Percent
Valid STM 7 7.0 7.0 7.0
TM 28 28.0 28.0 35.0
TT 18 18.0 18.0 53.0
M 47 47.0 47.0 100.0
Total 100 100.0 100.0
Untuk menenangkan pikiran (FB)
Frequency Percent Valid Percent
Cumulative Percent
Valid TM 6 6.0 6.0 6.0
TT 27 27.0 27.0 33.0
M 67 67.0 67.0 100.0
Total 100 100.0 100.0
Untuk mencari hiburan (FB)
Frequency Percent Valid Percent
Cumulative Percent
Valid STM 7 7.0 7.0 7.0
TM 12 12.0 12.0 19.0
M 81 81.0 81.0 100.0
124
Untuk dapat melupakan sejenak tugas yang sedang dilakukan (FB)
Frequency Percent Valid Percent
Cumulative Percent
Valid TM 12 12.0 12.0 12.0
TT 7 7.0 7.0 19.0
M 81 81.0 81.0 100.0
Total 100 100.0 100.0
Untuk menemani kesepian (FB)
Frequency Percent Valid Percent
Cumulative Percent
Valid TM 47 47.0 47.0 47.0
TT 12 12.0 12.0 59.0
M 41 41.0 41.0 100.0
Total 100 100.0 100.0
Untuk membuat perasaan lebih tenang (FB)
Frequency Percent Valid Percent
Cumulative Percent
Valid TM 27 27.0 27.0 27.0
M 67 67.0 67.0 94.0
SM 6 6.0 6.0 100.0
Total 100 100.0 100.0
Untuk mencurahkan perasaan (FB)
Frequency Percent Valid Percent
Cumulative Percent
Valid TM 18 18.0 18.0 18.0
TT 3 3.0 3.0 21.0
M 67 67.0 67.0 88.0
SM 12 12.0 12.0 100.0
125
Untuk memperoleh hal-hal yang menarik hati (FB)
Frequency Percent Valid Percent
Cumulative Percent
Valid TT 6 6.0 6.0 6.0
M 74 74.0 74.0 80.0
SM 20 20.0 20.0 100.0
Total 100 100.0 100.0
Untuk berinteraksi dengan keluarga dan teman-teman (FB)
Frequency Percent Valid Percent
Cumulative Percent
Valid TT 6 6.0 6.0 6.0
M 60 60.0 60.0 66.0
SM 34 34.0 34.0 100.0
Total 100 100.0 100.0
Untuk dapat menjaga hubungan dengan keluarga dan teman-teman lama (FB)
Frequency Percent Valid Percent
Cumulative Percent
Valid TT 6 6.0 6.0 6.0
M 68 68.0 68.0 74.0
SM 26 26.0 26.0 100.0
Total 100 100.0 100.0
Untuk dapat mencari keluarga atau teman lama yang selama ini jarang berkomunikasi (FB)
Frequency Percent Valid Percent
Cumulative Percent
Valid TT 13 13.0 13.0 13.0
M 74 74.0 74.0 87.0
SM 13 13.0 13.0 100.0
126
Untuk mendapatkan teman baru (FB)
Frequency Percent Valid Percent
Cumulative Percent
Valid STM 7 7.0 7.0 7.0
TM 14 14.0 14.0 21.0
TT 12 12.0 12.0 33.0
M 54 54.0 54.0 87.0
SM 13 13.0 13.0 100.0
Total 100 100.0 100.0
Untuk membangun sebuah komunitas (FB)
Frequency Percent Valid Percent
Cumulative Percent
Valid STM 20 20.0 20.0 20.0
TM 20 20.0 20.0 40.0
TT 26 26.0 26.0 66.0
M 34 34.0 34.0 100.0
Total 100 100.0 100.0
Untuk menghindari pertemuan dengan seseorang yang enggan saya jumpai (FB)
Frequency Percent Valid Percent
Cumulative Percent
Valid STM 27 27.0 27.0 27.0
TM 34 34.0 34.0 61.0
TT 19 19.0 19.0 80.0
M 20 20.0 20.0 100.0
Total 100 100.0 100.0
Untuk dapat menghindar dari tugas - tugas yang harus saya kerjakan (FB)
Frequency Percent Valid Percent
Cumulative Percent
Valid STM 20 20.0 20.0 20.0
TM 34 34.0 34.0 54.0
TT 25 25.0 25.0 79.0
M 21 21.0 21.0 100.0
127
Untuk menghindari gangguan dari orang lain (FB)
Frequency Percent Valid Percent
Cumulative Percent
Valid STM 13 13.0 13.0 13.0
TM 34 34.0 34.0 47.0
TT 26 26.0 26.0 73.0
M 27 27.0 27.0 100.0
128
Frequencies
Frequency Table
Untuk mendapatkan informasi lengkap mengenai suatu peristiwa yang bisa mempengaruhi Saya (FS)
Frequency Percent Valid Percent
Cumulative Percent
Valid STM 7 7.0 7.0 7.0
TM 46 46.0 46.0 53.0
TT 33 33.0 33.0 86.0
M 14 14.0 14.0 100.0
Total 100 100.0 100.0
Untuk mendapatkan informasi yang detail mengenai isu-isu dan persoalan penting (FS)
Frequency Percent Valid Percent
Cumulative Percent
Valid STM 7 7.0 7.0 7.0
TM 39 39.0 39.0 46.0
TT 26 26.0 26.0 72.0
M 28 28.0 28.0 100.0
Total 100 100.0 100.0
Untuk memperoleh informasi yang detail tentang suatu hal yang dapat menambah pengetahuan/ wawasan (FS)
Frequency Percent Valid Percent
Cumulative Percent
Valid STM 7 7.0 7.0 7.0
TM 27 27.0 27.0 34.0
TT 32 32.0 32.0 66.0
M 34 34.0 34.0 100.0
129
Untuk memperoleh pandangan atau ide-ide baru terhadap masalah-masalah sosial di sekitar saya (FS)
Frequency Percent Valid Percent
Cumulative Percent
Valid STM 7 7.0 7.0 7.0
TM 40 40.0 40.0 47.0
TT 25 25.0 25.0 72.0
M 28 28.0 28.0 100.0
Total 100 100.0 100.0
Untuk mengikuti perkembangan teknologi (FS)
Frequency Percent Valid Percent
Cumulative Percent
Valid STM 7 7.0 7.0 7.0
TM 34 34.0 34.0 41.0
TT 19 19.0 19.0 60.0
M 20 20.0 20.0 80.0
SM 20 20.0 20.0 100.0
Total 100 100.0 100.0
Untuk mengisi waktu luang (FS)
Frequency Percent Valid Percent
Cumulative Percent
Valid STM 7 7.0 7.0 7.0
TM 47 47.0 47.0 54.0
TT 19 19.0 19.0 73.0
M 27 27.0 27.0 100.0
Total 100 100.0 100.0
Untuk menghilangkan rasa bosan (FS)
Frequency Percent Valid Percent
Cumulative Percent
Valid TM 54 54.0 54.0 54.0
TT 32 32.0 32.0 86.0
M 14 14.0 14.0 100.0
130
Untuk beristirahat sejenak dari kegiatan rutin (misal: les, pekerjaan rumah, dsb) (FS)
Frequency Percent Valid Percent
Cumulative Percent
Valid TM 40 40.0 40.0 40.0
TT 39 39.0 39.0 79.0
M 21 21.0 21.0 100.0
Total 100 100.0 100.0
Untuk menghilangkan kepenatan (FS)
Frequency Percent Valid Percent
Cumulative Percent
Valid TM 26 26.0 26.0 26.0
TT 53 53.0 53.0 79.0
M 21 21.0 21.0 100.0
Total 100 100.0 100.0
Untuk mengurangi stress (FS)
Frequency Percent Valid Percent
Cumulative Percent
Valid TM 47 47.0 47.0 47.0
TT 13 13.0 13.0 60.0
M 40 40.0 40.0 100.0
Total 100 100.0 100.0
Untuk mengurangi rasa gelisah yang sedang saya alami (FS)
Frequency Percent Valid Percent
Cumulative Percent
Valid STM 7 7.0 7.0 7.0
TM 33 33.0 33.0 40.0
TT 20 20.0 20.0 60.0
M 40 40.0 40.0 100.0
131
Untuk dapat melupakan masalah pribadi untuk sesaat (FS)
Frequency Percent Valid Percent
Cumulative Percent
Valid STM 7 7.0 7.0 7.0
TM 47 47.0 47.0 54.0
TT 20 20.0 20.0 74.0
M 26 26.0 26.0 100.0
Total 100 100.0 100.0
Untuk menenangkan pikiran (FS)
Frequency Percent Valid Percent
Cumulative Percent
Valid STM 14 14.0 14.0 14.0
TM 46 46.0 46.0 60.0
TT 13 13.0 13.0 73.0
M 27 27.0 27.0 100.0
Total 100 100.0 100.0
Untuk mencari hiburan (FS)
Frequency Percent Valid Percent
Cumulative Percent
Valid TM 25 25.0 25.0 25.0
TT 14 14.0 14.0 39.0
M 54 54.0 54.0 93.0
SM 7 7.0 7.0 100.0
Total 100 100.0 100.0
Untuk dapat melupakan sejenak tugas yang sedang dilakukan (FS)
Frequency Percent Valid Percent
Cumulative Percent
Valid STM 13 13.0 13.0 13.0
TM 43 43.0 43.0 56.0
TT 11 11.0 11.0 67.0
M 33 33.0 33.0 100.0
132
Untuk menemani kesepian (FS)
Frequency Percent Valid Percent
Cumulative Percent
Valid STM 13 13.0 13.0 13.0
TM 40 40.0 40.0 53.0
TT 27 27.0 27.0 80.0
M 14 14.0 14.0 94.0
SM 6 6.0 6.0 100.0
Total 100 100.0 100.0
Untuk membuat perasaan lebih tenang (FS)
Frequency Percent Valid Percent
Cumulative Percent
Valid STM 13 13.0 13.0 13.0
TM 47 47.0 47.0 60.0
TT 20 20.0 20.0 80.0
M 20 20.0 20.0 100.0
Total 100 100.0 100.0
Untuk mencurahkan perasaan (FS)
Frequency Percent Valid Percent
Cumulative Percent
Valid STM 20 20.0 20.0 20.0
TM 34 34.0 34.0 54.0
TT 26 26.0 26.0 80.0
M 20 20.0 20.0 100.0
Total 100 100.0 100.0
Untuk memperoleh hal-hal yang menarik hati (FS)
Frequency Percent Valid Percent
Cumulative Percent
Valid STM 6 6.0 6.0 6.0
TM 41 41.0 41.0 47.0
TT 33 33.0 33.0 80.0
M 20 20.0 20.0 100.0
133
Untuk berinteraksi dengan keluarga dan teman-teman (FS)
Frequency Percent Valid Percent
Cumulative Percent
Valid STM 7 7.0 7.0 7.0
TM 19 19.0 19.0 26.0
TT 14 14.0 14.0 40.0
M 53 53.0 53.0 93.0
SM 7 7.0 7.0 100.0
Total 100 100.0 100.0
Untuk dapat menjaga hubungan dengan keluarga dan teman-teman lama (FS)
Frequency Percent Valid Percent
Cumulative Percent
Valid STM 7 7.0 7.0 7.0
TM 19 19.0 19.0 26.0
TT 14 14.0 14.0 40.0
M 46 46.0 46.0 86.0
SM 14 14.0 14.0 100.0
Total 100 100.0 100.0
Untuk dapat mencari keluarga atau teman lama yang selama ini jarang berkomunikasi (FS)
Frequency Percent Valid Percent
Cumulative Percent
Valid STM 7 7.0 7.0 7.0
TM 19 19.0 19.0 26.0
TT 20 20.0 20.0 46.0
M 47 47.0 47.0 93.0
SM 7 7.0 7.0 100.0
134
Untuk mendapatkan teman baru (FS)
Frequency Percent Valid Percent
Cumulative Percent
Valid TM 26 26.0 26.0 26.0
TT 20 20.0 20.0 46.0
M 54 54.0 54.0 100.0
Total 100 100.0 100.0
Untuk membangun sebuah komunitas (FS)
Frequency Percent Valid Percent
Cumulative Percent
Valid STM 7 7.0 7.0 7.0
TM 40 40.0 40.0 47.0
TT 20 20.0 20.0 67.0
M 33 33.0 33.0 100.0
Total 100 100.0 100.0
Untuk menghindari pertemuan dengan seseorang yang enggan saya jumpai (FS)
Frequency Percent Valid Percent
Cumulative Percent
Valid STM 14 14.0 14.0 14.0
TM 26 26.0 26.0 40.0
TT 40 40.0 40.0 80.0
M 20 20.0 20.0 100.0
Total 100 100.0 100.0
Untuk dapat menghindar dari tugas - tugas yang harus saya kerjakan (FS)
Frequency Percent Valid Percent
Cumulative Percent
Valid STM 21 21.0 21.0 21.0
TM 33 33.0 33.0 54.0
TT 39 39.0 39.0 93.0
M 7 7.0 7.0 100.0
135
Untuk menghindari gangguan dari orang lain (FS)
Frequency Percent Valid Percent
Cumulative Percent
Valid STM 14 14.0 14.0 14.0
TM 33 33.0 33.0 47.0
TT 39 39.0 39.0 86.0
M 14 14.0 14.0 100.0
Total 100 100.0 100.0
Untuk menjaga jarak (menjauh) dari orang yang saya hindari (FS)
Frequency Percent Valid Percent
Cumulative Percent
Valid STM 14 14.0 14.0 14.0
TM 26 26.0 26.0 40.0
TT 46 46.0 46.0 86.0
M 14 14.0 14.0 100.0