THE TRADE-EFFECT OF MAXIMUM RESIDUE LIMITS FOR
PESTICIDES ON INDONESIA’S TEA EXPORT
NOVIANA KUS YUNIATI
POSTGRADUATE SCHOOL
BOGOR AGRICULTURAL INSTITUTE BOGOR
STATUTORY DECLARATION
I, Noviana Kus Yuniati, hereby declare that the master thesis entitled “The Trade-Effect of Maximum Residue Limits for Pesticides on Indonesia’s Tea” is my original work under the supervision of Advisory Committee and has not been submitted in any form and to another higher education institution. This thesis is submitted independently without having used any other source or means stated therein. Source of information originated from published and unpublished work are stated in the part of references of this thesis. Herewith, I passed the thesis copyright to Bogor Agricultural University.
Bogor, January 2016
Noviana Kus Yuniati
NOVIANA KUS YUNIATI. Pengaruh Batas Maksimum Residu Pestisida pada Ekspor Teh Indonesia. Dibimbing oleh RINA OKTAVIANI dan STEPHANIE MCWHINNIE.
Teh sebagai salah satu komoditas ekspor unggulan Indonesia dituntut untuk memenuhi persyaratan keamanan pangan dalam perdagangan internasional. Salah satu dari persyaratan tersebut adalah Batas Maksimum Residu (BMR) untuk pestisida. Batas ini bertujuan untuk melindungi kesehatan konsumen dari kandungan berlebih residu pestisida dalam pangan. Namun, BMR dapat menghambat perdagangan internasional karena semakin ketatnya batas maksimum yang ditetapkan dan pemberlakuan regulasi baru oleh negara-negara importir.
Tujuan dari penelitian ini adalah menganalisa pengaruh BMR terhadap ekspor teh Indonesia. Penelitian ini menggunakan data panel dari 28 negara importir dari tahun 2001 sampai dengan 2014 dan dua model gravity dengan tiga metode estimasi yaitu Ordinary Least Square (OLS), Fixed Effect (FE) dan Random Effect (RE).
Secara empiris, diperoleh hasil bahwa BMR yang semakin ketat berpengaruh negatif dan signifikan terhadap ekspor teh Indonesia. Selain itu, hambatan tarif dan harga internasional juga berpengaruh signifikan terhadap ekspor teh Indonesia. Penelitian ini merekomendasikan Good Agricultural Practices (GAP) pada proses penanaman teh serta pengujian laboratorium secara periodik untuk menjaga kualitas teh Indonesia dan meningkatkan ekspor.
SUMMARY
NOVIANA KUS YUNIATI. The Trade-Effect of Maximum Residue Limits for Pesticides on Indonesia’s Tea Export. Under supervision of RINA OKTAVIANI and STEPHANIE MCWHINNIE.
Tea, as one of Indonesia’s important agricultural trade commodities, has
recently been confronted with the necessity to meet new requirements in food safety for global trade. One of these requirements is maximum residue limits (MRLs) for pesticides. These limits are set to protect consumers’ health from excessive pesticide residues, which remain on food. However, MRLs are considered to hamper global trade due to their increasing stringency and enforcement of stricter regulations.
Thus, the objective of this study is to estimate the impact of MRLs on
Indonesia’s tea exports. Based on a panel data set of 28 importing countries of
Indonesian tea from 2001 to 2014, this study employs two gravity models and applies three estimation methods, Ordinary Least Square (OLS), Fixed Effect (FE) and Random Effect (RE), to estimate the trade-effect of MRLs on Indonesian tea exports.
Empirical results show that increasing stringency of MRLs impedes export of Indonesian tea. In addition, international prices and tariff barriers are statistically significant, indicating a significant effect on exports. Based on these findings, this study suggests that actions, such as implementing Good Agricultural Practices (GAP) in tea farming and conducting laboratory testing on MRLs periodically, will improve the quality of Indonesian tea and contribute to maximizing export opportunities.
© Copyright belongs to IPB, 2016
All rights Reserved Law
Prohibited quoting part or all of this paper without including or mentioning the source. The quotation is only for educational purposes, research, scientific writing, preparation of reports, writing criticism, or review an issue; and citations are not detrimental to the interest of IPB.
THE TRADE-EFFECT OF MAXIMUM RESIDUE LIMITS FOR
PESTICIDES ON INDONESIA’S TEA EXPORT
NOVIANA KUS YUNIATI
Master Thesis
As a requirement to obtain a degree Master of Science in
Economics Program
POSTGRADUATE SCHOOL BOGOR AGRICULTURAL INSTITUTE
‘My Lord, increase me in knowledge’ (The Quran 20:114). All praises to Allah SWT for the opportunities, strength and His blessing to complete this Masters dissertation.
First, I would like to express my utmost gratitude to my supervisor from the University of Adelaide, Dr. Stephanie McWhinnie, for her extensive assistance, continuous support, kindness and encouragement throughout the process of this dissertation. Her worthwhile ideas, suggestions and constructive comments have contributed enormously to improve this work. Thereafter, my sincere gratitude to my supervisor from Bogor Agricultural University, Prof. Dr. Ir. Rina Oktaviani, MS for her assistance, knowledge, ideas, motivation and cooperation.
I would like also to appreciate Dr. Florian Ploeckl for his hard work to coordinate the Masters of Applied Economics Dissertation program. Not forgotten, my appreciation to Athena Kerley for her ideas, support and providing feedback for my writing.
My appreciation to all lecturers in the double degree program of the School of Economics of Bogor Agricultural University and University of Adelaide for the valuable learning experiences and economics knowledge. I would like thank all staff in both universities, especially Niranjala, Gus, Nicole, Regi and Dian for their support and help during my study in Bogor and Adelaide.
I would like to thank the Ministry of Trade and the Australian Awards Scholarship for providing a sponsorship to pursue a high education degree.
I would also like to acknowledge Dr. Dana Thomsen for providing editorial assistance. Editorial intervention was restricted to Standards D and E of the Australian Standards for Editing Practice.
I am also indebted to all of my college friends in Bogor and Adelaide for their friendship, discussion and moral support during this study period.
I owe more honor to my parents, husband, sister and brother for their endless love, encouragement and prayers throughout this challenging study period.
Bogor, January 2016
TABLE OF CONTENTS
LIST OF FIGURES ... ii
LIST OF TABLES ... ii
1 INTRODUCTION ... 1
2 BACKGROUND ... 1
The global market of tea ... 1
Indonesian tea ... 1
Regulation of maximum residue limits for tea ... 1
3 LITERATURE REVIEW... 1
Theoretical Perspective ... 1
Food Safety as Government Intervention ... 1
Food Safety in Global Trade ... 1
Empirical Studies ... 1
4 DATA AND METHODOLOGY ... 1
The Gravity Model ... 1
Data ... 1
Methods of Estimation ... 1
5 THE EMPIRICAL RESULTS... 1
6 CONCLUSION AND POLICY IMPLICATIONS ... 1
REFERENCES ... 19
LIST OF FIGURES
Figure 2.1 The world volume and value export of tea between 2001 and 2014 ... 1
Figure 2.2 Total world production of tea from 1990 to 2012 ... 1
Figure 2.3 Volatility of tea price from august 2000 to february 2015 ... 1
Figure 2.4 Export of Indonesia’s tea from 2001 to 2014 ... 1
Figure 2.5 Production of Indonesia’s tea from 2001 to 2012 ... 1
Figure 3.1 Shifts in supply and demand curve due to MRLs ... 1
Figure 3.2 Market equilibrium of MRLs in foreign trade results in zero import ... 1
Figure 3.3 Market equilibrium of MRLs in foreign trade with import ... 1
LIST OF TABLES
Table 5.1. Regression results of the impact of MRLs on Indonesia’s tea exports ... 1Table A.1 Summary statistic ... 1
Table A.2 The estimation results of a regression version with only either deltamethrin or the MRL enforcement periods for model 1 ... 1
Table A.3 The estimation results of a regression version with only either deltamethrin or the MRL enforcement periods for model 2 ... 1
1 INTRODUCTION
The Uruguay Round Agreement on Agriculture (URAA) of the World Trade Organization (WTO) has liberalized global agricultural trade by reducing tariff barriers. On the other hand, concern has arisen regarding technical safety measures, such as sanitary and phytosanitary (SPS) safety measures that increasingly impede trade. Henson and Loader (2001) show that SPS measures restrict market access of agricultural commodities from developing countries (DCs) to developed countries. The reason is that SPS measures are prevalent in agro-food commodities as the main objective of these measures is to protect the health of humans, animals and plants. Furthermore, agro-food exports have a significant role in developing countries. The total contribution of developing countries in global agricultural export was relatively high at more than 36% in 2001, accounting for 162 billion USD (Aksoy, 2005). Therefore, complying with SPS measures is substantial for developing countries to penetrate the world market with regard to product competitiveness and consumer safety (Henson & Loader, 2001).
This study empirically examines the impact of a specific set of SPS measures on Indonesian tea exports. These measures are known as maximum residue limits (MRLs). MRLs consist of the maximum permitted levels of pesticide residues in agro-food commodities. They have been established by many countries to assure safe application of pesticides in farming and to protect countries from plant-disease risks of imported food. In order to analyze the trade-effect of MRLs, trade data regarding export value of Indonesian tea to 28 major importing countries from 2001 to 2014 and data of MRLs for pesticide residues, namely deltamethrin, are used. Of 28 importing countries, 15 are from Asia and four are from the EU. Other countries include Egypt, the USA, Canada, the Russian Federation, the United Kingdom, Fiji, Australia and New Zealand. Three indicator variables for particular MRL regulation enforcement are created. This regulation known as the default list system was imposed by three major importing countries of Indonesian tea, namely Malaysia, Japan and the EU, in 2004, 2006 and 2008, respectively. The default list is the regulation of MRL which set the general maximum limit for pesticide residue at a strict level of 0.01 ppm for any residues unspecified in MRL regulation.
The empirical strategy used to examine the trade diversion effect of MRLs is based on the gravity model. This model is selected to account for the standard determinants of trade as MRLs will not be the only factor for altering tea exports. A typical gravity dataset from the Institute for Research on the International Economy (CEPII) is used. This data covers Gross Domestic Product (GDP), and distance between Indonesia and its exporting partners from 2001 to 2014. Furthermore, this study also considers tariff rate, international tea price, the production level of
Indonesia’s tea and population. Tariff rate is considered as another type of trade barrier
specifications namely the Ordinary Least Square (OLS), Fixed Effect (FE) and Random Effect (RE) to estimate the impact of MRLs on trade, as well as the other determinants.
Tea is a valuable commodity for Indonesia as it currently contributes economic benefits and has increasing export opportunities. Indonesia is the fifth largest producer of tea in the world of which around 65% is exported to foreign markets (Kustanti & Widiyanti, 2007). In 2009, the total plantation area of tea was at approximately 125,000 hectares, of which almost 61% is cultivated by smallholders in rural areas (Syaipulloh, 2010). This indicates that the tea sector contributes substantially to the development of rural areas. However, inconsistency of tea quality produced by smallholder growers is one of the main challenges in regards to compliance with safety requirements of foreign markets. In addition, the risk of pesticide residue remaining in tea is relatively high due to simple manufacturing processes such as dehydrating and withering (Sood et al., 2004). Consequently, non-compliance has led to export rejection. For example, some of Indonesian tea exports to the EU experienced border rejection due to MRL
exceedances of β-cyflutryn, cypermethrin and fenvalerat (Suprihatini, 2006).
Empirical studies of MRLs exist, but the number is limited. Some studies estimate the trade-effect of MRLs in terms of stringency and periods of enforcement (Chen, Yang, & Findlay, 2008; Nugroho, 2013; Wei, Huang, & Yang, 2012a, 2012b; Wilson & Otsuki, 2004). Other studies build different types of indices to compare MRLs among countries and measure trade-effect (Drogué & DeMaria, 2012; Ferro, Otsuki, & Wilson, 2015; Liu & Yue 2015; Xiong & Beghin, 2012). Generally, results indicate that stricter MRLs and more heterogeneous MRLs among countries empirically impede trade. The study of MRLs on Indonesian coffee export has been conducted by Nugroho (2013). Thus, there is a gap for other valuable Indonesian export commodities, such as tea. The findings of this study contribute to policy decision making and trade facilitation to enhance the value of Indonesian tea exports.
This paper is organized into six sections. Following this introduction, the background to the global tea market, profile of Indonesia’s tea sector and the regulation of MRLs on tea are outlined. Section three reviews the literature in regard to the theoretical framework and relevant empirical studies. Section four explains the data on the Indonesian tea trade and MRLs and methodology. Section five discusses estimation results of the trade-effect of MRLs on Indonesian tea export. Section six concludes that MRLs have a detrimental impact on the export of Indonesian tea.
2 BACKGROUND
2023 (Intergovernmental Group on Tea Food Agricultural Organization [IGG FAO], 2014b). In addition, this commodity makes a significant contribution to the development of rural areas, reduction of poverty and food security in DCs (IGG FAO, 2014c).
The global market of tea
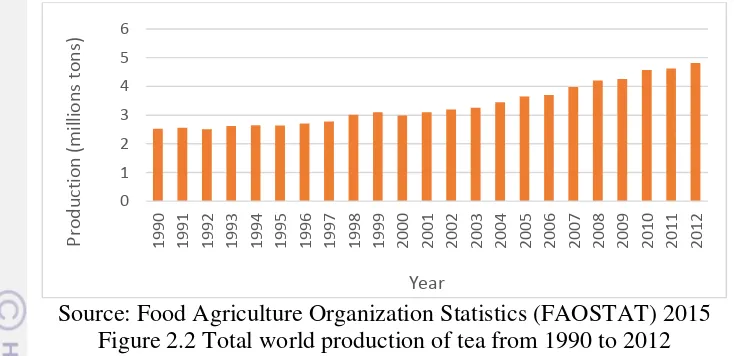
The trade performance of tea in the global market has varied over the last 13 years. Figure 2.1 illustrates global volume and value of tea exports between 2001 and 2014. Overall, the global export of tea shows an upward trend with the total volume of tea exports increasing by 17.79% from 1.5 million tons in 2001 to 1.8 million tons in 2014, with 80% in the form of black tea. Similarly, the total value of tea exports rose by around 42% from almost 3 billion USD to more than 7 billion USD between 2001 and 2014 and reached a peak in 2013 of almost 8 billion USD. This upward trend is projected to continually increase and to reach approximately 2.4 million tons in 2023 with the proportion of black and green tea at around 1.7 million tons and 7.5 thousand tons, respectively (IGG FAO, 2014b).
Source: International Trade Centre (ITC) 2015
Figure 2.1 The world volume and value export of tea between 2001 and 2014
Source: Food Agriculture Organization Statistics (FAOSTAT) 2015 Figure 2.2 Total world production of tea from 1990 to 2012
Price volatility indicates the impact of macroeconomic factors of the world tea economy on the income of producing countries. IGG FAO (2010) states that global tea price impacts positively on export earnings. In addition, price volatility creates uncertainty challenging producing countries in terms of plantation planning and maximizing profit by providing balanced supply (United Nation Conference on Trade and Development [UNCTAD], 2011). Tea prices experienced high volatility from July to October 2010 increasing by 29% (UNCTAD, 2011). High prices tend to encourage production due to the incentive offered by increasing export volume; however, uncontrolled increase of output can lower tea prices dramatically due to unbalanced supply-demand of tea (IGG FAO, 2010). IGG FAO (2014b) predicts thatthe current situation of excess supply in the global tea market will continue until 2023. Thus, global tea price affects the decision of producing countries to increase production and export; however, instability of price in the international market complicates this decision.
Source: Index Mundi 2015
Figure 2.3 Volatility of tea price from August 2000 to February 2015
0
1990 1991 1992 1993 1994 1995 1996 1997 1998 1999 2000 2001 2002 2003 2004 2005 2006 2007 2008 2009 2010 2011 2012
Generally, volatility of global tea price has fluctuated over the last 15 years. Figure 2.3 shows the fluctuation in global tea prices from August 2000 to February 2015. Previously, international tea prices were relatively low; however, a slow steady increase starting in February 2002 reached a 24 year record high at USD 3.21 per kg in August 2008 (IGG FAO, 2014d). After several price drops between August 2012 and January 2014, the global tea price reached a peak at slightly above USD 4 per kg in July 2015. This average upward trend is due to restructuring of the global tea market in balancing supply and demand of tea. Another reason is that there was an overall increase in global food and beverage prices between 2006 and 2008 (IGG FAO, 2014d). Gilbert (as cited in IGG FAO, 2014d) concludes that the increase in food prices was due to the nature of macroeconomic factors and the demand side of food. In addition, reduction in the supply side due to long-term drought in major global tea producing countries, such as Kenya, India and Sri Lanka, limits global tea output increasing tea price (IGG FAO, 2010).
Indonesian tea
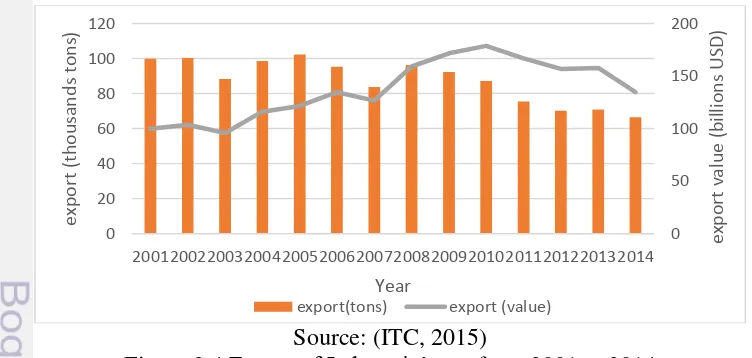
Although Indonesia is not the world largest exporter of tea, this country contributed to the global tea trade at about 3.5% in 2014, which places Indonesia fifth in the world tea exporter rankings following China, Sri Lanka, Kenya and India. Figure 2.4 depicts the export of Indonesian tea from 2001 to 2014. The volume of tea exports fluctuated between 2001 and 2008, declined consistently from 2008 to 2012, then remained relatively steady at around 70 thousand tons from 2013 onward. In addition, the value of Indonesia’s tea exports was highly affected by international prices. The
total value of Indonesia’s tea exports increased from 2001, peaking at 1.78 billion USD
in 2010. This was due to a growth trend in world tea prices from 2008. From 2010 to 2014, this value slowly decreased to 1.4 billion USD in 2014 which was due to global price decline during this period. Thus, the increase Indonesia’s export value since 2008 is due to global price fluctuations in spite of increasing of export volume.
Source: (ITC, 2015)
Figure 2.4 Export of Indonesia’s tea from 2001 to 2014
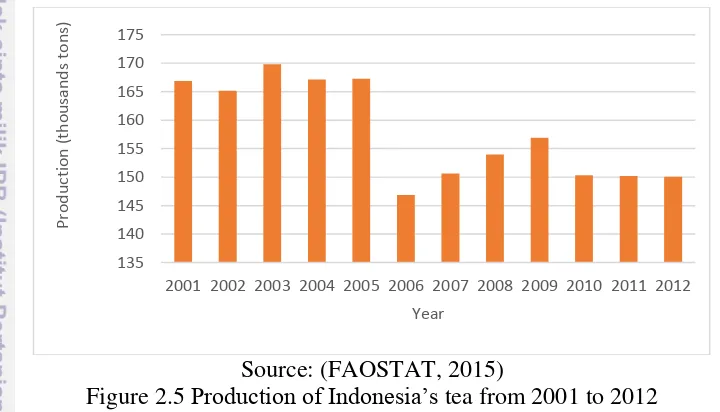
While production of Indonesia’s tea has declined over the years, this crop plays an important role in the national economy. In 2000, the economic contribution of tea was 1.2 trillion IDR which was 0.3% of total revenue from non-oil and gas sector (Kustanti &Widiyanti, 2007). Figure 2.5 shows the fluctuation in production level of
Indonesia’s tea over a 12 year period starting from 2001. This figure shows a significant
decline from 167 thousand tons in 2005 to almost 149 thousand tons in 2006. This was a result of the declining number of tea plantations due to land alteration to palm oil or other more profitable crops (Kustanti &Widiyanti, 2007). However, from 2006 to 2009, tea production increased as a result of the increase in international tea prices improving the attractiveness of tea in the global market. After a slight fall in 2010, production remained constant at about 150 thousand ton until 2012.
Source: (FAOSTAT, 2015)
Figure 2.5 Production of Indonesia’s tea from 2001 to 2012
Tea plays a vital role as an income sources for people in remote areas. Tea is a labor-intensive commodity contributing significantly to employment in remote areas (IGG FAO, 2014c). Tea plantations are located only in certain rural areas due to specific soil and climate requirements (Majumder et al., 2010). In Indonesia, most tea plantations (78%) are situated in West Java and the remaining tea plantations (22%) are located across 10 provinces (Syaipulloh, 2010). These plantations are mostly owned by smallholders. In 2005, the numbers of tea plantations owned by smallholders reached 180,000 with the labor ratio at about 0.75 per acreage, while tea processing industries employed more than 51,000 workers (Kustanti &Widiyanti, 2007). The productivity of tea cultivated by smallholders is typically poor compared to plantations owned by state and private companies (The Ministry of Agriculture of Indonesia & Indonesia Tea Board, 2014). However, the high number of tea smallholders reveals that this commodity provides a livelihood for many people in rural areas.
135
2001 2002 2003 2004 2005 2006 2007 2008 2009 2010 2011 2012
Regulation of maximum residue limits for tea
To facilitate global trade, the sanitary and phytosanitary (SPS) agreement has encouraged countries to adopt international standards. For agro-food commodities including tea, this agreement recommends Codex as the international benchmark because it is the international organization of food standard development. This organization has developed 341 food standards since 1963 including the maximum residue limits (MRLs) (Codex Alimentarius, 2015). Generally, MRLs set by Codex are not overly restrictive for global trade as Codex accommodates different standard compliance capacities and the infrastructure of different countries worldwide. However, according to the SPS agreement, adhering to Codex standards is voluntary. Therefore, countries with higher demand for safer food are allowed to establish and apply more stringent safety requirements, such as MRLs.
In recent years, the relevant authorities of each country have set their own national MRLs for tea. Thus, national regulation of MRLs across different countries is diverse. For instance, the MRL of deltamethrin for tea which is regulated at different limits between Russia and Malaysia at 10 ppm and 5 ppm, respectively (Food Safety Information System of Malaysian [FoSIM], 2015; United States Department of Agriculture [USDA], 2014). In addition, MRL stringency increases in terms of the number of MRLs and strictness level for each pesticide residue. For instance, the EU increased the total number of MRLs for tea from 67 in 2001 to 454 in 2014 (IGG FAO, 2001; IGG FAO, 2014a). Likewise, the quantity of MRLs regulated for tea in Japan grew from seven in 2001 to 239 in 2015 (IGG FAO, 2001;The Japan Food Chemical Research Foundation [FFCR], 2015). Furthermore, in 2005, Malaysia started to incorporate MRLs into its national food laws with some substances such as dicofol
regulated at 5 ppm which was tighter than Codex’s MRL at 40 ppm (FoSIM, 2015;
Codex Alimentarius, 2015). In 2013, Russia amended its regulation on MRLs which increased the number of MRLs for tea from four to 25 and established more stringent MRLs than Codex (USDA, 2014).
The regulation of MRLs becomes more challenging for exporting countries due to the default or positive list system. This system sets a single uniform limit for all chemical substances unspecified in MRL regulations. For example, Japan established a positive list system at 0.01 ppm in 2006 (FFCR, 2015). This means that agricultural commodities entering the Japanese market cannot contain pesticide residues exceeding their MRLs and limit at 0.01 ppm for any residue in the absence of MRL. The EU also established a default system at 0.01 ppm in 2005 which came into force in September 2008 (European Food Safety Authority [EFSA], 2015). Malaysia also enforced a default list in 2004; however, it applied in the absence of MRL in national regulation
3 LITERATURE REVIEW
This section discusses the relationship between MRLs and international trade from both a theoretical perspective and according to relevant empirical studies.
Theoretical Perspective
Food Safety as Government Intervention
When markets fail to allocate resources efficiently, economics suggests that government is required to take action to correct these failures. Market failures of MRLs arises from imperfect information faced by consumers and producers (Antle, 2001). This is because consumers cannot distinguish safe or unsafe products before consuming them and it is often impossible to determine which product is resulting in illness (Mitchell, 2003). Producers cannot directly determine the level of residues remaining in their crops without laboratory testing (Antle, 2001). Government can intervene in market failures by setting safety regulations such as MRLs (Henson, 2003). Figure 6 depicts the shift of supply and demand curve due to MRLs. Safety regulations shift the supply and demand curve (Mitchell, 2003). The supply side shifts back due to higher production costs and the demand side shifts forward due to a higher demand for safer food. Therefore, prices will rise. The implications on quantity are different. One effect on quantity is negative (refer to figure 3.1). This is because the increase in production costs are higher relative to the willingness to pay of consumers. In the reverse scenario, the quantity could rise but the price will certainly increase.
Source: (Mitchell, 2003)
Food Safety in Global Trade
In theory, the trade-effect of MRLs can be explained in the demand and supply diagram for global trade. However, it becomes complicated due to different safety regulations for different countries (Mitchell, 2003). The trade-effect of safety standards, such as MRLs, is different with tariff and unquantifiable barriers (UNCTAD, 2013). There is no single conclusion as to whether safety standards hamper or enhance trade (Swann, 2010). In terms of MRLs, the two dimensions of MRL strictness, which are the number of MRLs and their limit value, imposed on each commodity create difficulties in examining their trade-effect across countries and commodities (Ferro et al., 2015).
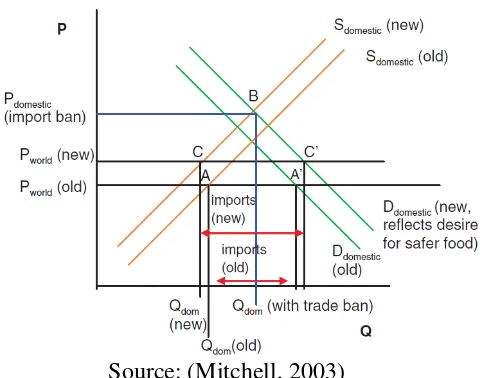
Mitchell (2013) discusses two possible outcomes regarding the trade effect of different MRL regulation across countries. The first consequence is zero imports. This case occurs when MRL regulations of a domestic country are too strict. Thus, foreign producers are incapable to produce safer food complying with these regulations at reasonable prices. Figure 3.2 shows that the market equilibrium shifts from A-A’ to B without imports. Secondly, foreign producers still can attain trade benefits through exporting their product (Mitchell, 2003) because increasing world prices, due to MRL regulations, is still below domestic prices. Thus, Figure 3.3 depicts a new equilibrium occurring at point C-C’. At this point, consumers are better off because imports decline the price of safer food. However, domestic production of safer food also decreases.
Source: (Mitchell, 2003)
Source: (Mitchell, 2003)
Figure 3.3 Market equilibrium of MRLs in foreign trade with import
Empirical Studies
Studies estimating the trade-effect of MRLs on agro-food commodities are generally limited. However, among these some studies have focused on analysing the trade-effect of MRL stringency on various agro-food products. As a part of these studies, the trade-effect of MRL policy changes are estimated by introducing indicator variables to measure the trade-effect of MRLs before and after the period of policy enforcement. Other studies have focused on building indices to capture the level of heterogeneity of MRLs among countries. In general, empirical results show that MRLs have a negative impact on trade in terms of MRL stringency level, their increasing number and heterogeneity among countries.
Typically, these studies use the panel data set. Some focus on a specific MRL for one commodity of a particular exporting country to major importing countries. For instance, the trade-effect of chloromycetin MRL on China’s honey (Wei et al., 2012a) and the impact of carbaryl MRL on Indonesia’s coffee export (Nugroho, 2013). In addition, Chen et al. (2008) investigate the trade-effect of two specific MRLs, cholpyrifos and oxytetracycline on China’s exports of two category products covering two aggregate products (vegetables, and fish and aquatic commodities) and three individual products (garlic, onion and spinach). Other studies involve the interaction of panel data from many exporting to many importing countries. Wilson and Otsuki (2004) examine the trade-effect of stringency limits for chlorpyrifos on bananas from 21 exporting countries to 11 member countries of the Organization for Economic Cooperation and Development (OECD).
policy changes in the EU, Korea, Japan and Sri Lanka. Yue, Kuang, Sun, Wu, & Xu (2010) estimated the impact of MRL policy change in the EU in 2001 on China’s tea export by using the indicator variable. Similarly, Nugroho (2013) added two dummy variables for the periods of MRL policy change in the EU and Japan. The results of both studies show negative signs after stricter MRLs regulations are imposed. This means that these regulations decrease trade.
The underlying theory applied for studies on MRLs is the gravity model. This model has been frequently applied to estimate the impact of specific issues on bilateral trade flow including MRLs. The simple gravity model involves main variables of Gross Domestic Product (GDP) of importing countries and distances between exporting and importing countries. Some add other variables, such as GDP of exporting countries, population and cultural variables including common language and colony. In general, previous studies apply the gravity model and include the additional variable of MRL stringency (Wilson & Otsuki, 2004; Chen et al., 2008; Yue et al., 2010; Xiong & Beghin, 2011; Wei et al., 2012a, 2012b; Nugroho, 2013).
In order to estimate trade effects of MRLs, different studies using a panel data set have applied various techniques and estimators. For example, Nugroho (2013) compared two applicable estimators for panel data, the fixed effect (FE) and the random effect (RE), with ordinary least square (OLS). Similarly, Wei at al. (2012b) compared estimation results of the OLS as a benchmark and the FE as this estimator is found to be suitable for the gravity model. Yue et al. (2010) applied the OLS estimator as they did not identify the problem of heteroscedasticity and autocorrelation. Some studies encountering the problem of zero trade flow require specific estimation techniques. This problem occurs when bilateral trade does not occur in some estimation periods. Xiong and Beghin (2011) compared two estimation methods between the Helpman-Melitz-Rubinstein (HMR approach) and the zero-inflated negative binomial pseudo-maximum-likelihood model (ZINBPML). Wei at al. (2012a) applied two approaches and four estimators to address the zero trade flow problem. These approaches are implemented by adding small positive numbers to all trade flow data and by applying
Heckman’s sample selection model. Furthermore, they compared estimation results of
the OLS, RE, FE and poisson pseudo maximum likelihood (PPML)
4 DATA AND METHODOLOGY
This section describes the gravity model frequently used to analyze trade effects of MRLs and also explains data sources and estimation methods.
The aim of this study was to examine the trade-effect of MRLs on Indonesia’s tea exports. Previous literature shows that the export of tea is also determined by many other characteristics. Therefore, this study uses the standard gravity model of trade flow to form the basis of analysis.
The Gravity Model
The gravity model is an essential empirical tool to analyze trade flow. This model is successful in estimating bilateral trade flow (Gomez-Herrera, 2013) as it can provide the most robust economic findings Chaney (2013). By inserting additional key variables the augmented gravity model is able to estimate the impact of certain issues on trade flow (Sargento, 2007). Thus, this model is more flexible for addressing specific issues related to trade including policy changes related to MRLs. Generally, studies on MRLs apply the gravity model by inserting the variable of MRL stringency and dummy variables for the periods of MRL enforcement.
The traditional gravity model explains that bilateral trade flow is determined by country size indicated by Gross Domestic Product (GDP) and trade restrictions
indicated by the distance between countries. This model follows Newton’s gravity
equation so that the traditional gravity model equation becomes:
�� = ��� � ����� 2
In another gravity specification, country size can also be associated with population to capture the market size in trade flow (Reinert, Rajan, & Glass, 2009). Anderson and van Wincoop (2004) highlight that non-tariff barriers are one type of trade restriction. Thus, non-tariff barriers, such as SPS measures and MRLs, can be inserted as variables into the gravity equation. To estimate this equation, empirical studies convert it into a natural logarithm linear form (Bacchetta et al., 2012). In addition, empirical studies use the expected signs of GDP and distance to determine the appropriate method of estimation (Salvitci, 2013).
This study uses two models of the gravity equation and includes four measures (Deltamethrin, MYS2004, JPY2006 and EU2008) to examine the trade-effect of MRLs on Indonesia’s tea exports. In addition, price, production and tariff barriers as other
determinants of Indonesia’s tea trade are also taken into account. The specifications of
Model 1:
Where the variables and subscripts are:
I = Indonesia
j = Importing countries of Indonesia’s tea t = Trade year
EXPIjt : Export value of tea from Indonesia to countries j in year t
DELTAMETHRINjt : The variable of MRL stringency of countries j in year t
MYS2004 : Indicator for default list enforcement periods by Malaysia JPY2006 : Indicator for default list enforcement periods by Japan EU2008 : Indicator for default list enforcement periods the EU
TARIFFjt : Simple average tariff rates of countries j set for Indonesia’s tea
PRODit-1 : Production of Indonesia in year t-1
PRICEt : International prices in year t
GDPjt : GDP of country j in year t
GDPIt : GDP of Indonesia in year t
POPjt : Population of countries j in year t POPIt : Population of Indonesia
DISTij : Distances the between capital cities of Indonesia and importing
countries
β0 to β10 : Coefficients to be estimated
εijt : Error term
Data
The data representing MRL stringency, deltamethrin, were obtained from sources related to the national regulations of importing countries. Deltamethrin is one type of pesticide residue measured in ppm. Deltamethrin was used because this limit is
applied in the majority of countries importing Indonesia’s tea. The expected sign for
deltamethrin is positive because the lower the value of the MRLs the more stringent. Thus, they hamper trade. For some countries which do not set a specific MRL on deltamethrin, I followed the approach used in previous studies and assume that the MRL of deltamethrin is the least stringent MRL regulated by these importers of
Indonesia’s tea. This is because Indonesia, as the producer of tea, is required to adjust
its production process to meet the least stringent MRL to export to its trading partners (Chen et al., 2008; Wei et al., 2012a, 2012b; Wilson & Otsuki, 2004).
In addition, three indicator variables, MYS2004, JPY2006 and EU2008, were created. These indicators, in the form of dummy variables, were used to capture the trade effect of policy changes regarding pesticide regulation in importing countries. The dummy is a binary variable which is valued 0 prior to the period of enforcement and 1 for the year in which the regulation is initiated and afterwards. MYS2004 is valued 1 for the period 2004 to 2014, JPN2006 is valued 1 for the period 2006 to 2014, and EU2008 is valued 1 from 2008 to 2014.
Methods of Estimation
Two models of the gravity equation were estimated using the OLS, FE and RE. The OLS is useful as a basic comparison model. However, the OLS is only consistent under specific assumptions that rarely are present and do not account for the two dimensions of time and cross-section of the panel data set. Thus, the FE and RE were used as estimation methods for the panel data. Using the FE to estimate the gravity model is useful to avoid heterogeneity bias (Cheng & Wall, 2005). This is because the FE assumes that countries have fixed-pair factors, such as distance and cultural variables, correlated with their trade value (Cheng & Wall, 2005). Consequently, the FE omits the estimation of time invariant variable coefficients, such as distance. Thus, this study applied the RE which is able to estimate time invariant variables and to control the heterogeneity effect of the panel data (Bacchetta et al., 2012). To select suitable estimators between the FE and RE, this study used the Hausman test (Bacchetta et al., 2012).
5 THE EMPIRICAL RESULTS
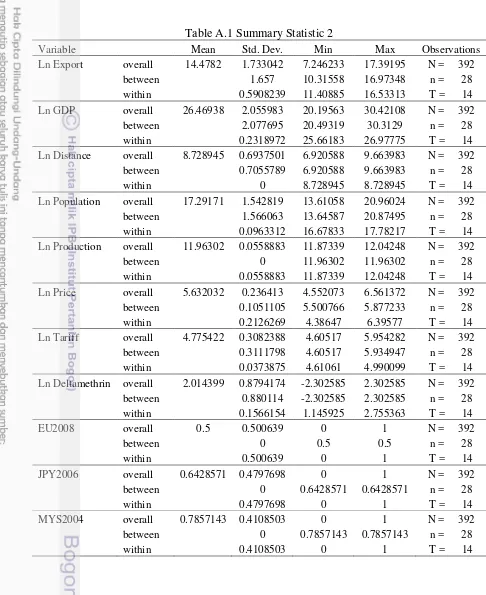
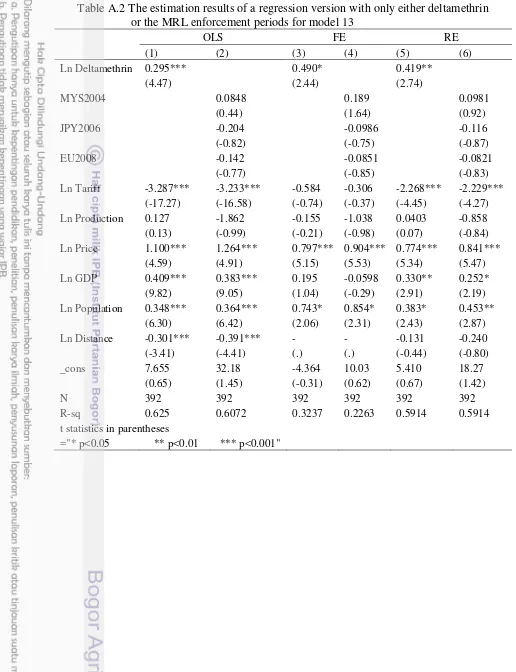
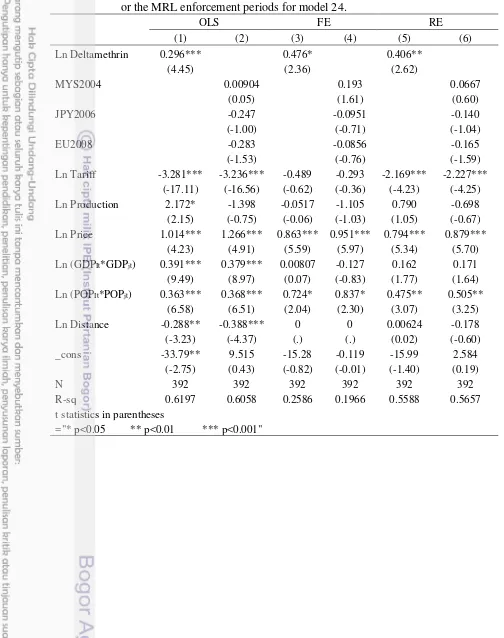
stringency, have a statistically significant impact on Indonesia’s tea trade. However, production and indicators for MRL enforcement periods are insignificant. In addition, a regression version with only either deltamethrin or MRL enforcement periods was run and found to generate similar results (refer to Tables A.2 & A.3 in the Appendix). The Hausman test shows that RE is more suitable estimator than FE (refer to Table A.4 in the Appendix).
Table 5.1. Regression results of the impact of MRLs on Indonesia’s tea exports
Model 1 Model 2
R-squared overall 0.2142 0.5844 0.1668 0.5706
t statistics in parentheses * p<0.05 ** p<0.01 *** p<0.001
Under the OLS, FE and RE, results indicate that the key variable, deltamethrin, has positive signs and is statistically significant in the two gravity models. This means
that lower MRLs decrease Indonesia’s tea exports as lower MRLs reflect a higher level
of stringency. This is because lower MRLs mean that less pesticide residue is allowed to remain in tea. The magnitude of coefficients varied among the three estimators, but were very similar across the two models. In model 1, the coefficients can be interpreted that if MRL of deltamethrin is lowered by 1%, then trade decreases by 0.29%, 0.6% and 0.45% based on the estimation of OLS, FE and RE, respectively.
Three indicators for the periods of MRL enforcement were introduced into the two gravity models. The results consistently indicate two different signs under the OLS, FE and RE. The indicator for the MRL default list enforcement in Malaysia, MYS2004, shows positive signs. This means that the default MRL system enhances
Indonesia’s tea exports. The reason for this is that the Malaysian default list is only
applied when national MRLs and international Codex MRLs do not exist. Therefore, Malaysia generally defers to the Codex MRLs as the international benchmark, which is relatively less stringent than default MRLs or the national MRLs of importing countries. However, unexpectedly, the significance level at 5% only appears in the FE for both models.
The other two indicators for MRL enforcement periods, JPY2006 and EU2008, have consistent negative signs in the two models and the three estimators. This means that the default MRL systems enforced by Japan and the EU have a negative impact on trade. However, unexpectedly, these variables are not statistically significant.
The estimation results indicate that tariff barriers have a negative impact on
Indonesia’s tea exports. Both models show the expected negative signs under the OLS,
FE and RE estimators because tariffs are a form of trade restriction imposed by importing countries. Specifically, higher tariffs lead to higher trade costs for exporting countries, thereby hindering exports. The impact of this variable shows significance level at 0.1% in the OLS and RE. However, under the FE, the coefficients are unexpectedly insignificant due to the limited variation in country specific related variables. The coefficients in both models for each estimator are relatively similar. The estimated coefficient from the OLS is at -3.9, while the RE is -2.2. This means that a
1% increase in tariff rates reduce Indonesia’s tea exports by about 3.9% in the OLS and
2.2% in the RE. Under estimation of the OLS, FE and RE, results for the coefficients of price are positive and statistically significant. This means that higher global prices
promote exports. The result is in line with the fact that Indonesia’s tea exports reached
a peak in 2010 when global tea prices increased in the period 2008 to 2010. In this
period, Indonesia’s farmers tried to increase production to gain a higher profit from
exports because world tea price has a positive impact on exporter income (IGG FAO, 2010). Using the FE and RE the magnitude of the coefficients is relatively consistent at about 0.85 in both models. Whereas, the OLS results have a higher magnitude at about 1.19 for both models which means that a 1% increase in international tea prices enhances Indonesia’s tea exports by about 1.19%.
higher production level decreases exports. The reason for this is the current situation of an excess supply of tea in the global market (IGG FAO, 2014b). Due to excess supply, global tea producers limit exports to maintain a high international price for tea. Thus, the main tea exporting countries prefer to allocate increases in production for domestic consumption.
Results indicate that the signs for GDP and distance are as usually expected in the gravity model. GDP shows a positive sign whereas distance is negative. This means that the larger the economic size of the importing country, the greater the export of Indonesia’s tea. However, distance reduces bilateral trade. In other words, the negative sign means the farther the distance the higher the trade cost, which in turn results in lower opportunities for trade. Distance is omitted from the FE because it is a time-invariant variable. In models 1 and 2, GDP and distance show a significance level at 0.1% in the OLS. However, using the RE the significance level of both variables decreases at the 1% level in model 1 and the 5% level in model 2.
Population indicates tea demand size for each importing country. Thus, a larger population raises exports. This can be seen from the positive sign of the results in both models. Using the OLS, model 1 shows that a 1% increase in the population of importing countries raises Indonesia’s tea exports by 0.344% with the significance level at 0.1%. Similarly, the OLS estimation for model 2 shows that a 1% increase in the total population of Indonesia and its importing countries raises exports by 0.348%. Using the RE, results for both models have very similar coefficients for population, but at a lower significance level at 1% and at 5% for models 1 and 2, respectively. Unexpectedly, the FE shows that population has an insignificant effect of population on trade; however, the signs are consistently positive.
6 CONCLUSION AND POLICY IMPLICATIONS
In recent years, the export of agro-food commodities from developing countries has been impacted by SPS measures, such as MRLs. Thus, Indonesia as one of the largest exporters of agro-food commodities has been challenged by this issue. This study has, therefore, aimed to estimate the trade-effect of MRLs on Indonesia’s tea exports. Tea was selected as a case study because of its contribution to the development of rural areas and rise in export opportunities. Using a set of panel data of 28 importing countries over 14 periods starting from 2001, this study compared results of three estimators in two gravity models. Empirical results indicate the negative impact of
strict MRLs on the export of Indonesia’s tea. This finding is significant for policy
makers determining the most appropriate strategies for enhancing the export of
Indonesia’s tea.
Specifically, the empirical results of this study reveal that the more stringent
MRLs (eg. deltamethrin) have a statistically significant negative impact on Indonesia’s
tea exports. Results estimate that a 1% increase in stricter MRLs, such as deltamethrin,
decreases Indonesia’s tea exports by 0.29%. This finding is supported by previous
Wei. et al., 2012a, 2012b; Wilson & Otsuki, 2004). In addition, specific strict MRL regulations, known as the default list, enforced by Malaysia has a positive impact, whereas the default list enforcement in Japan and the EU have negative impacts on the
export of Indonesia’s tea. These different results occur because Malaysia imposes
default list only when MRLs do not exist in its national regulation and Codex standards. Whereas, Japan and the EU apply default list directly for MRLs that do not exist in their national MRLs. However, it is not clear why the results are statistically insignificant. Therefore, additional studies are required and should include another dimension of MRL stringency, such as the number of MRLs, in order to specify the stringency level of the default list regulations. Moreover, these studies can estimate the impacts of variables’ interactions on Indonesia’s tea exports by multiplying dummies of the periods enforcements of default list with other variables such as GDP, price and tariff.
In order to promote Indonesia’s tea in global trade, policy makers should ensure
compliance with MRLs according to importing country regulations. To achieve this compliance, specific actions from the production to the distribution level are required. Thus, the government of Indonesia needs to assist farmers in applying pesticides in proper doses using appropriate techniques. For instance, the government can regulate the implementation of good agricultural practices (GAP) as a guideline to producing safe crops efficiently. Furthermore, there is also need to conduct sampling and laboratory testing to scientifically verify the level of MRLs periodically. Another important action is to participate actively in the WTO which facilitates the notification of new MRL regulations by its member countries. This action is also important for building multilateral cooperation to enhance trade including negotiation and harmonization of MRLs. In addition, in order to deal with cases of non-compliance, the government should improve the national food safety management system so it can respond to the issues promptly.
Another key empirical finding indicates that international prices have a significant effect on trade. Hence, it is important to maintain the supply and demand balance of tea in the international market. For this reason, Indonesia as an exporting country needs strategies to facilitate tea trade. One effective strategy would be for the government to use commodity future contracts. This scheme allows farmers, as sellers, and buyers from other countries to conduct transactions in a long term contract with specific fixed prices. Furthermore, as empirical evidence estimates that tariff barriers
are statistically significant in terms of hampering Indonesia’s tea exports, Indonesia
REFERENCES
Aksoy, M Ataman, & Beghin, John C. (2004). Global agricultural trade and
developing countries. World Bank Publications. Virginia, USA.
Anderson, James E, & van Wincoop, Eric. (2004). Trade costs. Journal of Economic
Literature, 42(3), 691-751.
Antle, John M. (2001). Economic analysis of food safety. Handbook of Agricultural
Economics, 1, 1083-1136.
Bacchetta, Marc, Beverelli, Cosimo, Cadot, Olivier, Fugazza, Marco, Grether, Jean-Marie, Helble, Matthias, . . . Piermartini, Roberta. (2012). A practical guide to
trade policy analysis. World Trade Organization. Retrieved from
http://unctad.org/
Chaney, Thomas. (2013). The gravity equation in international trade: An explanation.
National Bureau of Economic Research.
Chen, Chunlai, Yang, Jun, & Findlay, Christopher. (2008). Measuring the effect of Alimentarius. Retrieved October 20, 2015, from www.codexalimentarius.net Drogué, Sophie, & DeMaria, Federica. (2012). Pesticide residues and trade, the apple
of discord?. Food Policy, 37(6), 641-649.
EFSA. (2015). Maximum residue levels. European Food Safety Authority. Retrieved September 5, 2015, from http://www.efsa.europe.eu/
FAOSTAT. (2015). Food and agricultural commodities production. Food and Agriculture Organization of The United Nations, Statistics Division. Retrieved September 1, 2015, from http://faostat3.fao.org/home/
Ferro, Esteban, Otsuki, Tsunehiro, & Wilson, John S. (2015). The effect of product standards on agricultural exports. Food Policy, 50, 68-79.
FFCR. (2015). The Japanese positive list system for agricultural chemical residues in
foods. The Japan Food Chemical Research Foundation. Retrieved September 5,
2015, from http://www.ffcr.or.jp
FoSIM. (2015). Food regulation 1985. Food Safety Information System of Malaysia. Retrieved September 7, 2015, from http://fsis2.moh.gov.my
Gómez-Herrera, Estrella. (2013). Comparing alternative methods to estimate gravity models of bilateral trade. Empirical Economics, 44(3), 1087-1111.
Henson, Spencer. (2003). The economics of food safety in developing countries. ESA
Working Paper, 12, 3-19.
Henson, Spencer, & Loader, Rupert. (2001). Barriers to agricultural exports from developing countries: The role of sanitary and phytosanitary requirements.
IGG FAO. (2001). Compendium on trade tariff and maximum residue levels. 14th
Session of Intergovernmental Group on Tea Food Agriculture Organization.
New Delhi, India. Retrieved from www.fao.org
IGG FAO. (2010). Preliminary analysis of the impact of high tea prices on the world tea economy. 19th Session of Intergovernmental Group on Tea Food
Agriculture Organization. New Delhi, India. Retrieved from www.fao.org
IGG FAO. (2012). Current market situation and medium term outlook for tea. 20th
Session of Intergovernmental Group on Tea Food Agriculture Organization.
Colombo, Sri Lanka. Retrieved from www.fao.org
IGG FAO. (2014a).Implication of maximum residue levels of tea on trade. 21st Session
of Intergovernmental Group on Tea Food Agriculture Organization. Bandung,
Indonesia. Retrieved from www.fao.org
IGG FAO. (2014b). Current market situation and medium term outlook. 21st Session
of Intergovernmental Group on Tea Food Agriculture Organization. Bandung,
Indonesia. Retrieved from www.fao.org
IGG FAO. (2014c). Socio-economic implications of climate change for tea producing countries. 21st Session of Intergovernmental Group on Tea Food Agriculture
Organization. Bandung, Indonesia. Retrieved from www.fao.org
IGG FAO. (2014d). Impact of macroeconomic factors on the global tea economy. 21st
Session of Intergovernmental Group on Tea Food Agriculture Organization.
Bandung, Indonesia. Retrieved from www.fao.org
Index Mundi. (2015). Commodity prices.Index Mundi. Retrieved September 1, 2015, from www.indexmundi.com
ITC. (2015). Trade statistics for international business development. International Trade Centre. Retrieved September 1, 2015, from www.trademap.org
Kustanti, Veronika Ratri, & Widiyanti, Theresia. (2007). Research on supply chain in the tea sector in Indonesia: The Business Watch Indonesia. Retrieved from http://somo.nl
Liu, Lan, & Yue, Chengyan. (2015). Investigating the impact of MRL standards’ similarity on trade. Non Tariff Measures with Market Imperfections: Trade and
Welfare Implications, 12.
Majumder, A Basu, Bera, B, & Rajan, A. (2010). Tea statistic: global scenario.
International Journal of Tea Science, 8(1), 121-124.
Mitchell, Lorraine. (2003). Economic theory and conceptual relationships between food safety and international trade. op. cit, 10-24.
Nugroho, Agus. (2014). The impact of food safety standard on Indonesia's coffee exports. Procedia Environmental Sciences, 20, 425-433.
Reinert, Kenneth A, Rajan, Ramkishen S, & Glass, Amy Joycelyn. (2009). The
Princeton encyclopedia of the world economy (two volume set). 1. Princeton
University Press.
Salvatici, Luca. (2013). The gravity model in international trade. African Growth and
Development Policy Technical Note 04.
Sargento, Ana Lúcia Marto. (2007). Empirical examination of the gravity model in two different contexts: Estimation and explanation. Jahrbuch für
Sood, Chitra, Jaggi, Shivani, Kumar, Vipin, Ravindranath, SD, & Shanker, Adarsh. (2004). How manufacturing processes affect the level of pesticide residues in tea. Journal of the Science of Food and Agriculture, 84(15), 2123-2127. Suprihatini, Rohayati. (2006). The non-tariff barriers of Indonesia tea trade. Tinjauan
Komoditas-Teh, 6(1), 49-52. Retrieved from
http://www.sitp.rpn.co.id/upload/riset/
Swann, G P. (2010). International standards and trade: A review of the empirical literature. OECD Trade Policy Working Papers(97).
Syaipulloh, Muhammad. (2010). The statistic of tea of Indonesia Ardief Achmad, Rita Setiawati, Hariyanto, Sulistina & Suwart (Eds.), Retrieved from http://www.bps.go.id
The Ministry of Agriculture of Indonesia and Indonesia Tea Board (2014). ‘Indonesia
tea smallholders’. In the 21st Session of Intergovernmental Group on Tea Food
Agriculture Organization. PowerPoint presentation, Bandung, Indonesia.
Retrieved from www.fao.org
USDA. (2014). New Russian MRLs for pesticides in agricultural and food products. United States Department of Agriculture. Retrieved September 8, 2015 from http://gain.fas.usda.gov
UNCTAD. (2013). Non-tariff measures to trade: Economic and policy issues for
developing countries. United Nation Conference on Trade and Development.
Geneva, Switzerland.
UNCTAD. (2011). Policy actions to mitigate the impact of highly volatile prices and incomes on commodity dependent countries, and to facilitate value addition and greater participation in commodity value chains by commodity-producing countries. 3rd Session of Expert Meeting on Commodities and Development. United Nation Conference on Trade and Development. Geneva, Switzerland. Retrieved from www.unctad.org
Wei, Guoxue, Huang, Jikun, & Yang, Jun. (2012a). Honey safety standards and its impacts on China's honey export. Journal of Integrative Agriculture, 11(4), 684-693.
Wei, Guoxue, Huang, Jikun, & Yang, Jun. (2012b). The impacts of food safety standards on China's tea exports. China Economic Review, 23(2), 253-264. Wilson, John S, & Otsuki, Tsunehiro. (2004). To spray or not to spray: pesticides,
banana exports, and food safety. Food Policy, 29(2), 131-146.
Xiong, Bo, & Beghin, John C. (2011). Does European aflatoxin regulation hurt groundnut exporters from Africa?. European Review of Agricultural
Economics, 39(4), 589-609.
Xiong, Bo, & Beghin, John C. (2012). Stringent maximum residue limits, protectionism, and competitiveness: The cases of the US and Canada.
International Agricultural Trade Research Consortium.
Yue, Ning, Kuang, Hua, Sun, Lin, Wu, Linhai, & Xu, Chuanlai. (2010). An empirical
analysis of the impact of EU’s new food safety standards on China’s tea export.
Table A.2 The estimation results of a regression version with only either deltamethrin or the MRL enforcement periods for model 13
OLS FE RE
(1) (2) (3) (4) (5) (6)
Ln Deltamethrin 0.295*** 0.490* 0.419**
(4.47) (2.44) (2.74)
MYS2004 0.0848 0.189 0.0981
(0.44) (1.64) (0.92)
JPY2006 -0.204 -0.0986 -0.116
(-0.82) (-0.75) (-0.87)
EU2008 -0.142 -0.0851 -0.0821
(-0.77) (-0.85) (-0.83)
Ln Tariff -3.287*** -3.233*** -0.584 -0.306 -2.268*** -2.229***
(-17.27) (-16.58) (-0.74) (-0.37) (-4.45) (-4.27)
Ln Production 0.127 -1.862 -0.155 -1.038 0.0403 -0.858
(0.13) (-0.99) (-0.21) (-0.98) (0.07) (-0.84)
Ln Price 1.100*** 1.264*** 0.797*** 0.904*** 0.774*** 0.841***
(4.59) (4.91) (5.15) (5.53) (5.34) (5.47)
Ln GDP 0.409*** 0.383*** 0.195 -0.0598 0.330** 0.252*
(9.82) (9.05) (1.04) (-0.29) (2.91) (2.19)
Ln Population 0.348*** 0.364*** 0.743* 0.854* 0.383* 0.453**
(6.30) (6.42) (2.06) (2.31) (2.43) (2.87)
Ln Distance -0.301*** -0.391*** - - -0.131 -0.240
(-3.41) (-4.41) (.) (.) (-0.44) (-0.80)
_cons 7.655 32.18 -4.364 10.03 5.410 18.27
(0.65) (1.45) (-0.31) (0.62) (0.67) (1.42)
N 392 392 392 392 392 392
R-sq 0.625 0.6072 0.3237 0.2263 0.5914 0.5914
t statistics in parentheses
Table A.3 The estimation results of a regression version with only either deltamethrin or the MRL enforcement periods for model 24.
OLS FE RE
(1) (2) (3) (4) (5) (6)
Ln Deltamethrin 0.296*** 0.476* 0.406**
(4.45) (2.36) (2.62)
MYS2004 0.00904 0.193 0.0667
(0.05) (1.61) (0.60)
JPY2006 -0.247 -0.0951 -0.140
(-1.00) (-0.71) (-1.04)
EU2008 -0.283 -0.0856 -0.165
(-1.53) (-0.76) (-1.59)
Ln Tariff -3.281*** -3.236*** -0.489 -0.293 -2.169*** -2.227***
(-17.11) (-16.56) (-0.62) (-0.36) (-4.23) (-4.25)
Ln Production 2.172* -1.398 -0.0517 -1.105 0.790 -0.698
(2.15) (-0.75) (-0.06) (-1.03) (1.05) (-0.67)
Ln Price 1.014*** 1.266*** 0.863*** 0.951*** 0.794*** 0.879***
(4.23) (4.91) (5.59) (5.97) (5.34) (5.70)
Ln (GDPIt*GDPjt) 0.391*** 0.379*** 0.00807 -0.127 0.162 0.171
(9.49) (8.97) (0.07) (-0.83) (1.77) (1.64)
Ln (POPIt*POPjt) 0.363*** 0.368*** 0.724* 0.837* 0.475** 0.505**
(6.58) (6.51) (2.04) (2.30) (3.07) (3.25)
Ln Distance -0.288** -0.388*** 0 0 0.00624 -0.178
(-3.23) (-4.37) (.) (.) (0.02) (-0.60)
_cons -33.79** 9.515 -15.28 -0.119 -15.99 2.584
(-2.75) (0.43) (-0.82) (-0.01) (-1.40) (0.19)
N 392 392 392 392 392 392
R-sq 0.6197 0.6058 0.2586 0.1966 0.5588 0.5657
t statistics in parentheses
Table A.4 The result of Hausman test5 ---- Coefficients ----
(b) (B) (b-B)
sqrt(diag(V_b-V_B))
Fixed Random Difference S.E.
Ln GDP 0.0163947 0.3071633 -0.2907686 0.1728361
Ln Population 0.7181965 0.4002387 0.3179578 0.3338731
Ln Production -1.078435 -0.882952 -0.1954831 0.2397306
Ln Price 0.8957192 0.835249 0.0604702 0.0544889
Ln Tariff -0.21380 -2.236535 2.022728 0.6346057
Ln Deltamethrin 0.6037964 0.4512689 0.1525275 0.1361872
EU2008 -0.0772616 -0.0788246 0.001563 0.0103946
JPY2006 -0.1075331 -0.1236468 0.0161136 .
MYS2004 0.2720678 0.1569261 0.1151417 0.0464419
b = consistent under Ho and Ha; obtained from xtreg
B = inconsistent under Ha, efficient under Ho; obtained from xtreg Test: Ho: difference in coefficients not systematic
chi2(9) = (b-B)'[(V_b-V_B)^(-1)](b-B) = 12.38
Prob>chi2 = 0.1925
BIOGRAPHY
The author named Noviana Kus Yuniati was born in Surakarta on 8 June 1983 as the first child of Mrs. Sofiyatun and Mr. Sunardi. The author obtained her bachelor degree in Chemical Engineering, Sebelas Maret University, Surakarta in 2006. In January 2008, the author started to work at Directorate of Developing the Quality of Goods, the Ministry of Trade of Indonesia.