68
CHAPTER V
CONCLUSION
This chapter provides the conclusion, limitations and the suggestion for
the further research. The purpose of this study is to identify and examine the
systematic influence of capital structure that proxy by Debt to Equity Ratio, Debt
to Assets Ratio, Tangibility, Interest Coverage Ratio, and Financial Leverage
Multiplier on the Firm Value that proxy by Price to Book Value.
5.1
Conclusion
Based on the data collected and the result of hypothesis testing using multiple
regressions, then it can be concluded as follows:
1.
Debt to Equity Ratio as the capital structure variable does not influence on
Firm Value (PBV) with significant value 0.514 that mean higher than 0.05.
Means that Hypothesis 1: “There is a positive impact of Debt to Equity Ratio
on firm value” is rejected. Debt to Equity Ratio has negative beta coefficient
which is -0.093. Means that Debt to Equity Ratio does not influence on the
Firm Value of company that proxy by Price to Book Value (PBV).
2.
Debt to Assets Ratio as the capital structure variable positively influence on
Firm Value (PBV) with significant value 0.002. The value of significance is
lower than 0.05 means thatHypothesis 2: “There is a positive impact of Debt
to Asset Ratio on firm value” is accepted. Debt to Assets Ratiohas positive
69
Ratiopositivelyinfluences on the Firm Value of company that proxy by Price
to Book Value (PBV).
3.
Tangibility as the capital structure variable does not influence on Firm Value
(PBV) with significant value 0.332. The value of significance shows that the
value is higher than 0.05 so means that the Hypothesis 3: “There is a positive
impact of Tangibility on Firm Value” is rejected. Tangibilityhas negative beta
coefficient of -0.502. Means that Tangibility does not influence on the Firm
Value of company that proxy by Price to Book Value (PBV).
4.
Interest Coverage Ratio as the capital structure variable positively influence
on Firm Value (PBV) with significant value 0.000. The value of significance
is lower than 0.05 means that the Hypothesis 4: “The influence of Interest
Coverage Ratio on Firm Value (PBV)” is accepted. Interest Coverage Ratio
has positive beta coefficient of 0.028. Means that Interest Coverage Ratio
positivelyinfluences on the Firm Value of company that proxy by Price to
Book Value (PBV).
5.
Financial Leverage Multiplier as the capital structure variable positively
influence on Firm Value (PBV) with significant value 0.000. The value of
significance is lower than 0.05 so means that the Hypothesis 5: “The influence
of Financial Leverage Multiplier on Firm Value (PBV)” is accepted. Financial
Leverage Multiplier has positive beta coefficient of 0.047. Means that
Financial Leverage Multiplier positivelyinfluences on the Firm Value of
70
5.2 Managerial Implication
Capital Structure is a thing that crucial on the company. There are many
term of capital structure that can implement in the company. Every single
company surely needs the capital structure in order to financing the company. The
capital structure is need by all company. This study has several managerial
implications include:
1.
For Management of Companies
This study can be using by the company to financing the company. The
independent that already explain in this research can be a reference to
company which one the method of capital structure that can proper for
certain company. Because the better capital structure is impact the firm
value.
2.
For Investors
This finding of study can be using by the investor’s view. The describing
of the research can delivered the good information for the decision making
of investment. The data of this research is from the manufacturing
company that listed in the IDX. The information of capital structure of
every single company that identify in this research can help investor
71
5.3
Research Limitation and Suggestion for Further Research
5.3.1 Research
Limitation
This study has several limitations include:
1.
A sample of study is limited to 29 manufacture companies that listed on IDX
during the period 2010-2015.
2.
The independent of this research are Debt to Equity Ratio, Debt to Assets
Ratio, Tangibility, Interest Coverage Ratio, Financial Leverage Multiplier
and dependent is Firm Value that proxy by Price to Book Value. There are
other independent and dependent variable out of variable on above.
5.3.2 Suggestion for Further Research
1.
For further research, the researcher suggests add more the other variable of
capital structure to make the research better. The examples of capital structure are
growth, size, etc.
2.
Take time period also can give more better observation result. A longer
75
REFERENCES
Amirya and Atmini. 2008. Determinan Tingkat Hutang serta Hubungan Tingkat
Hutang Terhadap Nilai Perusahaan: Perspektif Pecking Order Theory. Jurnal
Akuntansi dan Keuangan Indonesia. Vol 5. No 2.
Andreas, Tanjung and Sentosa. 2009. Pengaruh Financial Distress dan Good
Corporate Governance Terhadap Rekayasa Laporan Keuangan. Jurnal
Ekonomi. Vol 17. No 2.
Ani Rachmawati, (2013), “Analisis Pengaruh Struktur Modal, Pertumbuhan
perusahaan, Ukuran perusahaan, dan Profitabilitas terhadap Nilai Perusahaan
pada perusahaan manufaktur yang terdaftar di bursa efek indonesia periode
2007 – 2009”.
Armour, John. Henry Hansmann and Reinier Kraakman. Angency Problems,
Legal Stragegies and Enforcement. John M. Olin Centre for Law,
Economics and Business. Discussion Paper No. 644
B.Prahalatan, (2008), “The Determinants of Capital Structure:An empirical
Analysis of Listed Manufacturing Companies inColombo Stock Exchange
Market in SriLanka.”
Biser Georgiev and Eliza Mitreva, (2015), “Determinants of Capital
Structure:Evidence from the Global Renewable EnergySector.”BUSN 89
Degree Project in Corporate and FinancialManagement - Master Level
Bizer and Eliza. 2015. Determinants of Capital Structure: Evidence from the
Global Renewable Energy Sector. LUP Student Papers.
Brigham, Eugene F and Joel F. Houston, 2006. Dasar-Dasar Manajemen
Keuangan. Buku satu, Edisi sepuluh, PT. Salemba Empat, Jakarta
Devianasari, Ni Luh and Ni Putu Santi Suryantini. 2015. Pengaruh Price Earning
Ratio, Debt to Equity Ratio dan Dividend Payout Ratio Terhadap Nilai
Perusahaan pada Perusahaan Manufaktur yang Terftar di Bursa Efek
Indonesia. E-Jurnal Manajemen Unud. Volume 4. Nomor 11.
Dewi and Wirakusuma. 2014. Fenomena Ketepatwaktuan Informasi Keuangan
dan Faktor yang Mempengaruhi di Bursa Efek Indonesia. E-Jurnal
Akuntansi Universitas Udayana. Vol 8. No 1.
76
IndrianiNastika A.M, SautmaRonni, dan Mariana IngMalela., (2014), “Pengaruh
Struktur Modal Terhadapnilai Perusahaan PadaSektorUtama Yang Terdaftar
Di Bursa Efek Indonesia”, Jurnal Program
StudiManajemen&Manajemenkeunangan, hal.18
Jahirul Hoque, Ashraf Hossain, Kabir Hossain, (2014), “Impact Of Capital
Structure Policy On Value Of The Firm – A Study On Some Selected
Corporate Manufacturing Firms Under Dhaka Stock Exchange.” Vol.3, issue
2 (5).
Joni and Lina. 2010. Faktor-Faktor yang Mempengaruhi Struktur Modal. Jurnal
Bisnis dan Akuntansi. Vol 12. No 2.
KholiqMahfud, (2009), “AnalisisPengaruhStruktur Modal,
Pertumbuhanperusahaan, Ukuranperusahaan, danProfitabilitasterhadapNilai
Perusahaan padaperusahaanmanufaktur yang terdaftar di bursa
efekindonesiaperiode 2007 – 2009”.
Laily, Nurul. Pengaruh Tangibility, Pertumbuhan Penjualan, Profitabilitas dan
Ukuran Perusahaan Terhadap Struktur Modal dan Harga Saham Perusahaan
Pertambangan di Daftar Efek Syariah Tahun 2002 – 2010. Skripsi.
Universitas Islam Negeri Sunan Kalijaga. Yogyakarta
Ma’ruf, Muhamad. 2006. Analisis Faktor-Faktor Yang Mempengaruhi
Manajemen Laba Pada Perusahaan Go Public di Bursa Efek Jakarta. Skripsi
UII: Yogyakarta.
Marlinah, Aan and Linda Wimelda. 2013. Variabel-Variabel yang Mempengaruhi
Struktur Modal pada Perusahaan Publik Sektor Non Keuangan. Media Bisnis.
Mathanika.T, VirginaVinothoni.A.G. Paviththira, (2012), “Impact of Capital
Structure on Firm Value: Evidence from Listed Manufacturing Companies on
Colombo Stock Exchange (CSE) in Srilanka.” Proceeding of International
Conference on Contemporary Management – 2015 (ICCM-2015), pp 24-35
Meythi, RikiMartuasa, Debbianita, (2012), “PengaruhStruktur Modal
terhadapNilai Perusahaan denganPertumbuhan Perusahaan
SebagaiVaribaleMaderating.”, hal.11-12
PancawatiHardiningsih, Rachmawati Meita Oktaviani, (2012), “Determinant of
Debt Policy (In Agency Theory and Pecking Order Theory).”
77
R.Zeitun,G.G.Tian, (2012), “Capital structure and corporate performance:
evidence from Jordan,Australasian Accounting, Business and Finance”
Journal, 1(4), 2007.
Riyanto, Bambang. 2001. Dasar-Dasar Pembelanjaan Perusahaan. Edisi Keempat.
Cetakan Ketujuh. BPFE Yogyakarta.Yogyakarta.
Sartono, Agus. 2001. Manajemen Keuangan Teori dan Aplikasi. Yogyakarta:
BPFE-YOGYAKARTA.
Satuti. 2011. Analisis Pengaruh Risiko Bisnis, Growth, Likuiditas, Profitabilitas,
dan Interest Coverage Ratio Terhadap Struktur Modal (Studi pada Perusahaan
Manufaktur yang Terdaftar di Bursa Efek Indonesia). Skripsi. Universitas
Sebelas Maret Surakarta
Sheridan Titman, Roberto Wessels, (1988), “The Determinant of Capital
Structure.”Journal of Finance, vol. XLIII, No.1
Sofyaningsih, Sri and Pancawati Hardiningsih. 2011. Struktur Kepemilikan,
Kebijakan Dividen, Kebijakan Utang dan Nilai Perusahaan. Dinamika
Keuangan dan Perbankan. Vol. 3. No. 1
Sorana Vatayu, (2012),Determinants of capital structure: “Evidence
fromRomanian manufacturing companies,”Advanced Research in Scientific
Areas 2012
Sri Hermuningsih, (2013), “PengaruhProfitabilitas, Growth, Opportunity, Sruktur
Modal TerhadapNilai Perusahaan Pada Perusahaan Publik di Indonesia”,
JurnalBuletinEkonomiMoneterdanPerbankan, hal.128-148
Sudiyatno, Puspitasari and Kartika. 2012. The Company's Policy, Firm
Performance, and Firm Value: An Empirical Research on Indonesia Stock
Exchange. American International Journal of Contemporary Research.
Vol. 2
No. 12
Suprityanah and Ghoniya. 2015. Kebijakan Pendanaan, Insider Ownership dan
Firm Size Terhadap Nilai Perusahaan yang Listed di Bursa Efek Indonesia
(BEI) Tahun 2010 – 2013. EKOBIS. Vol 16. No 1.
Suryani, Indra Dewi. 2010. Pengaruh Mekanisme Corporate Governance dan
Ukuran Perusahaan Terhadap Manajemen Laba pada Perusahaan Manufaktur
yang Terdaftar di BEI. Skripsi. Universitas Diponegoro. Semarang
78
Suteja, Jaja and Wiston Manihuruk. 2009. Pengaruh Struktru Modal, Kepemilikan
dan Faktor Eksternal pada Penentuan Nilai Perusahaan. Trikonomika. Volume
8. No. 2.
Ujiyantho, Muh Arief dan Bambang Agus Pramuka. Mekanisme Corporate
Governance, Manajemen Laba dan Kinerja Keuangan (Studi pada
Perusahaan go Public Sektor Manufaktur). Simposium Nasional Akuntansi
XI. Makasar
www.idx.xo.id
www.indonesian-invesment.com
www.yahoo-finance.com
www.bloomberg.com
www.investopedia.com
www.financeformulas.net/
79
APPENDIX A
MODEL DATA BEFORE TRIMMING
Year Code Debt to Equity Ratio
Debt To Asset Ratio
Tangibility Interest Coverage
Ratio
The financial Leverage Mulplier
PBV
2010 AMFG 0.289728 0.224643 0.437195 23.05239 10.933903 1.37
ASII 1.002807 0.449819 0.197055 30.42355 55.759387 3.76
AUTO 0.393387 0.271756 0.176344 66.69557 14.486920 2.62
BATA 0.382748 0.276796 0.346602 19.84761 37.250231 2.65
BRAM 0.228998 0.166618 0.485462 26.82051 1.273150 0.89
BRNA 17.024036 0.603228 0.448072 2.84491 15.968319 0.99
CTBN 0.850540 0.456749 0.236055 7.48156 7.214359 1.97
DLTA 0.272452 0.211471 0.160800 51.14367 44.250546 3.24
EKAD 1.096167 0.461541 0.330327 7.01874 7.315302 1.14
GDYR 1.714865 0.631658 0.510754 5.27555 1.629084 21.2
GGRM 0.483480 0.324940 0.240931 24.58342 31.954546 3.63
HMSP 0.693059 0.409254 0.199138 237.96934 46.828937 12.08
IGAR 0.293061 0.191140 0.097087 118.28051 6.618533 0.75
INTP 0.240815 0.193735 0.501935 252.51589 8.337505 4.48
KAEF 0.569980 0.363049 0.249321 10.19796 2.983961 0.79
KLBF 0.392483 0.260978 0.228264 86.45028 13.848923 5.72
LION 0.191252 0.160547 0.059918 35.37998 5.842433 0.96
LMSH 0.833472 0.454587 0.305801 7.23310 7.937500 0.98
MAIN 6.347136 0.865983 0.434944 5.94733 28.504985 4.24
MRAT 0.155528 0.134590 0.186550 44.35210 6.847701 0.82
MYOR 1.026356 0.500060 0.338599 8.80972 11.477388 4.04
SCCO 1.769792 0.636586 0.162739 5.04026 5.630879 0.94
SMSM 0.799997 0.422934 0.021598 9.56167 145.497357 2.71
SQBB 0.210611 0.173970 0.068603 146.86222 106.599902 0.4
TKIM 2.628508 0.710108 4.629801 1.56236 0.472127 0.66
TOTO 0.912131 0.477023 0.358166 31.92564 20.407219 3.06
UNIC 0.811596 0.444155 0.290129 1.72935 2.766710 0.56
UNTR 0.755126 0.428348 0.543391 24.92274 29.342601 4.9
UNVR 1.019876 0.504532 0.554280 151.79019 98.099476 31.09
2011 AMFG 0.287441 0.223265 0.428448 21.08953 12.399055 1.33
ASII 0.929629 0.483435 0.186652 25.11549 76.244565 3.95
AUTO 0.361358 0.265439 0.222253 83.79806 18.061868 0.56
BATA 0.460754 0.315422 0.328182 23.11493 39.742231 2.02
BRAM 0.229702 0.222521 0.375684 20.65096 1.604211 0.81
BRNA 1.459802 0.593463 0.521532 3.20157 18.665623 0.96
CTBN 1.440748 0.586561 0.203785 73.32565 6.459073 2.58
80
Code Debt to Equity Ratio Debt To Asset Ratio Tangibility Interest Coverage Ratio The financial Leverage Mulplier PBV
EKAD 0.633160 0.387690 0.313277 6.34803 6.800195 1.33
GDYR 1.762319 0.637985 0.471856 2.93139 1.668855 15.96
GGRM 0.444465 0.306470 0.209520 27.02999 40.630891 4.86
HMSP 1.009223 0.502295 0.199209 225.24477 44.101661 16.76
IGAR 0.184928 0.156067 0.078753 117.83333 6.772952 1.72
INTP 0.171408 0.146327 0.420799 222.41356 9.861552 3.99
KAEF 0.487648 0.327798 0.237827 20.23932 3.230540 1.51
KLBF 0.218399 0.179251 0.224820 147.46713 16.294875 5.3
LION 0.169165 0.144689 0.050714 45.93201 7.032759 0.9
LMSH 0.671476 0.412270 0.206266 13.63690 10.210313 0.84
MAIN 2.776996 0.735239 0.422750 5.98658 39.168171 3.94
MRAT 0.144668 0.133284 0.176628 45.77677 7.897065 0.6
MYOR 1.156293 0.536241 0.308857 6.11902 17.218846 4.15
SCCO 1.701371 0.629818 0.139534 8.52345 7.080454 1.24
SMSM 0.811857 0.026070 0.339557 10.43895 10.038933 2.92
SQBB 0.189451 0.046695 0.216605 202.34457 35.327734 4.32
TKIM 2.449561 0.710108 0.457483 2.10709 4.782289 0.42
TOTO 0.729975 0.455638 0.355582 23.19520 27.042353 3.26
UNIC 0.856939 0.469062 0.227394 3.58465 3.111525 0.59
UNTR 0.837313 0.554624 0.288157 27.45213 50.872206 3.57
UNVR 1.149068 0.621565 0.506979 205.86453 137.382857 38.97
2012 AMFG 0.254240 0.202704 0.444561 21.52481 14.356779 1.47
ASII 1.034851 0.508563 0.158026 19.46131 90.056324 3.43
AUTO 0.474568 0.321833 0.234662 67.95284 23.034558 2.6
BATA 0.457484 0.313886 0.327278 76.69525 44.162154 2.01
BRAM 0.356583 0.262854 0.566972 2.91717 1.765814 0.82
BRNA 1.530241 0.604781 0.554570 3.77530 22.329971 1.6
CTBN 0.700608 0.411975 0.185945 52.50087 7.076302 2.55
DLTA 0.215087 0.177014 0.127627 103.63226 46.543871 6.83
EKAD 0.609207 0.378578 0.311658 10.99285 7.839177 1.27
GDYR 1.772670 0.639337 0.463610 7.72442 1.580986 0.99
GGRM 0.592148 0.371918 0.250289 12.13491 43.147013 4.07
HMSP 0.876189 0.467005 0.156780 269.48144 59.884844 19.73
IGAR 0.223665 0.182783 0.137852 54.38639 5.949390 1.63
INTP 0.153641 0.133179 0.348722 325.72564 12.362796 4.26
KAEF 0.432522 0.301931 0.216312 41.49549 3.738473 2.85
KLBF 0.269895 0.212533 0.239411 125.63507 18.546551 7.3
LION 0.211067 0.174282 0.070183 39.44912 8.333916 1.45
LMSH 0.713529 0.416409 0.184655 70.20497 13.390417 1.03
MAIN 2.147756 0.682314 0.474852 7.59765 53.093864 5.9
MRAT 0.178736 0.151633 0.175020 36.97067 8.513514 0.54
81
Code Debt to Equity Ratio Debt To Asset Ratio Tangibility Interest Coverage Ratio The financial Leverage Mulplier PBV
SCCO 1.803298 0.643277 0.151189 10.72580 7.232704 1.27
SMSM 0.696018 0.377027 0.314136 12.26411 10.809519 3.99
SQBB 0.195888 0.163801 0.213759 193.29989 38.783594 7.49
TKIM 2.461533 0.711111 0.439794 1.04714 4.992920 0.35
TOTO 0.761338 0.432250 0.302878 32.05425 30.738534 3.67
UNIC 0.986031 0.496483 0.209352 2.58585 2.752498 0.57
UNTR 0.688487 0.399159 0.302113 25.16999 53.939731 2.27
UNVR 1.847729 0.648843 0.524280 93.70140 157.077051 40.09
2013 AMFG 0.267932 0.211314 0.417627 17.10453 16.310567 1.1
ASII 1.029461 0.507258 0.176930 23.39919 105.728261 2.59
AUTO 0.619231 0.382423 0.252262 384.54436 26.179222 1.84
BATA 0.481615 0.325061 0.308695 42.13402 52.360385 0.03
BRAM 0.355553 0.261910 0.531659 9.33670 1.832974 0.63
BRNA 1.552377 0.608208 0.568198 0.78926 32.612551 1.03
CTBN 0.638519 0.339215 0.201410 41.57227 7.226255 1.94
DLTA 0.245891 0.197362 0.107352 118.14536 54.146069 8.99
EKAD 0.426695 0.299080 0.304125 14.47163 9.834340 1.15
GDYR 1.349983 0.574465 0.511809 13.79705 1.416818 1.43
GGRM 0.560166 0.359043 0.291291 8.80165 52.773315 2.75
HMSP 0.972250 0.492965 0.171820 267.64757 62.524741 19.32
IGAR 0.290519 0.225118 0.155347 38.13747 64.762757 0.13
INTP 0.171815 0.146623 0.349717 361.19483 14.455618 3.2
KAEF 0.440374 0.305736 0.201722 30.47671 4.450738 2.02
KLBF 0.277593 0.217278 0.258529 94.59789 24.138745 6.89
LION 0.165850 0.142257 0.121229 27.59355 9.584897 1.5
LMSH 0.318103 0.241334 0.164477 33.98305 14.760208 0.7
MAIN 1.639622 0.621158 0.509607 70.62910 65.321504 6.24
MRAT 0.180327 0.152777 0.186754 -6.50064 8.216523 0.53
MYOR 1.706295 0.630491 0.320740 25.17673 21.713780 5.9
SCCO 1.273425 0.560135 0.144375 104.92072 8.570903 1.29
SMSM 0.756862 0.398966 0.289321 13.89743 11.815923 4.93
SQBB 0.220633 0.180753 0.207959 262.46591 41.131641 8.97
TKIM 2.463882 0.711307 0.442354 0.59310 4.849416 0.25
TOTO 0.695305 0.410136 0.320003 23.15745 35.250686 3.68
UNIC 0.776723 0.437166 0.174323 6.41868 2.985310 0.41
UNTR 0.557268 0.357850 0.254076 21.99574 61.512228 1.99
UNVR 2.020130 0.668888 0.514990 354.19222 174.943486 46.63
2014 AMFG 0.282051 0.220000 0.390680 15.21962 18.057101 1.1
ASII 1.015237 0.503780 0.174767 16.85870 116.615119 2.5
AUTO 0.320013 0.242432 0.229886 42.91205 29.837617 1.41
BATA 0.490766 0.286126 0.316465 53.14779 59.607000 0.03
82
Code Debt to Equity Ratio Debt To Asset Ratio Tangibility Interest Coverage Ratio The financial Leverage Mulplier PBV
BRNA 2.678336 0.728138 0.539223 2.23072 3.641310 1.33
CTBN 0.816738 0.449563 0.228717 46.79638 7.271338 0.29
DLTA 0.281547 0.219693 0.114518 71.44578 61.946356 8.17
EKAD 0.445479 0.308188 0.256099 12.37132 11.773319 1.32
GDYR 0.975035 0.493680 0.435921 95.24282 1.699549 1.17
GGRM 0.725924 0.420600 0.325886 6.21431 60.517606 3.51
HMSP 0.936014 0.483479 0.208579 149.20114 64.751608 22.29
IGAR 0.394271 0.282780 0.131703 54.47391 71.994650 0.21
INTP 0.157960 0.136412 0.420413 419.59221 15.693101 3.71
KAEF 0.521798 0.342883 0.187973 12.74632 5.344228 4.55
KLBF 0.331190 0.248793 0.274000 52.08781 26.506678 8.74
LION 0.199103 0.166044 0.169315 13.81158 11.536873 1.09
LMSH 0.282697 0.220391 0.211000 14.45729 14.574479 0.53
MAIN 1.567470 0.610511 0.446448 -0.01943 104.165752 2.5
MRAT 0.163561 0.140569 0.155443 -4.36644 9.323103 2.5
MYOR 1.465201 0.594354 0.348360 14.61191 23.013655 4.56
SCCO 1.490114 0.598412 0.178380 3.32347 8.055175 1
SMSM 0.689615 0.408149 0.281915 19.25143 12.144353 5.96
SQBB 0.213616 0.176016 0.189778 265.17707 44.858594 0.29
TKIM 2.263272 0.693559 0.421594 0.45978 4.159925 0.1
TOTO 0.686069 0.406904 0.398126 25.17870 40.925569 3.2
UNIC 0.851532 0.459907 0.183744 2.30476 2.616641 0.34
UNTR 0.609089 0.378530 0.225984 31.76155 64.653976 1.68
UNVR 2.123201 0.676760 0.514543 80.97966 187.164744 1.6
2015 AMFG 0.230402 0.187258 0.426880 12.08741 19.678687 0.83
ASII 0.961612 0.490215 0.169911 44.55227 78.413738 1.89
AUTO 0.295139 0.295139 0.244591 2.50542 29.750857 0.75
BATA 0.805784 0.446224 0.295183 57.99139 61.173615 2.12
BRAM 0.725703 0.402284 0.339292 5.32065 2.366404 0.86
BRNA 2.641313 0.725374 0.660205 0.03135 52.776319 0.67
CTBN 0.776486 0.411791 0.299630 9.66376 6.080413 2.37
DLTA 0.297557 0.229321 0.101436 45.16191 64.836758 4.90
EKAD 0.385602 0.256099 0.247876 12.84502 11.153467 0.94
GDYR 1.167591 0.507482 0.465730 1.50444 1.609704 1.53
GGRM 0.752117 0.429262 0.316611 7.04038 66.010924 2.68
HMSP 1.102563 0.524390 0.165247 100.65121 81.695705 0.24
IGAR 0.328122 0.247058 0.173177 50.63579 7.898293 0.70
INTP 0.165431 0.141948 0.499809 190.49806 15.015821 3.36
KAEF 0.646676 0.389814 0.210660 10.35574 5.826835 2.58
KLBF 0.265604 0.209863 0.287557 113.75872 29.218961 5.58
LION 0.351647 0.260162 0.176723 11.74765 12.291026 1.15
83
Code Debt to Equity Ratio
Debt To Asset Ratio
Tangibility Interest Coverage
Ratio
The financial Leverage Mulplier
PBV
MAIN 2.276064 0.694756 0.475005 0.56000 88.488398 2.20
MRAT 0.299111 0.230243 0.142025 1.42920 9.291402 0.24
MYOR 1.509687 0.601544 0.332380 4.91909 25.365384 5.21
SCCO 1.033426 0.508219 0.179336 4.78966 8.624954 0.79
SMSM 0.525409 0.344637 0.322027 23.72136 15.420951 4.67
SQBB 0.245267 0.196960 0.194627 38.52909 50.067652 8.39
TKIM 1.910894 0.656463 0.463933 0.32414 4.118398 0.22
TOTO 0.646606 0.392690 0.358726 21.79415 47.277907 4.74
UNIC 0.644635 0.391962 0.169485 0.92577 2.466206 0.31
UNTR 0.562912 0.360169 0.205131 36.15680 66.180321 1.55
84
APPENDIX B
MODEL DATA AFTER TRIMMING
Code Debt to Equity
Ratio
Debt To Asset Ratio
Tangibility Interest Coverage
Ratio
The financial Leverage
Mulplier
PBV
AMFG 0.289728 0.224643 0.437195 23.05239 10.933903 1.37
ASII 1.002807 0.449819 0.197055 30.42355 55.759387 3.76
AUTO 0.393387 0.271756 0.176344 66.69557 14.486920 2.62
BATA 0.382748 0.276796 0.346602 19.84761 37.250231 2.65
BRAM 0.228998 0.166618 0.485462 26.82051 1.273150 0.89
BRNA 17.024036 0.603228 0.448072 2.84491 15.968319 0.99
CTBN 0.850540 0.456749 0.236055 7.48156 7.214359 1.97
DLTA 0.272452 0.211471 0.160800 51.14367 44.250546 3.24
EKAD 1.096167 0.461541 0.330327 7.01874 7.315302 1.14
GGRM 0.483480 0.324940 0.240931 24.58342 31.954546 3.63
HMSP 0.693059 0.409254 0.199138 237.96934 46.828937 12.08
IGAR 0.293061 0.191140 0.097087 118.28051 6.618533 0.75
INTP 0.240815 0.193735 0.501935 252.51589 8.337505 4.48
KAEF 0.569980 0.363049 0.249321 10.19796 2.983961 0.79
KLBF 0.392483 0.260978 0.228264 86.45028 13.848923 5.72
LION 0.191252 0.160547 0.059918 35.37998 5.842433 0.96
LMSH 0.833472 0.454587 0.305801 7.23310 7.937500 0.98
MAIN 6.347136 0.865983 0.434944 5.94733 28.504985 4.24
MRAT 0.155528 0.134590 0.186550 44.35210 6.847701 0.82
MYOR 1.026356 0.500060 0.338599 8.80972 11.477388 4.04
SCCO 1.769792 0.636586 0.162739 5.04026 5.630879 0.94
TKIM 2.628508 0.710108 4.629801 1.56236 0.472127 0.66
TOTO 0.912131 0.477023 0.358166 31.92564 20.407219 3.06
UNIC 0.811596 0.444155 0.290129 1.72935 2.766710 0.56
UNTR 0.755126 0.428348 0.543391 24.92274 29.342601 4.9
85
Code Debt to Equity
Ratio
Debt To Asset Ratio
Tangibility Interest Coverage
Ratio
The financial Leverage
Mulplier
PBV
ASII 0.929629 0.483435 0.186652 25.11549 76.244565 3.95
AUTO 0.361358 0.265439 0.222253 83.79806 18.061868 0.56
BATA 0.460754 0.315422 0.328182 23.11493 39.742231 2.02
BRAM 0.229702 0.222521 0.375684 20.65096 1.604211 0.81
BRNA 1.459802 0.593463 0.521532 3.20157 18.665623 0.96
CTBN 1.440748 0.586561 0.203785 73.32565 6.459073 2.58
DLTA 0.194191 0.162613 0.141001 58.65084 43.475114 2.98
EKAD 0.633160 0.387690 0.313277 6.34803 6.800195 1.33
GGRM 0.444465 0.306470 0.209520 27.02999 40.630891 4.86
HMSP 1.009223 0.502295 0.199209 225.24477 44.101661 16.76
IGAR 0.184928 0.156067 0.078753 117.83333 6.772952 1.72
INTP 0.171408 0.146327 0.420799 222.41356 9.861552 3.99
KAEF 0.487648 0.327798 0.237827 20.23932 3.230540 1.51
KLBF 0.218399 0.179251 0.224820 147.46713 16.294875 5.3
LION 0.169165 0.144689 0.050714 45.93201 7.032759 0.9
LMSH 0.671476 0.412270 0.206266 13.63690 10.210313 0.84
MAIN 2.776996 0.735239 0.422750 5.98658 39.168171 3.94
MRAT 0.144668 0.133284 0.176628 45.77677 7.897065 0.6
MYOR 1.156293 0.536241 0.308857 6.11902 17.218846 4.15
SCCO 1.701371 0.629818 0.139534 8.52345 7.080454 1.24
SMSM 0.811857 0.026070 0.339557 10.43895 10.038933 2.92
SQBB 0.189451 0.046695 0.216605 202.34457 35.327734 4.32
TKIM 2.449561 0.710108 0.457483 2.10709 4.782289 0.42
TOTO 0.729975 0.455638 0.355582 23.19520 27.042353 3.26
UNIC 0.856939 0.469062 0.227394 3.58465 3.111525 0.59
UNTR 0.837313 0.554624 0.288157 27.45213 50.872206 3.57
AMFG 0.254240 0.202704 0.444561 21.52481 14.356779 1.47
ASII 1.034851 0.508563 0.158026 19.46131 90.056324 3.43
AUTO 0.474568 0.321833 0.234662 67.95284 23.034558 2.6
BATA 0.457484 0.313886 0.327278 76.69525 44.162154 2.01
BRAM 0.356583 0.262854 0.566972 2.91717 1.765814 0.82
BRNA 1.530241 0.604781 0.554570 3.77530 22.329971 1.6
CTBN 0.700608 0.411975 0.185945 52.50087 7.076302 2.55
DLTA 0.215087 0.177014 0.127627 103.63226 46.543871 6.83
EKAD 0.609207 0.378578 0.311658 10.99285 7.839177 1.27
GDYR 1.772670 0.639337 0.463610 7.72442 1.580986 0.99
GGRM 0.592148 0.371918 0.250289 12.13491 43.147013 4.07
86
Code Debt to Equity
Ratio
Debt To Asset Ratio
Tangibility Interest Coverage
Ratio
The financial Leverage
Mulplier
PBV
IGAR 0.223665 0.182783 0.137852 54.38639 5.949390 1.63
INTP 0.153641 0.133179 0.348722 325.72564 12.362796 4.26
KAEF 0.432522 0.301931 0.216312 41.49549 3.738473 2.85
KLBF 0.269895 0.212533 0.239411 125.63507 18.546551 7.3
LION 0.211067 0.174282 0.070183 39.44912 8.333916 1.45
LMSH 0.713529 0.416409 0.184655 70.20497 13.390417 1.03
MAIN 2.147756 0.682314 0.474852 7.59765 53.093864 5.9
MRAT 0.178736 0.151633 0.175020 36.97067 8.513514 0.54
MYOR 1.721957 0.632617 0.344225 5.17801 21.661047 5
SCCO 1.803298 0.643277 0.151189 10.72580 7.232704 1.27
SMSM 0.696018 0.377027 0.314136 12.26411 10.809519 3.99
SQBB 0.195888 0.163801 0.213759 193.29989 38.783594 7.49
TKIM 2.461533 0.711111 0.439794 1.04714 4.992920 0.35
TOTO 0.761338 0.432250 0.302878 32.05425 30.738534 3.67
UNIC 0.986031 0.496483 0.209352 2.58585 2.752498 0.57
UNTR 0.688487 0.399159 0.302113 25.16999 53.939731 2.27
AMFG 0.267932 0.211314 0.417627 17.10453 16.310567 1.1
BATA 0.481615 0.325061 0.308695 42.13402 52.360385 0.03
BRAM 0.355553 0.261910 0.531659 9.33670 1.832974 0.63
BRNA 1.552377 0.608208 0.568198 0.78926 32.612551 1.03
CTBN 0.638519 0.339215 0.201410 41.57227 7.226255 1.94
DLTA 0.245891 0.197362 0.107352 118.14536 54.146069 8.99
EKAD 0.426695 0.299080 0.304125 14.47163 9.834340 1.15
GDYR 1.349983 0.574465 0.511809 13.79705 1.416818 1.43
GGRM 0.560166 0.359043 0.291291 8.80165 52.773315 2.75
HMSP 0.972250 0.492965 0.171820 267.64757 62.524741 19.32
IGAR 0.290519 0.225118 0.155347 38.13747 64.762757 0.13
INTP 0.171815 0.146623 0.349717 361.19483 14.455618 3.2
KAEF 0.440374 0.305736 0.201722 30.47671 4.450738 2.02
KLBF 0.277593 0.217278 0.258529 94.59789 24.138745 6.89
LION 0.165850 0.142257 0.121229 27.59355 9.584897 1.5
LMSH 0.318103 0.241334 0.164477 33.98305 14.760208 0.7
MAIN 1.639622 0.621158 0.509607 70.62910 65.321504 6.24
MRAT 0.180327 0.152777 0.186754 -6.50064 8.216523 0.53
MYOR 1.706295 0.630491 0.320740 25.17673 21.713780 5.9
SCCO 1.273425 0.560135 0.144375 104.92072 8.570903 1.29
SMSM 0.756862 0.398966 0.289321 13.89743 11.815923 4.93
87
Code Debt to Equity
Ratio
Debt To Asset Ratio
Tangibility Interest Coverage
Ratio
The financial Leverage
Mulplier
PBV
TKIM 2.463882 0.711307 0.442354 0.59310 4.849416 0.25
TOTO 0.695305 0.410136 0.320003 23.15745 35.250686 3.68
UNIC 0.776723 0.437166 0.174323 6.41868 2.985310 0.41
UNTR 0.557268 0.357850 0.254076 21.99574 61.512228 1.99
AMFG 0.282051 0.220000 0.390680 15.21962 18.057101 1.1
AUTO 0.320013 0.242432 0.229886 42.91205 29.837617 1.41
BATA 0.490766 0.286126 0.316465 53.14779 59.607000 0.03
BRAM 0.467681 0.318653 0.566580 9.86387 2.471369 1.3
BRNA 2.678336 0.728138 0.539223 2.23072 3.641310 1.33
CTBN 0.816738 0.449563 0.228717 46.79638 7.271338 0.29
DLTA 0.281547 0.219693 0.114518 71.44578 61.946356 8.17
EKAD 0.445479 0.308188 0.256099 12.37132 11.773319 1.32
GDYR 0.975035 0.493680 0.435921 95.24282 1.699549 1.17
GGRM 0.725924 0.420600 0.325886 6.21431 60.517606 3.51
IGAR 0.394271 0.282780 0.131703 54.47391 71.994650 0.21
KAEF 0.521798 0.342883 0.187973 12.74632 5.344228 4.55
KLBF 0.331190 0.248793 0.274000 52.08781 26.506678 8.74
LION 0.199103 0.166044 0.169315 13.81158 11.536873 1.09
LMSH 0.282697 0.220391 0.211000 14.45729 14.574479 0.53
MRAT 0.163561 0.140569 0.155443 -4.36644 9.323103 2.5
MYOR 1.465201 0.594354 0.348360 14.61191 23.013655 4.56
SCCO 1.490114 0.598412 0.178380 3.32347 8.055175 1
SMSM 0.689615 0.408149 0.281915 19.25143 12.144353 5.96
TKIM 2.263272 0.693559 0.421594 0.45978 4.159925 0.1
TOTO 0.686069 0.406904 0.398126 25.17870 40.925569 3.2
UNIC 0.851532 0.459907 0.183744 2.30476 2.616641 0.34
UNTR 0.609089 0.378530 0.225984 31.76155 64.653976 1.68
AMFG 0.230402 0.187258 0.426880 12.08741 19.678687 0.83
AUTO 0.295139 0.295139 0.244591 2.50542 29.750857 0.75
BATA 0.805784 0.446224 0.295183 57.99139 61.173615 2.12
BRAM 0.725703 0.402284 0.339292 5.32065 2.366404 0.86
BRNA 2.641313 0.725374 0.660205 0.03135 52.776319 0.67
CTBN 0.776486 0.411791 0.299630 9.66376 6.080413 2.37
DLTA 0.297557 0.229321 0.101436 45.16191 64.836758 4.90
EKAD 0.385602 0.256099 0.247876 12.84502 11.153467 0.94
GDYR 1.167591 0.507482 0.465730 1.50444 1.609704 1.53
GGRM 0.752117 0.429262 0.316611 7.04038 66.010924 2.68
88
Code Debt to Equity
Ratio
Debt To Asset Ratio
Tangibility Interest Coverage
Ratio
The financial Leverage
Mulplier
PBV
INTP 0.165431 0.141948 0.499809 190.49806 15.015821 3.36
KAEF 0.646676 0.389814 0.210660 10.35574 5.826835 2.58
KLBF 0.265604 0.209863 0.287557 113.75872 29.218961 5.58
LION 0.351647 0.260162 0.176723 11.74765 12.291026 1.15
LMSH 0.206674 0.171275 0.207793 3.54918 13.935625 0.49
MRAT 0.299111 0.230243 0.142025 1.42920 9.291402 0.24
MYOR 1.509687 0.601544 0.332380 4.91909 25.365384 5.21
SCCO 1.033426 0.508219 0.179336 4.78966 8.624954 0.79
SMSM 0.525409 0.344637 0.322027 23.72136 15.420951 4.67
SQBB 0.245267 0.196960 0.194627 38.52909 50.067652 8.39
TKIM 1.910894 0.656463 0.463933 0.32414 4.118398 0.22
TOTO 0.646606 0.392690 0.358726 21.79415 47.277907 4.74
UNIC 0.644635 0.391962 0.169485 0.92577 2.466206 0.31
89
APPENDIX C
DESCRIPTIVE STATISTICS
Descriptive Statistics
N Minimum Maximum Mean Std. Deviation
PBV 174 .03000 57.92000 4.2352299 7.80534038
DER 174 .14467 17.02404 .9249312 1.44320866
DAR 174 .02607 .86598 .3863069 .17905547
TGB 174 .02160 4.62980 .3168701 .35549947
ICR 174 -6.50064 419.59221 55.5307529 82.17734267
FM 174 .47213 206.15917 31.3360776 36.76733669
Valid N (listwise) 174
90
APPENDIX D
STATISTICAL TEST RESULT
TABLE A
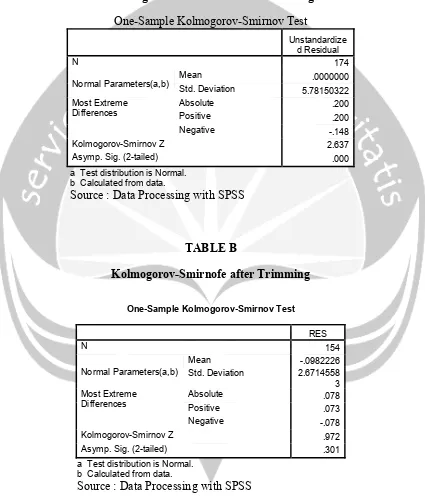
Kolmogorov-Smirnofe before Trimming
One-Sample Kolmogorov-Smirnov Test
Unstandardize d Residual
N 174
Normal Parameters(a,b) Mean Std. Deviation .0000000 5.78150322 Most Extreme
Differences
Absolute .200
Positive .200
Negative -.148
Kolmogorov-Smirnov Z 2.637
Asymp. Sig. (2-tailed) .000
a Test distribution is Normal. b Calculated from data.
Source : Data Processing with SPSS
TABLE B
Kolmogorov-Smirnofe after Trimming
One-Sample Kolmogorov-Smirnov Test
RES
N 154
Normal Parameters(a,b)
Mean -.0982226
Std. Deviation 2.6714558
3 Most Extreme
Differences
Absolute .078
Positive .073
Negative -.078
Kolmogorov-Smirnov Z .972
Asymp. Sig. (2-tailed) .301
a Test distribution is Normal. b Calculated from data.
91
Table C
Source : Data Processing with SPSS
Table D
Model Summary(d)
Model R R Square
Adjusted R Square
Std. Error of
the Estimate Durbin-Watson
1 .710(a) .504 .487 2.26006570
2 .709(b) .503 .489 2.25572932
3 .707(c) .499 .489 2.25577591 2.053
a Predictors: (Constant), FM, DAR, TGB, ICR, DER b Predictors: (Constant), FM, DAR, TGB, ICR c Predictors: (Constant), FM, DAR, ICR d Dependent Variable: PBV
92
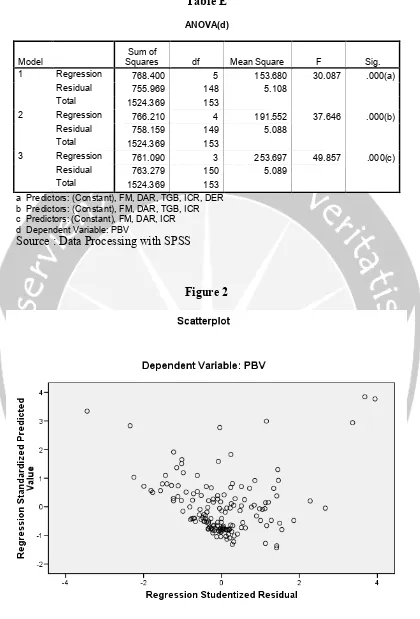
Table E
ANOVA(d)
Model
Sum of
Squares df Mean Square F Sig.
1 Regression 768.400 5 153.680 30.087 .000(a)
Residual 755.969 148 5.108
Total 1524.369 153
2 Regression 766.210 4 191.552 37.646 .000(b)
Residual 758.159 149 5.088
Total 1524.369 153
3 Regression 761.090 3 253.697 49.857 .000(c)
Residual 763.279 150 5.089
Total 1524.369 153
a Predictors: (Constant), FM, DAR, TGB, ICR, DER b Predictors: (Constant), FM, DAR, TGB, ICR c Predictors: (Constant), FM, DAR, ICR d Dependent Variable: PBV