ix
Inventory Model With Gamma Distribution Hadi Sumadibrata, Ismail
Bin Mohd
642
Accuracy Analysis Of Naive Bayesian
Anti-Spam Filter
Ruslam, Armin Lawi, And Sri Astuti Thamrin
649
A New Method For Generating Fuzzy Rules From Training Data And Its Application In Financial Problems
Agus Maman Abadi, Subanar, Widodo, Samsubar Saleh
655
The Application Of Laws Of Large Numbers In Convergence Concept In Probability And Distribution
Georgina M. Tinungki 662
An Empirical Bayes Approach for Binary Response Data in Small Area Estimation
Dian Handayani, Noor Akma Ibrahim, Khairil A. Notodiputro, MOhd. Bakri Adam
669
Statistical Models For Small Area Estimation Khairil A Notodiputro, Anang Kurnia, and Kusman Sadik
677
Maximum Likelihood Estimation For The Non-Separable Spatial Unilateral Autoregressive Model
Norhashidah Awang, Mahendran Shitan
685
Small Area Estimation Using Natural Exponential Families With Quadratic Variance Function (Nef-Qvf) For Binary Data
Kismiantini 691
Using An Extended And Ensemble Kalman Filter Algorithm For The Training Of Feedforward Neural Network In Time Series Forecasting
Zaqiatud Darojah, M. Isa Irawan, And Erna Apriliani
696
Estimation Of Outstanding Claims Liability And Sensitivity Analysis: Probabilistic Trend Family (PTF) Model
Arif Herlambang, Dumaria R Tampubolon
704
Expected Value Of Shot Noise Processes Suyono 711
Modelling Malaysian Wind Speed Data Via Two Paramaters Weibull
Nur Arina Basilah Kamisan, Yong Zulina Zubairi, Abdul Ghapor Hussin, Mohd. Sahar Yahya
718
Application Of Latin Hypercube Sampling And Monte Carlo Simulation Methods: Case Study The Reliability Of Stress Intensity Factor And Energy Release Rate Of Indonesian Hardwoods
Yosafat Aji Pranata And Pricillia Sofyan Tanuwijaya
726
The Development Of Markov Chain Monte Carlo (Mcmc) Algorithm For Autologistic Regression Parameters Estimation
Suci Astutik, Rahma Fitriani, Umu Sa’adah, And Agustin Iskandar
734
A Note About Dh-Fever Estimation With ARIMAX Models Elly Ana, Dwi Atmono Agus W
741
Evaluation Of Additive-Innovational Outlier Identification Procedure For Some Bilinear Models
I
smail, M.I., Mohamed, I.B., Yahya, M.S.
xi
Model By Spectral Regression Methods Iriawan, Suhartono
Application Of Cluster Analysis To Developing Core Collection In Plant Genetic Resources
Sutoro 875
Small Area Estimation With Time And Area Effects Using A Dynamic Linear Model
Kusman Sadik And Khairil Anwar Notodiputro
880
Statistical Analysis Of Wind Direction Data Ahmad Mahir Razali, Arfah Ahmad, Azami Zaharim And Kamaruzzaman Sopian
886
Generalized Additive Mixed Models in Small Area Estimation Anang Kurnia, Khairil A. Notodiputro, Asep Saefuddin, I Wayan Mangku
891
Kernel Principal Component Analysis In Data Visualization Ismail Djakaria, Suryo Guritno, Sri Haryatmi
898
GARCH Models And The Simulations Nelson Nainggolan, Budi
Nurani Ruchjana And Sutawanir Darwis
906
Rainfall Prediction Using Bayesian Network Hera Faizal Rachmat, Aji Hamim Wigena, and Erfiani
911
Identifying Item Bias Using The Simple Volume Indices And Multidimensional Item Response Theory Likelihood Ratio (Irt-Lr) Test
Heri Retnawati 916
Ordinary Kriging And Inverse Distance Weighting For Mapping Soil Phosphorus In Paddy Field
Mohammad Masjkur, Muhammad Nuraidi and Chichi Noviant
924
K-Means Clustering Visualization On Agriculture Potential Data
For Villages In Bogor Using Mapserver
Imas S. Sitanggang, Henri Harianja, and Lailan Syaufina
932
Some Methods To Estimate The Number Of Components In A Mixture
M. A. Satyawan, A. H. Wigena, Erfiani
941
A Probabilistic Model For Finding A Repeat Triplet Region In DNA Sequence
Tigor Nauli 947
Application Of Spherical Harmonics In Determination Of Tec Using Gps Observable
Mardina Abdullah, Siti Aminah Bahari, Baharudin Yatim, Azami Zaharim, Ahmad Mahir Razali
954
Testing Structure Correlation Of Global Market By Statistic Vvsv Erna Tri Herdiani, and Maman A. Djauhari
961
Exploring the MAUP from a spatial perspective Gandhi Pawitan 967
Estimation of RCA(1) Model using EF: A new procedure and its robustness
1Norli Anida Abdullah, 2Ibrahim Mohamed, 3Shelton Peiris
996
Second Order Linear Elliptic Operators In The Unit Square
xii
POSTERStudy Of Fractional Factorial Split-Plot Experiment Sri Winarni, Budi Susetyo, and Bagus Sartono
1012
Improving Model Performance For Predicting Poverty Village Category Using Neighborhood Information In Bogor
Bagus Sartono, Utami Dyah S, and Zulhelmi Thaib
1019
Ammi Models On Count Data: Log-Bilinear Models Alfian Futuhul Hadi H. Ahmad Ansori Mattjik I Made Sumertajaya Halimatus Sa’diyah
1026
Prediction Of Oil Production Using Non Linear Regression By Sdpro Software
(Special Program Package)*)
Budi Nurani R , and Kartlos J. Kachiashvili
1038
An Implementation Of Spatial Data Mining Using Spatial Autoregressive (Sar) Model For Education Quality Mapping At West Java*)
Atje Setiawan A. , Retantyo Wardoyo , Sri Hartati , and Agus Harjoko
1045
Validation Of Training Model For Robust Tests Of Spread
Teh Sin Yin, and Abdul Rahman Othman
1056
Spectral Approach For Time Series Analysis Kusman Sadik 1063
The ACE Algorithm for Optimal Transformations in Multiple Regression
Kusman Sadik 1066
The Relation Between The Students’ Interaction And The Construction Of Mathematical Knowledge
Rini Setianingsih 1069
Application of Auto Logistic Regression Spatial Model using Variogram Based Weighting Matrix to Predict Poverty Village Category
Utami Dyah Syafitri, Bagus Sartono, Vinda Pratama
1063
The 3"* International Conference on Mathematics and Statistics (ICoMS-3) Institut Pertanian Bogor, Indonesia, 5-6 August 2008
SPECTRAL APPROACH FOR TIME SERIES ANALYSIS
Kusman Sadik
Department of Statistics, Institut Pertanian Bogor Jl. Meranti, Wing 22 Level 4, Kampus IPB Darmaga, Bogor 16680 – Indonesia
e-mail : kusmans(a),ipb.ac.id
Key Words
: Spectral analysis, seasonal adjustment procedures, cross spectral, fuzzy logic systems, input signals,
fourier transform, fractal space-time.
1.
Introduction
The first appearance of spectral analysis in the study of macroeconomic time series dates motivated by the
requirement of a more insightful knowledge of the series structure and supported by the contemporaneous
progress in spectral estimation and computation. The first works focused on the problem of seasonal
adjustment procedures and on the general spectral structure of economic data. Cross spectral methods were
pointed out from the outset as being important in discovering and interpreting the relationships between
economic variables. After the early years, the range of application of such analysis was extended to the study of
other econometric issues, among which the controversial trend-cycle separation, the related problem of
business cycles extraction and the analysis of co-movements among series, usefiil in the study of international
business cycles. In particular, cross spectral analysis allows a detailed study of the correlation among series. An
empirical investigation about the possibility that the market is in a self-organized critical state (SOC) show a
power law behaviour in the avalanche size, duration and laminar times during high activity period (Bartolozzi,
Leinweber and Thomas, 2005).
2.
Mathematical Models for Fractal Fluctuations and Deterministic
The larger scale fluctuations incorporate the smaller scale fluctuations as intemal fine scale structure and
may be visualized as a continuum of eddies (waves). Dynamical systems in nature are basically fiizzy logic
systems integrating a unified v^ole communicating network of input signals (perturbations) with
self-organized ordered two-way information transpot between the larger and smaller scales. Self-similar
structures are generated by iteration (repetition) of simple rules for growth processes on all scales of space and
time. Such iterative processes are simulated mathematically by numerical computations such as
X„+i
= F(^«)
where
X„+i
the value of the variable X at (« + i f " computational step is a fiinction F of its earlier value
X„.
The
spectrum of { x }
is defined to be the Fourier transform of
Yx(/^),3. Model Concepts of Universal Spectrum of Fluctuations
A general systems theory was first developed to quantify the observed fractal space-time fluctuations in
turbulent fluid flows. The model concepts are independent of the exact details of the physical, chemical or
other properties and therefore applicable to all dynamical systems. The observed inverse power law form for
power spectra implies that the fi-actal fluctuations can be visualized to result from a hierarchical eddy
continuum structure for the overall pattern. Starting from this simple basic concept that large scale eddies
form as envelopes of intemal small scale eddy circulations the following important model predictions are
derived.
1064
Let Z
tis time series stationer process with autocorrelation
γ
k. Its Fourier
transformation is (Yujima, 1998) :
∑
∞ −∞ =−
= k
iwk ke
w
f γ
π
2 1 ) (
Function
f(w)
is continu function non-negative that representative of spectrum for
autocorrelation function
γ
k. Spectrum of
f(w)
and autocorrelation function
γ
kare unique
Fourier transformation. Generally, spectrum of ARMA(p,q) process can be written
(West, 1999):
) ( ) ( 2
) ( ) ( ) (
2
iw p iw p
iw p iw q a
e e
e e w
f
φ πφ
θ θ σ
− −
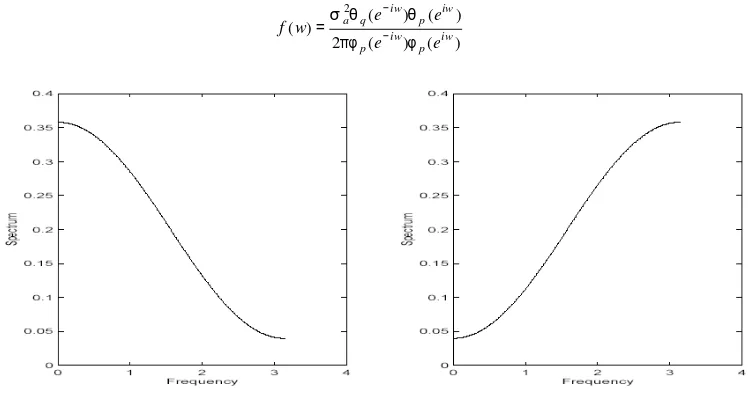
[image:6.595.90.467.218.419.2]=
Figure 1: Plots of the spectrum of MA(1) processes (0 = 0.5 for the left figure and 0 = - 0.5 for the right figure) – Simulated Data
Figure 1 plots the spectrum of MA(1) processes with positive and negative coefficients. When 0 > 0, we see that the spectrum is high for low frequencies and low for high frequencies. When 0 < 0, we observe the opposite. This is because when 0 is positive, we have positive one lag correlation which makes the series smooth with only small contribution from high frequency (say, day to day) components. When 0 is negative, we have negative one lag correlation, therefore the series fluctuates rapidly about its mean value.
Figure 3: Window Functions and Their Frequency Response (Simulated Data). The rectangular
[image:6.595.73.473.535.712.2]1065
respective Fourier transforms (right panel). For the latter, the number of points N = 15 has been chosen rather small to emphasize the differences. Note in the zoom (right panel, inset) the reduced side lobe amplitude and leakage of the Hanning and Hamming windows with respect to the rectangular one, the Hamming window performing better in the first side lobe.
The only way to prevent this effect, would be to choose T (or equivalently N) as a multiple of the largest period that is likely to occur. Unfortunately, this is feasible only if we have some idea of the frequencies involved in the process and would in any case entail some loss of data at one or both sample ends. As for the cutoff fr equencies νl= kl/(N∆t) and νh= kh/(N∆t), given the value of N,
they must be chosen to be multiples of T −1
,otherwise the filter does not completely remove the zero frequency component (i.e. the signal mean) and cannot help in eliminating unit roots.