AERODYNAMIC INVESTIGATION OF A COMMERCIAL VEHICLE USING CFD
MOHD FADHLAN BIN ZAHARI
“I hereby verify that I have read this report and I find it sufficient in term of quality and scope to be awarded with the Bachelor Degree in Mechanical Engineering “
Signature : ………
Supervisor Name : ………
AERODYNAMIC INVESTIGATION OF A COMMERCIAL VEHICLE USING CFD
MOND FADHLAN BIN ZAHARI
This report is submitted to Faculty of Mechanical Engineering in partial fulfill of the requirement of the award of Bachelor’s Degree of Mechanical Engineering
(Automotive)
Faculty of Mechanical Engineering
UNIVERSITI TEKNIKAL MALAYSIA MELAKA
“I hereby to declare that the work is my own except for summaries and quotations which have been duly acknowledge”
Signature : ……….
iii
DEDICATION
To him who is our source of grace, our source of commitment, and our source of knowledge,
And,
ACKNOWLEDGMENT
All praises to the Almighty Allah, for giving me the strength, patience and guidance throughout the process of completing this investigation. I am grateful to have the morally and physically support from many people throughout completing this study. For this opportunity, I would love to thank whose are either directly or indirectly involved during the process of this research is conducted.
Most immediately, I would like to express my very special gratitude and appreciation to my supervisor, Mr. Ahmad Kamal Bin Mat Yamin for his valuable suggestion, comments and advice in every stage of this project. All the discussion makes me understand every detailed in this road vehicle aerodynamic analysis. My token of appreciation also goes to all the lecturers from Faculty of Mechanical Engineering especially from Automotive Department for being very nice and making this study easier to be completed.
v
ABSTRACT
ABSTRAK
vii
TABLE OF CONTENT
CHAPTER CONTENT PAGE
DECLARATION ii
DEDICATION iii
ACKNOWLEDGEMENT iv
ABSTRACT v
TABLE OF CONTENT vii
LIST OF TABLES x
LIST OF FIGURES xi
CHAPTER 1 INTRODUCTION
1.1 Research Background 1
1.2 Objective 3
1.3 Research Scope 3
1.4 Research Approach 4
1.5 Problem Statement 4
1.6 Limitations 5
1.7 Significant of Research 5
CHAPTER 2 LITERATURE REVIEW
2.1 Introduction 7
2.2 Previous Research 7
and Moment. 11 2.4 Theory of Road Vehicle Aerodynamic 12
2.4.1 Drag Force 13
2.4.2 Lift Force 15
2.4.3 Boundary Layer 17
2.4.4 Air Flow around the Vehicle Body 18 2.4.5 Pressure Distribution 21
2.4.6 Reynolds Number 24
2.5 Facilities and Instrumentation 24
2.6 Summary 25
CHAPTER 3 METHODOLOGY
3.1 Introduction 26
3.2 Process Flow 27
3.2.1 Process Flow on Literature Review
and Methodology 28 3.2.2 Process Flow on Model development
and Experiment 28 3.3 Model Development for Wind Tunnel Test 29
3.4 Wind Tunnel Calibration 32
3.5 Experimental Procedures 34
3.5.1 Procedure for Drag Force Measurement 35
3.6 Model Development for CFD 36
3.6.1 CAD Model Drawing and Gambit Meshing 36
3.6.2 Mesh Quality Check 39
3.6.3 Mesh Quality at Equiangle Skew 40 3.6.4 Mesh Quality at Aspect Ratio 41 3.7 The FLUENT 6.2.16 Simulations 42
ix
CHAPTER 4 RESULTS AND DISCUSION
4.1 Introduction 45
4.2 Results for Wind Tunnel Test 45
4.2.1 Qualitative Result 45
4.2.1 Quantitative Result 47
4.3 Result for CFD 49
4.3.1 Pressure around the Articulated Truck 50 4.3.2 Velocity around the Articulated Truck 52
4.4 Reynolds Number 54
4.5 Discussion 55
4.5.1 Drag Coefficient 55
4.5.2 Lift Coefficient 56
4.5.3 Pressure Coefficient 56
4.5.4 Drag Force 56
4.5.5 Lift Force 56
4.6 Summary 57
CHAPTER 5 CONCLUSION AND RECOMMENDATIONS
5.1 Conclusion 58
5.2 Recommendations 59
REFERENCES 60
LIST OF TABLES
NUMBER TITLE PAGE
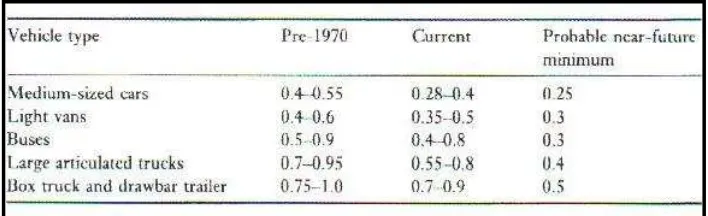
1.1 Approximate ranges of drag coefficient values for
various type of vehicle. 2
2.1 Force and moment on road vehicle 11
2.2 Drag Coefficients for various classes of vehicle 14
3.1 List of tools and materials 29
4.1 Data sheet for wind tunnel test 48
4.2 Result for drag force at 30 m/s. 49
xi
LIST OF FIGURES
NUMBER TITLE PAGE
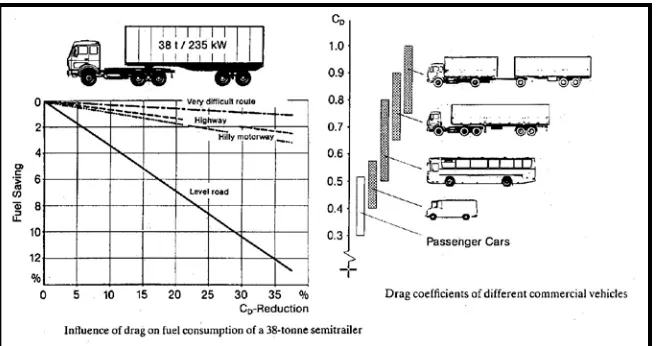
2.1 Effect of Drag Coefficient Reduction on Fuel Consumption 8
2.2 Road vehicle axis system 11
2.3 Comparison of low and high aerodynamic drag forces
with rolling resistance 12
2.4 Effects of underfloor to ground clearance on air speed,
pressure and lift force 15
2.5 Lift and drag coefficient versus angle of inclination (attack) 16
2.6 Boundary layer velocity gradient Source 17
2.7 Boundary layer growth on the roof of a bus 18
2.8 Streamline air flow around a car 19
2.9 Comparison of air flow conditions with both sharp and rounded roof leading edge cab with various trailer body heights 19
2.10 fore body coach streamlining 20
2.11 Pressure distribution above and below the body structure 22 2.12 Trailer floe body pressure distribution with and without
roof deflector 23
2.13 Open circuit wind tunnel 25
3.1 Truck model 30
NUMBER TITLE PAGE
3.3 Prospect 30
3.4 Screw driver 30
3.5 Jigsaw 30
3.6 Tape 30
3.7 Calibration graph for lift force 32
3.8 Calibration graph for drag force 33
3.9 Drag force calibration 33
3.10 Wind velocity calibration 34
3.11 Wind tunnel open circuit 35
3.12 The truck container model drawing 37
3.13 3D truck container model drawing 37
3.14 Truck container model with wind tunnel 38
3.15 After import from CAD to GAMBIT 38
3.16 Meshing process 39
3.17 View of X-axis Equiangle skew 40
3.18 View of Y-axis Equiangle skew 40
3.19 View of Z-axis Equiangle Skew 41
3.20 View of X-axis aspect ratio 41
3.21 View of Y-axis aspect ratio 41
3.22 View of Z-axis aspect ratio 42
3.23 Windows in FLUENT 43
3.24 Windows in FLUENT 44
3.25 Scaled Residual graph 44
4.1 Effected flow at the articulated gap section 46 4.2 Body flow fields of articulated tractor-trailer 46 4.3 After Body wool turf flow fields of truck 47
xiii
NUMBER TITLE PAGE
4.5 Contour of static pressure 50
4.6 Adverse pressure Gradient at front 50
4.7 Adverse pressure gradient at Rear 51
4.8 Pressure characteristic at front vehicle 51
4.9 Vectors of velocity magnitude 52
4.10 Separations detailed at front 53
4.11 Wake detailed at rear 53
CHAPTER 1
INTRODUCTION
1.1 Research Background
Aerodynamics is the study of a solid body moving through the atmosphere and the interaction which takes place between the body surfaces and the surrounding air with varying relative speeds and wind direction. The study on road vehicle aerodynamic is quite different from the aircraft aerodynamic study. There are no simple formulate that used in earlier day for determining the drag and lift forces of an aircraft that equivalent to calculate drag and lift of a road vehicle. The aerodynamics of road vehicle does not lend itself readily to mathematical analysis and there are no straightforward methods to predicting the air flow around the vehicle shape.
The aerodynamic of road vehicle research is very important due to promote economic fuel consumption, optimum performance also to improve stability and handling in term of safety. The constant air flow are needed for better fuel economy, greater vehicle performance, reduction in wind noise level and improved road holding and stability for a vehicle on the move.
2 study are primarily deal with zero-yaw flow fields. However, the non-zero yaw flows are still important with respect to real world fuel economical and stability, but in keeping the study objectives of symposium, the investigation coverage has been restricted to an in-depth analysis of zero-yaw flow. The study will include the aerodynamic characteristic for truck container body under zero-yaw flow such as drag and lift force.
[image:17.612.156.510.328.436.2]A modern Class 7-8 tractor-trailer can weigh up to 8 tons and has a wind-averaged drag coefficient around CD=0.60 to 0.80. The drag coefficient is defined as the drag/ (dynamic pressure x projected area).
Table 1.1: Approximate ranges of drag coefficient values for various type of vehicle. Source: Barnard, R.H. [2001]
Aerodynamic characteristic usually not obvious at low vehicle speed but the magnitude of air resistance becomes considerable with rising speed. The higher the speed the more energy consumed in overcoming aerodynamic drag. The common highway speed today is at 110 km/h, to overcoming aerodynamic drag represents about 65% of the total energy expenditure for a typical heavy truck vehicle. Reduced fuel consumption for heavy vehicles can be achieved by altering truck shapes to decrease the aerodynamic resistance (drag). It is conceivable that present day truck drag coefficients might be reduced by as much as 50%.
estimates for 1992 [1]. For a typical Class 8 tractor-trailer powered by a modern, turbocharged diesel engine operating at a fixed specific fuel consumption, bsfc=0.34 pounds/HP-hr., reducing the drag coefficient from 0.6 to 0.3 would result in a total yearly savings of 4 billion gallons of diesel fuel for travel at a present day speed of 70 miles per hour. The mileage improvement is from 5.0 miles per gallon to 7.7 miles per gallon - a 50% savings. (For travel at 60 miles per hour, the equivalent numbers would be 3 billion gallons of diesel fuel saved, and a mileage improvement from 6.1 miles per gallon to 8.7 miles per gallons.)
References: Highway Statistics 1992, p 207, US Government Printing Office,
SSOP, Washington DC 20402-9328.
1.2 Objective
The objective of this research is to carry out CFD simulations of aerodynamics over an articulated truck model and validate with the experiment data to gain further understanding in aerodynamic characteristics.
1.3 Research Scope
i. Develop a CFD model and perform zero –yaw characteristic study of aerodynamics of a truck container.
4 1.4 Research Approach
This research used the Mercedes-Benz Actros truck container model from Welly Die Casting Fty Ltd. The main thing of this research is to make the numerical model to test using Computational Fluid Dynamics (CFD). The results will be validating with the experimental result in order to understand further the aerodynamic characteristics over the commercial vehicle. The research will conducted using GAMBIT 2.2.30 and FLUENT 6.2.16 software, where GAMBIT as a modeler and FLUENT as for simulate. The research also used the wind tunnel facility to investigate the aerodynamic characteristics of the truck container model. The wind tunnel that used in this investigation is from the model MP 130D subsonic tunnels (Essom Company Limited). There is only one things to test that will be execute by using wind tunnel, which is the drag force measurement. The two load component balances are used to measured the drag force. The model is attached with the centre of the test section and a horizontal plate. This plate is needed to create the ground effect during the testing.
1.5 Problem Statement
To design a new vehicle model, the designers have to focus and consider two main characteristics when they designing a vehicle model. The two important things are, first, the segmentation of the model and second, the aerodynamic characteristic. The segmentation can be defined as hatchback, sedan, SUV, MPV, semi trailer van, truck, tanker and flatbeds or any segment related. However, the aerodynamic characteristic only can be determined through experimental or computational method. For this research both method are used.
main subject of this research. As a solution, a wind tunnel testing and CFD simulation will be used to measure the aerodynamic characteristic.
2. Since not much people understand the aerodynamic characteristic for the commercial vehicle especially for articulated one. Through this study, it will define how the aerodynamic characteristics of this articulated truck in order to further understanding.
1.6 Limitations
Limitation is problems that occur during completing this investigation and we cannot avoid it. There are a few limitations during the wind tunnel experimental test and listed as follows:
1. The maximum speed can be used of the wind tunnel approximately 30m/s ≈ 108km/h because it is a subsonic downstream fan type. 2. There are no smoke provide to observe the streamline. As a solution,
wool turf is use to observe the flow over the whole body.
3. Since the wind tunnel test section is a 1ft x 1ft, the wind tunnel size is not suitable for scale model within the range 1:1 to 1:10 due to
blockage factor. The maximum scale model can be used for road vehicle is 1:20.
1.7 Significant of Research
CHAPTER 2
LITERATURE REVIEW
2.1 Introduction
Literature review is about to understand the theory of the research. The literature review is very important part to understand first in any research. Since we know the theory of the research, we can proceed it easily. It is will be easy to determine the way of the research will be implementing and also the related theory that has used in previous research. The information about the research can be found through the journal, internet, thesis and reference books. In this research case, all the information and theory that related to the road vehicle aerodynamic or heavy road vehicle aerodynamic are needed. In this chapter will discus about previous research, fundamental of Vehicle Aerodynamic Force and Moment, theory of road vehicle aerodynamic, theory of wind tunnel method.
2.2 Previous Research
8 Improve the Performance, Economics, Handling and Safety of Heavy Vehicles by Robert, J. E [2001], The Research is being conducted at the Georgia Tech Research Institute (GTRI) to develop advanced aerodynamic devices to improve the performance, economics, stability, handling and safety of operation of Heavy Vehicles by using previously developed and flight-tested pneumatic (blown) aircraft technology. Recent wind-tunnel investigations of a generic Heavy Vehicle model with blowing slots on both the leading and trailing edges of the trailer have been conducted under contract to the DOE Office of Heavy Vehicle Technologies. These experimental results show overall aerodynamic drag reductions on the Pneumatic Heavy Vehicle of 50% using only 1 psig blowing pressure in the plenums, and over 80% drag reductions if additional blowing air were available. Additionally, an increase in drag force for braking was confirmed by blowing different slots.
Figure 2.1: Effect Of Drag Coefficient Reduction on Fuel Consumption.
Source: Huncho, W.H. [1990]
a discussion of additional applications to conventional commercial autos, buses, motor homes, and Sport Utility Vehicles.
In another research, the title Aerodynamic Drag of Heavy Vehicles (Class 7-8): Simulation and Benchmarking by McCallen, R. et al. [2001] describes research and development for reducing the aerodynamic drag of heavy vehicles by demonstrating new approaches for the numerical simulation and analysis of aerodynamic flow. Experimental validation of new computational fluid dynamics methods are also an important part of this approach. Experiments on a model of an integrated tractor-trailer are underway at NASA Ames Research Center and the University of Southern California (USC). Companion computer simulations are being performed by Sandia National Laboratories (SNL), Lawrence Livermore National Laboratory (LLNL), and California Institute of Technology (Caltech) using state-of-the-art techniques.
The research title Vehicle Dynamics Model For Predicting Maximum Truck Acceleration Levels done by Rakha, H. et al. [1999] presents a simple vehicle dynamics model for estimating maximum vehicle acceleration levels based on a vehicle’s tractive effort and aerodynamic, rolling, and grade resistance forces. In addition, typical model input parameters for different vehicle, pavement, and tire characteristics are presented. The model parameters are calibrated/validated against field data that were collected along the Smart Road test facility at Virginia Tech utilizing a truck and trailer for 10 weight-to-power configurations, ranging from 85 kg/kW to 169 kg/kW (140 lb/hp to 280 lb/hp). The model was found to predict vehicle speeds at the conclusion of the travel along the section to within 5 km/h (3.1 mi/h) of field measurements, thus demonstrating the validity and applicability of the model.