TOURISM IN MICHIGAN
*
GREGORY VEECK, LUCIUS HALLETT IV, DEBORAH CHE, and ANN VEECK
Family farms have long generated income from agricultural tourism including U-picks, wagon rides, corn mazes and petting zoos, but contemporary agricultural tourism reflects much greater sophistication in terms of product variety, services, activities, and marketing. In Michigan, farm operators have moved beyond classic products and activi-ties and the traditional consumer base. New sources of revenue derive from classes on beer, cider, mead and wine making, yarn spinning, perfume/soap-making, farm markets, fishing, educational classes, school tours and hospitality including weddings and on-farm restaurants. This case study of Michigan agricultural tourism reports results from a sys-tematic survey of 154 agritourism operations conducted throughout the state during summer and fall of2013 with a focus on the economic benefits of the fast-changing sec-tor. This study summarizes tax revenues, sales and employment trends for the farm operations participating in the survey but also quantitatively assesses the contribution of agricultural tourism to Michigan’s economy through an extrapolation of the sample to estimate state-wide totals. Results from OLS multivariate regression analysis intended to identify relationships between employment, advertising and scale to gross sales per day are also reported. These analyses show the importance of agricultural tourism to rural and peri-urban places in Michigan and throughout the nation, while raising concerns about a growing division between large and small operators and what this growing gap may mean for the future of the sector. Keywords: Agricultural tourism, Economic Evaluation, Rural Development, Michigan.
AGRICULTURAL TOURISM AND FAMILY FARMS
B
ig and small, family farms dominate American agriculture in terms of pro-duction value, land under cultivation, and absolute numbers (Nelson 2010; Lowder, Skoet, and Singh 2014). Ninety-seven percent of all U.S. farms are family owned (Hoppe 2014). Of a total of 2.1 million U.S. farms surveyed in the 2012 United States Department of Agriculture (USDA) agricultural census,90 percent self-reported as small family farms with less than $350,000 in sales, while 75 percent have gross sales below $50,000. Off-farm income then is quite
*Research was supported through a generous MDARD Specialty Crop Block Grant-Farm Bill2012 (Grant #791N3200132) with funds originating in the USDA/Agricultural Marketing Service, and additional funding via Western Michigan University’s Department of Geography Lucia Harrison Endowment Fund. We are grateful for this support, and also for the considerable efforts of Mr. Karl Schrantz, Ariana Toth, and especially Cameron Tarnas for building and checking the agritourism mailing list. Jason Glatz and Johnathan F. Kennedy provided cartographic contributions to this article and the project.
kDR. GREGORY VEECKis a professor of geography at Western Michigan University, Kalamazoo, Michigan 49008-5424; [veeckg@wmich.edu]. DR. L. HALLETTIV is an associate professor of geo-graphy at the same institution; [lucius.hallett@wmich.edu]. DR. CHEis a lecturer in the School of Business and Tourism of Southern Cross University, Coolangatta, Queensland 4225, Australia; [deborah.che@scu.edu.au]. DR. ANN VEECK is a professor of marketing, Kalamazoo, Michigan 49008-5430; [ann.veeck@wmich.edu].
Geographical Review106(3):421–440, July2016
important and 52.2 percent of farm operators reported off-farm work as the main source of family income (Martin2009; MacDonald 2013; Hoppe2014).
Global trade in food and agricultural products has radically altered the farm sector in all nations, but particularly those for nations, large and small, where domestic markets are significantly influenced by high shares of agricultural imports or exports (Mazoyer and Roudart 2006). As farm families adjust their operations to compete in the post-World Trade Organization (WTO) environ-ment, scholars argue that farms in most nations are increasingly split or “bifur-cated” into two distinct groups: large-scale operations increasingly producing the vast share of land-extensive agricultural commodities such as grain, cotton and soybeans, and the vast majority of farms that still grow commodities but also produce a more diverse mix of public and private goods (Coleman, Grant, and Josling 2004; MacDonald 2013). The middle, in terms of both sales and farm size, is disappearing (McDonald, Korb, and Hoppe 2013). Smaller farms once able to remain solvent producing grain, grain/dairy mix, or horticultural crops for sale to wholesale buyers or cooperatives are facing increasingly com-petitive markets. As a consequence, many small farms in the U.S. and Canada now diversify their activities by including direct sales so as to remain solvent (Knowd 2006; King 2014). So, despite the fact that many studies find profitabil-ity is often related to farm size or scale (Hoppe, MacDonald, and Korb 2010; Bowman 2011; Caldwell 2011), the small farm persists and the absolute number in the U.S. has increased over the past decade (Gregson and Gregson 2004; Ferdman2014; USDA2014; DWELL 2015).
However, the activities that constitute important sources of income for many farm families have changed dramatically in the past several decades, as small U.S. farms work to develop and exploit niche markets (Coleman, Grant, and Josling
2004; Bagi and Reeder2012). From a structural perspective, in response to higher production costs, shortages of affordable labor, and volatile prices for staple crops, many small family farms throughout the U.S. survive through the develop-ment of new production systems and marketing strategies. These new strategies include specialized production (organic, local-branded, or seasonal crops such as hops, Christmas trees, pumpkins, and gourds), alternative off/on-farm retail sales options (farmers’ markets, business-to-business sales in the hospitality sector, weddings, bed and breakfasts, and cooperatives), and direct selling (community-supported agriculture and agricultural tourism) (Khanal and Mishra 2006; Knoud2006; Youssef2009; King2014). Thirty-three thousand farms completing the 2012 United States Agricultural Census self-reported offering some type of agricultural-tourism activities to on-farm customers (USDA 2014). Many small farms that are uncompetitive due to limitations of labor, financial resources, or scale have turned to agricultural tourism to keep land in agriculture (Mace2004; Sharpley and Vass2006; Bagi and Reeder2012).
such as U-pick fruit and vegetables, corn/sorghum mazes, haunted houses, pet-ting zoos, and fish ponds, but now visitors to agricultural-tourism operations might also brew beer and cider, produce cheese, make soap or organic yarn, blend perfumes, create chocolates, or bottle wine, with all the ingredients and training provided on the farm. Taken together, all of these activities represent a fast-growing and profitable component of the U.S. tourism sector with signifi-cant horizontal linkages to other tourism-related businesses (Che, Veeck, and Veeck 2005; Che 2006). Using data from the 2012 Agricultural Resource Management Survey (ARMS), Bagi found that compared to other farmers, “agritourism farmers are more likely to have a college degree (45percent versus
25 percent), use the Internet for business (78 percent versus 64 percent), and draw on paid management advice (72 percent versus42percent)” (2014,1).
Agricultural tourism continues to have commercial, ecological, social, and cultural impacts, and more information is needed to determine the actual economic contributions of this industry to government revenues, agricul-tural-tourism business operators, and their employees (Che 2006). The pur-pose of this article is to explore and summarize the state of contemporary agricultural tourism through a case study of Michigan, so as to understand the economic contributions of these activities. The findings are based on analyses of a systematic survey of 154 agricultural-tourism operations con-ducted throughout the state of Michigan during the summer and fall months of 2013 (Figure 1).
The article has four coming sections. In section two, we explore the types of products and activities now included under the agricultural tourism “umbrella” and discuss theoretical issues related to the difficulty of “brand-ing” agricultural tourism. Section three introduces the research design of the case study and details the types and relative share of particular activities, goods, and services that now constitute Michigan’s agricultural-tourism sec-tor. Section four incorporates a quantitative assessment of the contribution of agricultural tourism to Michigan’s economy through an extrapolation of our sample and the use of Ordinary Least Squares (OLS) multivariate regression analysis. We conclude by discussing the implications of our results and some of the new challenges and opportunities related to agricultural tourism in Michigan.
AN EXPANDING DEFINITION OF AGRICULTURAL TOURISM
farms from “Right to Farm” legislation, subsidized insurance programs, signage permits, entrepreneurship classes, extension support programs, association advertising, health department regulations, and even liability insurance programs (Bagi and Reader 2012; Barbieri 2013; Rogerson and Rogerson 2014; Barbieri et al., 2015; Knowd 2015). What to call these activities matters to con-sumers, but more importantly—in a legal sense—to farm operators and those
that manage them.
the owner” (2011). According to Barbieri: “The agriculturalist literature places agricultural tourism within the farm enterprise diversification grand scheme—
as entrepreneurial ventures resulting from the reallocation and recombination of farm land, labor or capital for the purposes of enhancing farm revenues or values” (2013, 253). This is a useful point of departure, as agricultural-tourism operations are increasingly branching out into new marketing venues—some
duplicated on- and off-farm—while providing many new on-farm products
and services as compared to even a decade ago.
The diversity of on-farm activities that are now conventionally incorporated into definitions of agricultural tourism makes the development of an inclusive “umbrella” term that could effectively serve as a “brand” very difficult. In an important new study where 797 farmers and 1,119 residents (actual and potential customers) of Missouri and North Carolina were asked to evaluate eight potential terms (agritourism, farm tourism, agricultural tourism, rural tourism, farm visits, and agritainment) on four dimensions (memorability, dis-tinctiveness, relevance, and flexibility), Barbieri and colleagues found that a majority of both operators and customers preferred farm visit, farm tourism, or agricultural tourism to other options including agritourism, agrotourism and the despised agritainment (2015). Barbieri and her colleagues caution that the lack of a single sector-wide consensus term inclusive of all of the activities that might be associated with agricultural tourism or farm visits “diminishes marketing effectiveness and hinders stakeholder collaboration” (2015,1).
Presumably, as the sector continues to expand and mature, a consensus term will emerge. In this article, we opt for agricultural tourism, which we define as any and all retail enterprise at a working farm conducted for the enjoyment of visitors that generates income for the owners (University of Cali-fornia 2011). Regardless of the preferred term, a wealth of literature documents the growing importance of this sector with respect to small farm economics throughout North America and Europe (Knowd 2006; Hoppe 2014). Findings consistently indicate that agricultural tourism is providing the additional income needed to compensate for the fluctuations in wholesale agricultural prices and/or allows families to continue farming when farm scale and/or labor is limited and wholesale sales are insufficient (McGehee and Kim2004; Barbieri and Mahoney 2009; Bagi 2014; Newton 2014; Schilling, Attavanich, and Jin
2014).
PROJECT DESCRIPTION
This case study is based on a survey of agricultural-tourism operations in Michigan conducted from May to November of 2013. The survey was preceded by qualitative research, consisting of a set of focus groups and a series of inter-views, to help define the main issues as seen from the perspective of Michigan’s agricultural-tourism farms. Coordinated by the Michigan Agritourism Associa-tion (MATA), three focus groups, each consisting of seven to ten specialty crop agricultural-tourism operators, were convened in Lansing, Traverse City, and Kalamazoo. In addition, site visits were made to sixteen operations around the state, resulting in longer, recorded depth interviews. The questionnaire was informed by results from the focus groups and interviews, combined with a review of current literature.
The six page survey had four sections: basic information on the firm (opening/closing dates, hours of operation, inventory of products sold, number of full-time and part time staff, and advertising costs and venues); Likert-type scale items on the benefits of respondent operations to customers; Likert-type scale items related to problems and benefits of direct on-farm sales; and perceived economic benefits of their agricultural-tourism operations to the state, the operators of the business, and employees (income, revenues, wages). Pretests indicated the survey required about thirty minutes to complete. The questionnaire was designed so that it could be sent via regular mail or the Internet (via a link to the Qualtrics website) to agricultural tourism farm oper-ators. Prior to conducting the survey, a statewide address list of agricultural-tourism operations was developed. Identifying agricultural-agricultural-tourism operations is an important challenge for all states, including Michigan. As is the case in the majority of states, there is no census of agricultural-tourism operations in Michigan. One estimate by Sandra Hill of the Michigan Department of Agricul-ture and Rural Development (MDARD) in 2003 placed the number of agricul-tural-tourism operations in Michigan at approximately 4,000 (Veeck, Che, and Veeck2006). Using all of Michigan’s regional Chamber of Commerce websites, urban “Yellow Page” directories, specialty crop growers’ directories, and other on-line guides, we ultimately identified 2,974 farms reporting agricultural-tour-ism activities with active addresses where we could send the survey. Of course, there are many very small “cash and carry” operations that do not advertise or choose to list in a directory.
The survey was sent to 2000 “snail mail” addresses and 974 on-line addresses of agricultural-tourism operations. Respondents were given a choice as to which format was used and the U.S. Mail version also provided the web link to the Qualtrics on-line survey. A single incentive, a drawing for an Apple I-pad or a $500.00 cash option, was offered to encourage participation via a drawing. Ultimately, a total of 154 usable surveys (162 total) were returned, resulting in a response rate of 5.44 percent (60 percent paper, 40
After data entry, each operation was assigned to one of twelve categories and descriptive statistics related to sales, employment, and taxes for each group were calculated. Once this step was completed, extrapolation for statewide esti-mates for a set of employment and sales variables were calculated based on the published2003 MDARD estimate of4,000agricultural-tourism operations cited above. Twelve years later, there are probably many more operations than this number, but the extrapolations reported in section four of the article are made using this conservative estimate (Veeck, Che and Veeck2006).
In addition to the creation of tabular and graphic summaries with associated univariate statistics for the agricultural-tourism operations that participated in the survey, OLS multiple linear regression analysis was conducted to determine the relationship between gross sales per day of opera-tion and standard econometric variables, such as advertising costs, payroll, days of operation, and sources of sales (types of products). The goal of this portion of the research was to identify factors that partially account for firm success as measured by sales. Several other recent studies have also adopted this identical approach with the same goal in other locations (Schilling, Attavanich, and Jin
2014; Hung, Ding, and Lin 2015). The standardized dependent variable—gross
receipts per day of operation—was created in recognition of the great range in
the number of days of operation across the many types of agricultural-tourism operations. For example, Christmas-based operations (trees, wreaths, ornaments, sleigh rides) generate all retail revenue in seventeen to ninety days, while most farm market destinations operate for seven to twelve months. Standardizing gross sales per diem allows for comparison across different types of operations. The independent variables include: mean advertising costs per day of operation (adjusted per diem for the same reason as above), the percent of sales from off-farm products (food and non-food items retailed on site, but not produced by the operators), the number of days open to the public, and annual wages. In addition, a dummy variable (annual sales above $20,000 = 1, less than $20,000= 0) was added to the model to determine the presence or absence of scale effects on daily revenue.
RESULTS OF ANALYSES
Analysis of the survey underscores both the diversity of agricultural-tourism activities and the importance of these family operations to Michigan’s rural and peri-urban economies. Extrapolating the results to4,000operations in sim-ilar proportions with respect to the types of the operations participating in the survey, results indicate the economic impact of agricultural tourism is signifi-cant in terms of income, wages, employment, and tax revenues.
DIVERSITY OF AGRICULTURAL-TOURISM OPERATIONS IN MICHIGAN
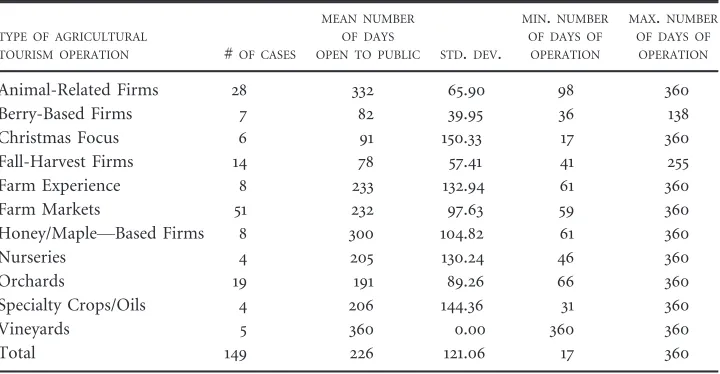
these twelve categories based on qualitative descriptions of their operation and a list provided by each respondent of the top ten sources of revenue for each operation. These same categories are used in subsequent analyses as well. For privacy concerns, a single aquaculture/fishing operation is excluded from analy-sis. Table 2 provides the mean days (out of 365) of operation and related descriptive statistics for each of the twelve types of operation. Large standard
TABLE1—TYPES OFFIRMSPARTICIPATING IN THE2013WESTERNMICHIGANUNIVERSITY/MATA AGRICULTURALTOURISMSURVEY
FIRM TYPES NUMBER OF FIRMS PERCENT OF TOTAL
Animal-Related Firms 28 18.4
Berry-Based Firms 7 4.6
Christmas Focus 6 3.3
Fall-Harvest Firms 14 9.2
Farm Experience 8 5.3
Farm Markets 51 33.6
Fishing and Fish 1 0.7
Honey/Maple–Based Firms 8 5.3
Nurseries 4 2.6
Orchards 19 11.8
Specialty Crops and Essential Oils 3 2.0
Vineyards 5 3.3
Total 154 100.0
Source: Compiled from the2013Western Michigan/MATA Agricultural Tourism Survey.
TABLE2—MEANDAYS OFOPERATION ANDRELATEDSTATISTICS FORELEVENTYPES OF AGRICULTURAL-TOURISMOPERATIONS INMICHIGAN2013
TYPE OF AGRICULTURAL
TOURISM OPERATION #OF CASES
MEAN NUMBER OF DAYS
OPEN TO PUBLIC STD.DEV.
MIN.NUMBER OF DAYS OF OPERATION
MAX.NUMBER OF DAYS OF OPERATION
Animal-Related Firms 28 332 65.90 98 360
Berry-Based Firms 7 82 39.95 36 138
Christmas Focus 6 91 150.33 17 360
Fall-Harvest Firms 14 78 57.41 41 255
Farm Experience 8 233 132.94 61 360
Farm Markets 51 232 97.63 59 360
Honey/Maple—Based Firms 8 300 104.82 61 360
Nurseries 4 205 130.24 46 360
Orchards 19 191 89.26 66 360
Specialty Crops/Oils 4 206 144.36 31 360
Vineyards 5 360 0.00 360 360
Total 149 226 121.06 17 360
[image:8.504.73.433.103.286.2] [image:8.504.73.433.345.532.2]deviations indicate the unique quality of these operations as each farm family accommodates off-farm work schedules, available capital, and seasonal-product availability.
Animal-related firms (wool products, weaving, classes, dairy, and [often] organic meat), honey/maple syrup firms (candle making, royal jelly, candy classes as well as product sales), and vineyards (wine tasting, tours, winemaking classes, and wine-related retail) operate year round. The number of animal-related firms (n=28/154) was greater than we anticipated, but reflects a growing direct sales trend (organic free-range meat and poultry) also identified in the U.S. Agricultural Census (USDA 2014). Another striking outcome is the proportionally large number of farm market and farm-experience operations that offer a more diverse product base over more “open days” than many other types in the sample. Farm market/farm-experience operations often combine on-farm sales of spring, summer, and fall produce with activities such as a petting “zoo,” hay rides, playgrounds, corn mazes, and cooking classes. The distinction between the two categories is that farm-experience operations place greater marketing emphasis than farm market operators on links to educational opportunities such as hosting school groups and retirement home visitors, usu-ally with cider, meals, or snacks. Both of these types often report additional retail sales of products produced or manufactured off-farm such as soaps, can-dles, syrup, honey, jams, jellies, and souvenirs. Some, but not all, of these off-farm products reflect horizontal linkages to other local agricultural-tourism operations. For example, a farm might sell chocolates or honey made at a nearby operation in exchange for the inclusion of their products at the other farm. On the other hand, many Christmas-focused operations report the sale of lights and ornaments made in China and purchased wholesale.
Farm market operations, in contrast to more specialized operations built around U-pick berries, fall harvest, or Christmas-focused farms, operate for longer periods and stock a more diverse product base. Even more traditional agricultural-tourism operations, such as an apple U-pick, offer a far more diverse set of products and services than in the past. A decade ago, it was com-mon for such operations to report selling apple pies, tarts, jellies, cider, candied apples, and donuts for 90 to 100 days (Veeck, Che, and Veeck 2006). At pre-sent, a similar farm continues to sell all of this, but also markets unpasteurized juice for home cider makers and cider-making supplies, while offering classes on cider making and pie/tart baking. On average, an orchard-based agricul-tural-tourism operation is now open over200 days despite the brief period that fruit can actually be picked (Table 1). Similarly, Christmas-focused operations
—once open only thirty to forty-five days—are now open for three months,
combining sales of ornaments, stockings, candy, and visits with Santa, with sales of trees, wreaths, and garlands.
classes; classes for making sachets, rose oil, perfume, flower arranging, or soap). One operation selling lavender and offering classes in soap and perfume mak-ing also reported the operation of a health spa, complete with yoga classes. Operations are not only open longer and offer more products and activities than in the past, but many have increasingly “gone hybrid” by also participat-ing in off-farm farmers’ markets, typically two or three days a week. Beyond increased revenues, many operators responding to an open-ended question on sales venues wrote that selling at farmers’ markets and community centers helped expand their “brand,” which promoted increases in on-farm visits. Several farm-experience operations reported adding community-supported agriculture (CSA) on-farm to take advantage of visitors’ familiarity with their farm as well. Some farm-experience/CSA operations also offered classes in veg-etable and flower gardening, while selling transplants, home-gardening supplies, and organic fertilizer (manure). Others offer regular cooking/baking classes or season-specific special local-sourced meals (Easter dinner, Christmas dinner, summer-garden harvest) on-site or at a nearby bed-and-breakfast.
THE ECONOMIC CONTRIBUTIONS OF AGRICULTURAL TOURISM
Tables 3 and 4 provide summaries of mean employment, annual taxes paid, and several employment statistics disaggregated by type of operation. Table 3
reports the information for our actual cases, our sample, and Table 4 reports the statewide estimations derived from our extrapolation. Turning first to Table 3 (estimates for farms participating in the survey), ranges representing 95
percent confidence intervals are provided for six variables (taxes, annual sales, per diem sales, full-time employees, part-time employees, and unpaid family members participating in agricultural-tourism activities). Most striking is that the large ranges (95 percent confidence intervals) reflect significant differences in these economic indicators from operation to operation due to differences in both the number of days of operation and the scale of the operation—even
within the same type of operation. Anticipated by William Coleman, Wyn Grant, and Tim Josling and discussed previously with respect to the farm sec-tors in most nations, it is very clear that this widening gap between large and small operations is characteristic of agricultural tourism as well (2004). These differences can be seen in terms of taxes, annual sales, and employment or even sales per day of operation (Figure 2 and Table 3). Almost one-third (29.5
TYPE OF AGRICULTURAL TOURISM OPERATION NUMBER OF FIRMS BY TYPE 2012TAXES
PAID($)RANGE
REPRESENTS
95PERCENT
CONFIDENCE INTERVAL
ANNUAL SALES
IN2012($)
RANGE REPRESENTS 95PERCENT CONFIDENCE INTERVAL GROSS SALES PER DAY OF OPERATION IN2012 ($)RANGE REPRESENTS THE95 PERCENT CONFIDENCE INTERVAL FULL TIME
STAFF40+
HOURS/WEEK-95
PERCENT CONFIDENCE INTERVAL PART TIME STAFF,40 HOURS/WEEK 95PERCENT CONFIDENCE INTERVAL UN-PAID FAMILY MEMBERS WORKING ON-FARM95 PERCENT CONFIDENCE INTERVAL
Animal-related 18 383–6,446 15,144–195,536 38–546 0–1.5 1/2–4 1–3
Berry-Based Firms 6 0–1,044 12,591–115,075 46–1,800 1.5–3.5 1/2–9 1–2 1/2
Christmas Focus 4 0–1,166 0–1,022,028 0–2,945 0–22 1/4–1/2 1–5
Fall-Harvest Firms 12 0–1,701 2,086–143,012 0–2,126 0–1 1–30 1–3
Farm- Experience Firms 7 0–1,239 0–30,105 0–1,329 0–2.3 1–3 1/2–4
Farm Markets 34 0–2,879 9,482–132,957 0–726 0–1 1–2 1–2
Honey/Maple–Based Firms 7 0–2,060 0–79,672 0–254 0–1/2 1/4–1/2 2–4
Nurseries 3 13–388 0–53,054 19–157 0–1/2 0–13 1–5
Orchards 12 3,782–29,367 45,909–326,966 404–1753 1.5–5 3–31 1–3
Hops/Essenti-al Oils 3 0–8,918 0–41,083 0–181 1/2–1 0–2 1–3
Vineyards 4 0–16,675 0–1,762.570 0–4,896 0–32 0–144 1–2
Source: Rounded estimates calculated by authors from the2013Western Michigan/MATA Agricultural Tourism Survey
TABLE4—EXTRAPOLATEDESTIMATES USINGMEANS FOR THETYPES OFFIRMS FORSTATEWIDETAXREVENUES, GROSSRECEIPTS ANDEMPLOYMENT FOR
AGRITOURISMOPERATIONS INMICHIGAN IN2012
TYPE OF AGRITOURISM OPERATION
SHARE OF SAMPLE
OF154FARMS
(PERCENT)
EXTRA-POLATED ESTIMATE OF
TOTAL2012
TAXES PAID BY
FARM TYPE($)
EXTRAPOLATED ESTIMATE OF TOTAL ANNUAL
SALES BY FARM TYPE
IN2012($)
EXTRA-POLATED ESTIMATE OF TOTAL GROSS SALES PER DAY OF OPERATION BY FARM TYPE IN 2012($) EXTRA-POLATED ESTIMATE OF FULL TIME
STAFF40+
HOURS/WEEK WORKING ON FARMS(PERSONS) EXTRA-POLATED ESTIMATE OF TOTAL NUMBER
OF PART TIME
STAFF,40 HOURS/WEEK (PERSONS) EXTRA-POLATED ESTIMATE OF TOTAL UN-PAID FAMILY MEMBERS WORKING ON-FARM (PERSONS)
Animal-Related Firms 18.4percent $2,510,000 $66,400,000 $186,000 736 1545 1545
Berry-Based Firms 4.6percent $83,000 $9,800,000 $154,000 185 791 202
Christmas Focus 3.3percent $60,000 $36,600,000 $136,000 138 1663 290
Fall-Harvest Firms 9.2percent $378,000 $26,700,000 $390,000 368 5115 736
Farm- Experience Firms 5.3percent $99,000 $5,600,000 $83,000 212 275 402
Farm Markets 33.6percent $1,600,000 $95,700,000 $479,000 1344 1747 1881
Honey/Maple–Based Firms 5.3percent $148,000 $7,000,000 $25,000 212 21 636
Nurseries 2.6percent $21,000 $2,400,000 $9,000 104 624 291
Orchards 11.8percent $7,820,000 $88,000,000 $508,000 475 8024 849
Hops/Essential Oils 2.0percent $213,000 $1,200,000 $5,400 80 40 104
Vineyards 3.3percent $820,000 $94,900,000 $263,000 146 8791 79
TOTAL For Michigan in2012 100percent $13,760,000 $434,400,000 $2,243,000 4004 28638.4 7018
Source: Rounded estimates calculated by authors from the Western Michigan University/MATA2013survey
agricultural-tourism operations in Michigan, however, bigger scale (employ-ment, taxes) is typically better in terms of revenues, a finding further supported by results of the regression analysis provided below.
Reviewing the data from the surveys presented in Table 3 by type of opera-tion, vineyards/wineries, Christmas-focus firms, and orchards pay the most taxes, have the highest annual revenues, and employ the most people. However, assessed using per diem sales, fall harvest and berry-based operations also make major contributions for the periods they are open and especially with respect to part-time employment. Farm market operations do not post high numbers for employment, but their large number (n=51/154) reflects their great signifi-cance in terms of local employment opportunities throughout the state, espe-cially for part-time or seasonal employees, many of whom are students.
[image:13.504.76.429.93.389.2]harvest, farm markets all employing more than one family member at least part time at the 95 percent confidence level. Realistically, most of the smaller opera-tions could not operate without this commitment from family members. In all, around 7,000 members of Michigan farm families devote part or all of their time to agricultural tourism (Table 4).
Assuming our estimates of the total number of operations is correct, and that the relative proportions for each type of operation within the sample (Table 1) remain constant, an extrapolation of the economic and employment contributions of the agricultural-tourism sector in Michigan can be calculated. Certainly, these figures must be taken as estimates—not facts—as the samples
[image:14.504.83.429.82.367.2]portional share of each of the types of agricultural-tourism firms participating in the survey and listed in Table 1.
Based on this approach, the taxes paid in 2012by all agritourism operations in the state were slightly over $13.7 million. Of course, many farms participat-ing in the survey continue to sell wholesale in addition to agricultural tourism-related sales of nonfood items so these taxes are not derived solely from agri-cultural tourism. Still, these funds represent an important contribution to state revenues, and may justify greater support of agricultural-tourism promotion and technical support by the MDARD.
Gross sales and gross sales per day provide additional “snapshots” in terms of the importance of these operations to the state’s economy. Estimates for the gross value per year of all sales in 2012 are over $434 million, while statewide gross sales per day of operation are well over $2 million (Table 4). Farm mar-kets account for about 33 percent of all agricultural-tourism operations, so while revenues at any given market may be modest (Table 3), the large number of these operations has them essentially tied with vineyards for total annual gross sales, with orchard-based operations a close third. Farm markets, orch-ards, and vineyard/wineries account for 64 percent of all agricultural-tourism annual sates in Michigan.
Turning to employment, based on our extrapolation we estimate that agri-cultural-tourism operations in Michigan provide approximately 4,000 full-time annual jobs, exclusive of unpaid family members. Perhaps more surprising is the fact that agricultural tourism provided work and training to approximately
28,000 part-time employees, many of whom go on to work in other sectors where the skills learned during time spent on these farms can prove extremely valuable (Table 4).
DRIVERS OF DAILY SALES AT MICHIGAN AGRICULTURAL-TOURISM OPERATIONS
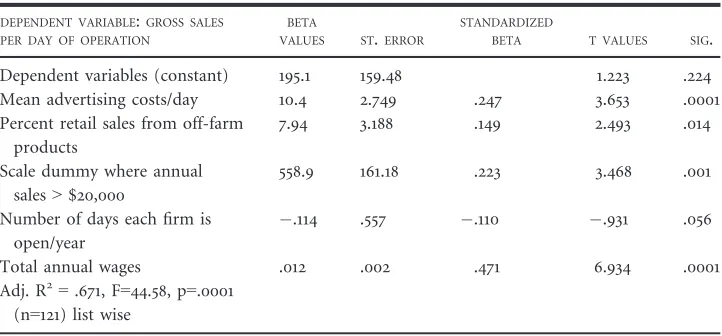
Finally, as noted in the methods section, an OLS multivariate regression test is conducted to determine effective predictors of gross revenues per day of opera-tion. Again, the dependent variable is total reported gross sales adjusted by the number of days of operation so that all farms could be compared. The inde-pendent variables included in the model include: mean advertising costs per day of operation (standardized for the same reason as the dependent variable), the percent of retail sales from off-farm products, a scale dummy variable (where1 = annual sales above $20,000, below $20,000= 0), the number of days open to the public, and the total wages paid annually. The figure of total wages paid was selected, versus absolute full- and part-time employees, to include both full-time and part-time seasonal workers. Results for the regression analy-sis are presented as Table 5. The model is robust (R 2 =
First, the two scale-related independent variables (sales > $20,000 dummy and total annual payroll) rank first and third when the estimates of beta are standardized (Table 5). Larger operations, with greater than $20,000 in gross sales annually, have higher daily sales (b=$558.90, t-3.468, p.=.001); firms with greater than 20K in annual sales can expect $558.0 more in mean daily sales. However, the number of days of operation each year actually has a slight inverse relationship (b=-1.14, t=-1.931, p=.056) with mean gross sales per day of operation (Figure 3). It is not that firms make more money by just staying open for longer seasons, but rather that larger operations, with a greater num-ber of employees and more advertising, attract more visitors and generate greater sales. The inverse relationship between daily mean sales and days of operation probably reflects the intensity of sales surrounding particular holi-days or short growing seasons as in specialized Christmas tree farms, or straw-berry and raspstraw-berry U-pick operations. In terms of the standardized coefficients, advertising expenditures per day of operation was second only to gross value of total payroll in significance (b=10.04, t=3.653, p=.0001) (Table5). Scale matters and advertising works. For firms participating in the sample, every dollar spent in advertising results in an additional $10.04 in sales for every day of operation. The benefits of a more diverse product mix are also apparent as every percentage increase in the sale of items not produced on the farm and purchased wholesale, such as Christmas ornaments or candles results in an additional $7.95 in mean daily sales (b=7.948, t=2.493, p=.014). The most successful operations not only offer a more diverse mix of on-farm produce and services but those that also offer theme-related inventory—purchased
else-where as compared to products grown or processed on-farm—are also more
successful as measured by gross sales per diem.
TABLE5—REGRESSIONRESULTSCOMPARINGVARIATIONS INPERDIEMGROSSSALES($)ANDSELECTED ECONOMICINDICATORSRELATED TOFIRMOPERATIONS FOR ASAMPLE OF107AGRICULTURALTOURISM
FARMS INMICHIGAN2013. DEPENDENT VARIABLE:GROSS SALES
PER DAY OF OPERATION
BETA
VALUES ST.ERROR
STANDARDIZED
BETA T VALUES SIG.
Dependent variables (constant) 195.1 159.48 1.223 .224 Mean advertising costs/day 10.4 2.749 .247 3.653 .0001 Percent retail sales from off-farm
products
7.94 3.188 .149 2.493 .014
Scale dummy where annual sales>$20,000
558.9 161.18 .223 3.468 .001
Number of days each firm is open/year
.114 .557 .110 .931 .056
Total annual wages .012 .002 .471 6.934 .0001
Adj. R2=
.671, F=44.58, p=.0001
(n=121) list wise
[image:16.504.72.433.113.281.2]FINAL THOUGHTS
Agricultural tourism is an increasingly important portion of the agriculture and tourism sectors throughout the United States and North America as small farms seek to reposition in the post-WTO agricultural economy. In Michigan alone, annual sales are over $430 million dollars while providing employment to over 4,000 full-time workers and 28,000 part-time ones. Beyond allowing these farms to remain solvent, it is important to appreciate the economic contributions that agricultural-tourism operations make to the rural economies within which they operate. As the results of this survey of Michigan farms indicate, the economic impact of agricultural-tourism operations in all their diversity is great and growing. Catching the wave of the local-food movement, the “green” foods movement, and the shift away from processed foods, agricul-tural-tourism operations help sustain many rural areas throughout Michigan, and indeed the nation, while providing employment, tax revenues, economic development, and “free” job training. Economically, agricultural-tourism operations employ a significant number of full- and part-time workers in many rural areas where jobs are difficult to find. Often overlooked in the agricul-tural-tourism literature are the contributions these businesses make in training the workforce in terms of hospitality skills, running a register, or keeping accounts, while cultivating farming and horticultural expertise.
Local advertising options also clearly benefit as well. The benefits of advertising on local radio stations and newspapers cuts both ways and savvy operators not only have an on-line presence but still advertise conventionally in daily and weekly papers and on local and regional radio and television stations.
Many of the rural places where agricultural-tourism operations are concen-trated have experienced out-migration of youth and high unemployment rates. As results of our survey show, these operations provide full- and part-time jobs to thousands of residents, while horizontal linkages with other components of the tourism sector employ many more thousands as well. Of course, it is logical to assume that most of these wages are spent locally, shoring up rural economies.
agricul-tural-tourism operations in Michigan is not enough, the strong and effective role that specialty crop growers associations play in Michigan means that farmers are sometimes forced to divide their attention between the state’s agricultural-tourism association (MATA) and their specific specialty-crop asso-ciations, cooperatives, or boards. Based on our review of literature from other states, Michigan is hardly unique in this regard and thus the selection of a name—of a branding term—for all the activities discussed in this article really
matters, both in terms of recruitment of members to the agricultural-tourism association, and also in terms of state and county government perceptions.
Our findings, then, have important implications for how agricultural tour-ism is promoted to state legislatures. This is not “boutique farming” destined to forever take a back seat to large-scale operations producing corn, beans, and the like. MATA, however, again finds itself in a difficult position. Setting a pro-legislative agenda that is important and appropriate while appealing to both small and large firms is a significant challenge. Large wineries push for legisla-tion related to out-of-state sales and tax issues related to on-line sales; small firms seek better state-supported promotional campaigns or relief from duplicate site inspections from city, county, and state agencies and health departments.
As the industry matures, common ground for these diverse businesses may appear more difficult to find given growing differences in scale and the ever greater range of products and services involved in agricultural-tourism opera-tions. A farm producing lavender and other essential oils that invites visitors to learn to make perfume or to practice yoga appears, at first glance, quite different from a U-cut Christmas tree farm. Certainly, every operation is unique–that is part of the appeal of these businesses to the customer base that has grown increasingly diverse. On the other hand, all agricultural-tourism operations continue to have common interests related to on-farm liability insurance, state-led promotional efforts, and proagricultural-tourism legislation with respect to signage, insurance, liability, health regulations, road improve-ments, and the like.
The predecessor to Michigan Agritourism Association, the Michigan Farm Market and Agricultural Tourism Association (MiFMAT), was formed in 2006
benefits (Vassano 2010). We believe there are many areas of mutual interests among these disparate operations, but much more information is needed including more input from agricultural-tourism operators.
Only very limited information on agricultural tourism was collected for the first time by the U.S. Agriculture Census in 2012. Standardized regularly scheduled nationwide surveys are needed as is more support from state farm extension agencies. Extrapolating data for a small sample is hardly ideal, but in the absence of more extensive sampling by state and provincial farm extension agencies, it is a useful first step.
REFERENCES
Bagi, F. S. 2014. Agritourism Farms Are More Diverse than other U.S. Farms. Amber Waves, accessed 6 October. [http://www.ers.usda.gov/amber-waves/2014 -october/agritourism-farms-are-more-diverse-than-other-us-farms.aspx#.VhawPEbGpTc].
-., and R. J. Reeder. 2012. Factors Affecting Farmer Participation in Agricultural tourism. Agricultural and Resource Economics Review41(2):189–199.
Barbieri, C.2013. Assessing the Sustainability of Agricultural Tourism in the U.S.: A Comparison between Agricultural Tourism and other Farm Entrepreneurial Ventures. Journal of Sustainable Tourism21(2):252–270.
Barbieri, C. S. Xu, C. Gil-Arroyo and S. Rozier Rich.2015. Agritourism, Farm Visit or . . ..? A
Branding Assessment for Recreation on Farms.Journal of Travel Research. First published on 27September as DOI:10.1177/0047287515605930.
Barbieri, C., and E. Mahoney. 2009. Why Is Diversification an Attractive Farm Adjustment Strategy? Insights from Texas Farmers and Ranchers.Journal of Rural Studies25:58–66. Bowman, A.2011. Profitability and Farm Size on Grain Farms in Illinois.Pork Network, accessed
4 May. [http://www.porknetwork.com/pork-news/Profitability-and-farm-size-on-grain-farms-in-Illinois-121273184.html].
Caldwell, J. 2011. For Your Farm: Does Size Matter? Agriculture.com., accessed May 4. [http:// www.agriculture.com/news/business/f-your-farm-does-size-matter_5-ar16388?print].
Che, D. 2006. Select Michigan: Local Food Production, Food Safety, Culinary Heritage, and Branding in Michigan Agri-Tourism.Tourism Review International9:349–364.
-., A. Veeck, and G. Veeck. 2005. Sustaining Production and Strengthening the Agri-Tourism Product: Linkages among Michigan Agri-Agri-Tourism Destinations. Agriculture and Human Values22:225–234.
Coleman, W., W. Grant, and T. Josling. 2004. Agriculture in the New Global Economy. Cheltenham, U.K.: Edward Elgar.
DWELL. 2015. Small Farms in America. Interactive Agricultural Tourism MAP of USA. [http:// www.dwell.com/map/small-farms-across-united-states].
Ferdman, R. A. 2014. The Decline of the Small American Family Farm in Fne Chart. The Washington Post, Wonkblog, accessed 16 September. [http://www.washingtonpost.com/ blogs/wonkblog /wp/2014/09/16/the-decline-of-the-small-american-family-farm-in-one-chart/]. Gregson, B., and B. Gregson.2004.Rebirth of the Small Family Farm: A Handbook for Starting a Successful Organic Farm Based on the Community Supported Agriculture Concept. 2nd ed. Austin, Tex.: Acres, USA.
Hoppe, R. A. 2014. Structure and Finances of U.S. Farms: Family Farm Report 2014 accessed 8 October. [www.ers.usda.gov/publications/eib-economic-information-bulletin/eib132.aspx]. -., J. M. MacDonald, and P. Korb. 2010. Small Farms in the United States: Persistence
Under Pressure. Economic Information Bulletin Number 63, Economic Research Service. Washington, D.C.: United States Department of Agriculture.
Hung, W. T., H. Y. Ding, and S. T. Lin. 2015. Determinants of Performance for Agritourism Farms: An Alternative Approach.Current Issues in Tourism. doi:10.1080/13683500.2015.1037254. Khanal, A. R., and A. K. Mishra. 2014. Agricultural Tourism and Off-Farm Work: Survival
King, S.2014.2012Census of Agriculture Reveals New Trend in Farming.News Release, National Agricultural Statistics Service. Accessed 8 October 2015. [http://www.agcensus.usda.gov/ Newsroom/2014/05_02_2014.php].
Knowd, I. 2006. Tourism as a mechanism for farm survival. Journal of Sustainable Tourism14: 24–42.
Lowder, S. K., J. Skoet, and S. Singh. 2014. What Do We Really Know about the Number and Distribution of Farms and Family Farms in the World? Background paper for The State of Food and Agriculture, ESA Working Paper No.14–02, Rome, Italy: FAO.
MacDonald, J. M.2013. Cropland Consolidation and the Future of Family Farms.Amber Waves. Economic Research Service. Washington, D.C.: United States Department of Agriculture, accessed October 8, 2015. [http://www.ers.usda.gov/amber-waves/2013 -september/cropland-consolidation-and-the-future-of-family-farms.aspx].
-., P. Korb, and R. A. Hoppe. 2013. Farm Size and the Organization of U.S. Crop Farming. Economic Research Service USDA. Economic Research report #152(August). Mace, D. 2004. Factors Motivating Agricultural Tourism Entrepreneurs, accessed 8 October 2015.
[http://www.agmrc.org/media/cms/Mace_BA47806FF3EE2.pdf].
Martin, A.2009. Farm Living (Subsidized by a Job Elsewhere).The New York Times. Accessed8 October2015. [http://www.nytimes.com/2009/02/08/business/08feed.html\].
Mazoyer, M., and L. Roudart.2006.A History of World Agriculture: From the Neolithic Age to the Current Crisis. Translated by J. H. Membrez. New York, N.Y.: Monthly Review Press. McGehee, N. G., and K. Kim.2004. Motivation for Agri-Tourism Entrepreneurship.Journal of
Travel Research43:161–170.
Nelson, W. 2010. 88 percent of U.S. farms considered small family farms. AGWEEK, accessed August28. [http://www.agweek.com/event/article/id/71528/publisher_ID/22/].
Newton, D. J. 2014, Working the Land With 10 Acres: Small Acreage Farming in the United States, EIB-123, Economic Research Service. Washington, D.C.: United States Department of Agriculture. [http://www.ers.usda.gov.].
Rogerson, C. M., and J. M. Rogerson. 2014. Agricultural Tourism and Local Economic Development in South Africa.Bulletin of Geography, Socio-economic Series.26:93–106. Schilling, B. J., W. Attavanich, and J. H. Jin.2014. Does Agritourism Enhance Farm Profitability?
Journal of Agricultural and Resource Economics39(1):69–87.
Sharpley, R., and A. Vass. 2006. Tourism, Farming and Diversification: An Attitudinal Study. Tourism Management27:1040–1052.
Sznajder, M., L. Przezborska, and F. Scrimgeour. 2009.Agricultural Tourism. Cambridge, Mass.: CAB International.
University of California Small Farm Program. 2011. “What is Agricultural Tourism?” [http:// sfp.ucdavis.edu/agricultural tourism].
USDA [U.S. Department of Agriculture], National Agricultural Statistics Service. 2014. 2012 Census of Agriculture Highlights: Farmers Marketing, ACH12-7/August. [http:// www.agcensus.usda.gov/Publications/2012/Online_Resources/Highlights/Farmers_Marketing/ Highlights_Farmers_Marketing.pdf].
Vassano, A.2010. The Right to Farm: Sisters Katrina Schumacher and Abby Jacobson Stay Active on the State and Local Levels to Ensure Agricultural Tourism Flourishes in Michigan. [http://www.growingproduce.com/americanfruitgrower/?storyid=3252#].
Veeck, G., D. Che, and A. Veeck. 2006. America’s Changing Farmscape: A Study of Agricultural Tourism in Michigan.The Professional Geographer58:235–248.