FINAL YEAR PROJECT REPORT
IMPLEMENTATION OF THE SECURITY MAIN GATE
PREPARED BY
:
MOHD KHAIRERY ABDUL RAHMAN
B010610160
“I hereby declared that I have read through this report entitle “Implementation of the Security Main Gate Entrance” and found that it has comply the partial fulfillment for awarding the
degree of Bachelor of Mechatronic Engineering”
Signature : ……….
Supervisor’s Name : Encik Hairol Nizam b. Mohd Shah
“I hereby declared that this report entitle “Implementation of the Security Main Gate Entrance” is the result of my own work except as cited in the references.
The report has not been accepted for any degree and is not concurrently submitted in candidature of any other degree.”
Signature : ………
Name : Mohd Khairery b Abdul Rahman
MOHD KHAIRERY ABDUL RAHMAN B010610160
A Report submitted in Partial Fulfillment of requirements for the award of the Degree of Bachelor in Mechatronic Engineering
FACULTY OF ELECTRICAL ENGINEERING UNIVERSITI TEKNIKAL MALAYSIA MELAKA
ACKNOWLEDGEMENT
Alhamdulillah, thanks to Allah S.W.T the Final Year Project (FYP) is complete. I hereby would like to take this opportunity to thank all persons who has involved generously in helping me and assisting me while I was completing the Final Year Report (FYP) which is a compulsory to all Universiti Teknikal Malaysia Melaka (UTeM) students in order to complete our degree.
I would firstly to express my deepest gratitude and thanks to my project supervisor, Mr Hairol Nizam b Mohd Shah for his undivided support morally and physically, assistance, guidance, tolerance, which proved to be invaluable as to completion my Final Year Project (FYP).
I also would like to thank the panel, Mr Herman b Jamaluddin and Mr Razali b Mohamad Sapiee whose give me a good comment during my presentation. I also would like to take this opportunity to express my appreciation to my family and friends for their patients, understanding and also for their undivided support that they had gave me throughout the completion of my project.
ABSTRACT
ABSTRAK
TABLE OF CONTENT
2.3 Studies on usage of proximity sensor 11 2.3.1 Reactive Grasping Using Optical Proximity Sensors 11 2.3.2 Dynamic Object Localization via a Proximity Sensor 12
Chapter Page
4 RESULTS 27
4.1 Introduction 27
4.2 Results 28
5 DISCUSSION OF RESULTS 35
5.0 Introduction 35
5.1 Discussion 35
6 SUMMARY AND CONCLUSION 37
6.1 Introduction 37
6.2 Summary and Conclusion 37
7 REFERENCES 40
APPENDIX A Project Planning 41
LIST OF FIGURES
Figure 2.5: Effect of Grasping Proximity Sensor Gripper on Shiny Object
11
Figure 2.6: Effect of Grasping Proximity Sensor Gripper on Transparent
12
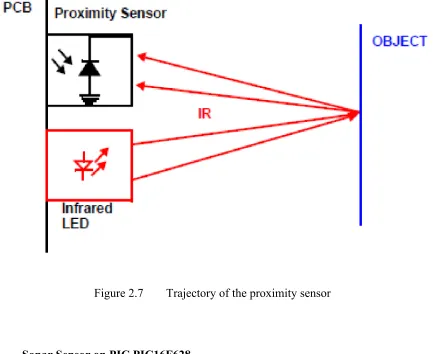
Figure 2.7: Trajectory of the proximity sensor
13
Figure 2.8: The diagram of proximity sensor using PIC16F628
14
3
Figure3.1: A Car Model Prototype
17
INTRODUCTION
Security gate can be defined as a gate that is supposed to be safe and full with guards all the time. Currently main gates are usually guards by numbers of security guards taking turns in day and night shift. It is a basic knowledge that guards sometimes works at night may fall asleep and left their post unattended. In order to solve this kind of problems, a system is created so it can help the security guard in improving their efficiency in their job.
The main motive in inventing this system is to solve the current problems face nowadays and to enhance the current security gate to ensure safety for all premises. It is also to fill the imperfections of the current security gate which is quite a lot.
1.1 Background of the Project
PIC board will be used in order to control these sensors. A driver for the sensors will be created on board to have the sensors functions and accomplish the mission of this project. These sensors are supposed to acts as a switch when the vehicle pass through the sensors, allowing the sensors to become a detector whether there is vehicle in place or not. C languages are programmed so that I can be burn into the PIC in order to control this system. The entire objective, scope and other will be discussed in the next chapter.
1.2 Problem Statement
There are several problems based on recent way of gate. First of all, the problems face by the guards to calculate the numbers of vehicle that enters and exit a premise. In current way, eye-sighting is the most efficient way; however this may be tiring for most of the security guards; thus making it less effective.
Theft robberies in premises are often undetectable even with security guards all over the place. Ensuring the premise safe is one of the problems to be study about. Ensuring the premises safe is the problem face by the current security gate entrance where as the security guard needs to tend all of the vehicle enters and exits the premises.
The main objective of this project is to build a smart and intelligence system to be implemented on main security guard entrance. In order to make this project successful, the objectives have been declared these objectives must be achieved in completing this project. Objectives are a guidance of any project, so the objectives have been listed below.
1) To calculate the numbers of vehicle enters and exit a premise. 2) To classify the vehicle into several classes.
3) To build a Smart gate that helps the security guard in keeping the premise safe.
1.4 Scope
The scope of this project is to build a system that will function properly based on the objective and to solve problem faced as much as it can. The scope of this project is to build a system using sensors as detectors. PIC will be used in controlling the device. The programming of the system will be using the C language based on the C file using the MicroC software.
The project scope is to identify and verify the class of vehicle which is car, motorcycle, bus and lorry. The type of each class of vehicle is not specific. Each of the class of vehicle will be taken into measurement.
Lastly, perform an experiment that is including testing and commissioning the product to make sure the product well function as stated in the objective.
1.5 Organization of the Project
This report will be conducted in few chapters and each stated as below: Chapter 1: Introduction
This chapter will simply introduce about the project. This chapter contains introduction, objectives, scope of project and problem statement.
Chapter 2: Literature Reviews
This chapter shows about the studies and research that relevant to the project.
Chapter 3: Methodology
This part will show the canvass about the project methodology used in this project.
Chapter 4: Preliminary result
This part will state out the result that be obtained.
Chapter 5: Discussion of results
This chapter will talk about the discussion of the result of the project. Chapter 6: Summary and Conclusion
LITERATURE REVIEW
2.0 Introduction
In this chapter, reviews of the previous researches project that are related with this project will be discussed. The information will be become additional source for the project in becoming more successful. To have a brief understanding of the researches related to the project, a few literature reviews had been done. This chapter will describe the related literature reviews.
2.1 PIC Microcontroller
PIC is a family of Harvard architecture microcontrollers made by Microchip Technology. The name PIC initially referred to “Programmable Interface Controller”, but shortly thereafter was renamed “Programmable Intelligent Computer”. The main function of a microcontroller is to receive information and give order to other devices to do a job that has been programmed into the microcontroller. A microcontroller is a single integrated circuit with the following key features:
1. Central processing unit – ranging from small and simple 8-bit processor to sophisticated 32 or 64-bit processor.
2. Input/output interfaces such as serial port 3. Peripheral such as timer and watchdog circuit 4. RAM for data storage
5. ROM,EEPROM or Flash memory for program storage
6. Clock generator – often an oscillator for a quartz timing crystal, resonator or RC circuit
2.2 Sensor
The navigator for obstacle tracking there are several m a) IR sensor
b) Inductive sensor c) Ultrasonic sensor
2.2.1 Infra-Red Proximity Sensor
This infra – red proximity sensor
detection range of 35 cm (range can change dependin 1. Can be used for most ind
2. Can be measure the spee i) industry
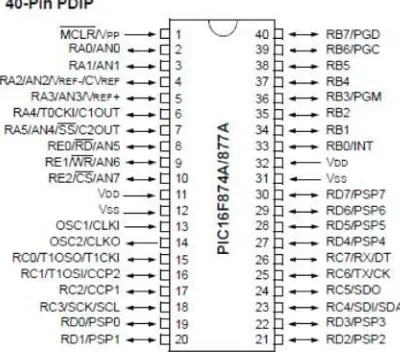
Figure 2.1 PIC16f877A pin diagram
tracking there are several method that been used.
Red Proximity Sensor
proximity sensor is easy to build, easy to calibrate and still, (range can change depending on the ambient light intensit Can be used for most indoor applications
Can be measure the speed of object moving at a very high speed
that of visible light (400700 nm), but shorter than that of terahertz radiation (100 µm -1 mm) and microwaves (~30,000 µm). Infrared radiation spans roughly three orders of magnitude (750 nm to 100 µm). Direct sunlight has a luminous efficacy of about 93 lumens per watt of radiant flux, which includes infrared (47% share of the spectrum), visible (46%), and ultra-violet (only 6%) light. Bright sunlight provides luminance of approximately 100,000 candela per square meter at the Earth's surface
.
Infrared imaging is used extensively for military and civilian purposes. Military applications include target acquisition, surveillance, night vision, homing and tracking. Non-military uses include thermal efficiency analysis, remote temperature sensing, short-ranged wireless communication, spectroscopy, and weather forecasting. Infrared astronomy uses sensor-equipped telescopes to penetrate dusty regions of space, such as molecular clouds; detect cool objects such as planets, and to view highly red-shifted objects from the early days of the universe Humans at normal body temperature radiatechiefly at wavelengths around 10μm (micrometers). At the atomic level, infrared
energy elicits vibrational modes in a molecule through a change in the dipole moment, making it a useful frequency range for study of these energy states for molecules of the proper symmetry. Infrared spectroscopy examines absorption and transmission of photons in the infrared energy range, based on their frequency and intensity.
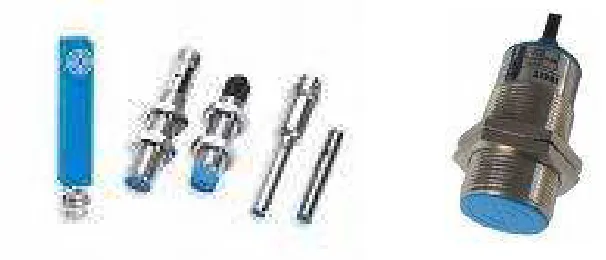
An inductive sensor is an electronic proximity sensor, which detects metallic objects without touching them. The sensor consists of an induction loop. Electric current generates a magnetic field, which collapses generating a current that falls asymptotically toward zero from its initial level when the input electricity ceases. The inductance of the loop changes according to the material inside it and since metals are much more effective inductors than other materials the presence of metal increases the current flowing through the loop. This change can be detected by sensing circuitry, which can signal to some other device whenever metal is detected.
Common applications of inductive sensors include metal detectors, traffic lights, car washes, and a host of automated industrial processes. Because the sensor does not require physical contact it is particularly useful for applications where access presents challenges or where dirt is prevalent. The sensing range is rarely greater than 6 cm, however, and it has no directionality.
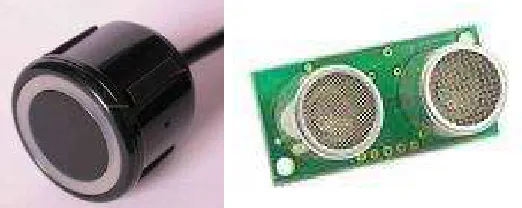
Ultrasonic sensors (also known as transceivers when they both send and receive) work on a principle similar to radar or sonar which evaluate attributes of a target by interpreting the echoes from radio or sound waves respectively. Ultrasonic sensors generate high frequency sound waves and evaluate the echo which is received back by the sensor. Sensors calculate the time interval between sending the signal and receiving the echo to determine the distance to an object.
This technology can be used for measuring: wind speed and direction (anemometer), fullness of a tank, and speed through air or water. For measuring speed or direction a device uses multiple detectors and calculates the speed from the relative distances to particulates in the air or water. To measure the amount of liquid in a tank, the sensor measures the distance to the surface of the fluid. Further applications include: humidifiers, sonar, medical ultrasonography, burglar alarms, and non-destructive testing.
Systems typically use a transducer which generates sound waves in the ultrasonic range, above 20,000 hertz, by turning electrical energy into sound, then upon receiving the echo turn the sound waves into electrical energy which can be measured and displayed. The technology is limited by the shapes of surfaces and the density or consistency of the material. For example foam on the surface of a fluid in a tank could distort a read
2.3.1 Reactive Grasping Using Optical Proximity Sensors
Based on the journal, there are certain points that can take into measurement, such as the Grasping Experiment done in the journal. The purpose of the experiment is to focus on the final approach of grasping using proximity sensor. Here, can be seen that proximity sensor can be use in order to get a vivid measure of a certain objects.
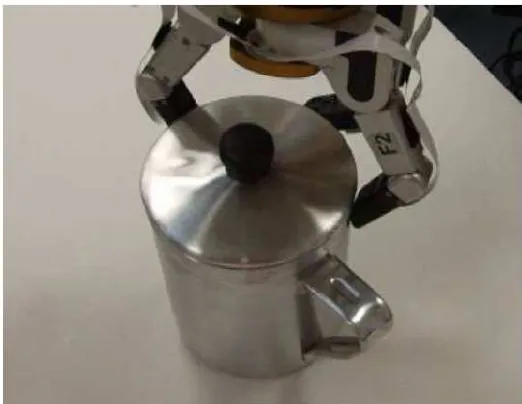
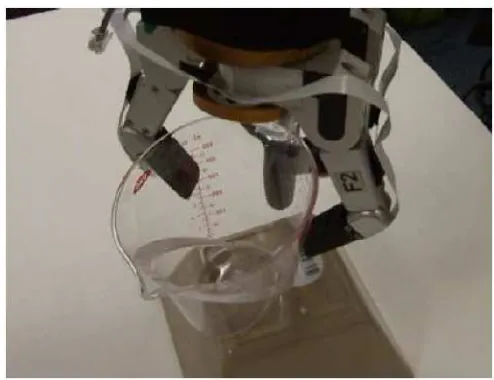
Based on the experiment, using a gripper which is uploaded with a proximity sensor, the proximity sensor are able to identify certain things such as ski-boot. However, the proximity sensor senses are facing with disturbances when the objects are extreme type of surface such as highly reflective aluminum and a transparent glass.
This is the picture of failures of the proximity sensor in order to detect and calculate the distance of gripper and objects. Figure 2.5 shows the effect of grasping proximity sensor gripper on shiny object. Figure 2.6 shows the effect of grasping proximity sensor gripper on transparent glass.
Figure 2.6 shows the effect of grasping proximity sensor gripper on transparent glass.
2.3.2 Dynamic Object Localization via a Proximity Sensor
Based on the experiment done in this journal, the object localization using a proximity sensor is proven to be effective whereas the result are such where most of the objects are able to detect using proximity sensor. In this paper itself, it is describe that a Proximity Sensor consisting solely of inexpensive intensity-based electro-optical proximity sensors embedded in a robotic end-effector. This paper also talks about the degree of sensor reflectivity and how the sensors accept the transmitted wave.
Based on this paper, the sensors were characterized by experiment: sensor output voltage was recorded while a flat plane covered with white paper was placed at distance intervals of 1mm and orientation intervals of 1.5oover a range of 0-75mm and -50o to 50o respectively. The sensor saturated at distances less than 5mm when the orientation was less than ±30o .This region was avoided for the rest of the characterization.
Figure 2.7 Trajectory of the proximity sensor
2.4 Sonar Sensor on PIC PIC16F628