ANALYSIS OF WATER LOSS IN SEMARANG
MUNICIPAL WATERWORKS
Benny Syahputra
Department of Environmental Engineering, Faculty of Engineering, Sultan Agung Islamic University of Semarang
Jl. Raya Kaligawe Semarang e-mail: abu fadiyah@yahoo.com
Abstract
Losses of water in Municipal Waterworks (MW) in Indonesia have in a serious problem. Based on data that released in 2009 by Directorate General of Housing Ministry of Public Works Republic of Indonesia, the rate losses of water at national level have reached 37%. This figure has much influence to the ability of MW to supply water to the consumers. The more of losses of water occur, the more the ability of MW to supply water slackens. The objective of this research is to make model of losses of water as well as to know about the volume of losses of water. WB-EasyCalc 1.07 software was used to analyze model. Analysis has been done by reading the graph of water balance resulted from the model. In addition, the ratio between value of non-revenue water that available in the past and reliable field data has also needed. Field data was taken from observation and by using questioner method, where as respondent was the technician of MW and the consumers. The result of the model was a water balance. Based on 2009 water balance, Semarang has 57.4% non-revenue water and losses of water were 30.55% and represent the higher percentage of losses of water. The main factor of losses of water that was the water pipes were worn out. Utilization of water balance to control the rate of losses of water was in a great demand for MW to monitor efficiency of their system.
Keywords: Municipal Waterworks, Losses of Water, water balance, Control
INTRODUCTION
37% the rate losses of water at national level will vary if drop into the level of region. Semarang Municipal Waterworks (MW), for instance, in the year 2008 technically have 16.4 million cubic meter rate of losses of water or around 20.4%, administratively those rate reach 23.9 million cubic meter or 29.8%. Based on Semarang MW’s water balance data, total non-revenue water reach 57.3%. This rate was far from the Government standard for losses of water. Government gives rate for losses of water 20% to put MW into healthy condition.
Losses of water are criterion to measure healthy or unhealthy a system of appropriation of drinking water, since the higher the rate of losses of water, the higher an MW will loss. Semarang MW has rate losses of water about 50.2%, and these mean that much of drinking water was useless and go to the waste. However the rate of losses of water have to be controlled, and one method can be used was water balance.
Water balance is the tool to calculate the losses of water that function to control three main indicators of healthy or unhealthy a system of drinking water provider, namely input of the system, consumption, and loss of water.
Utilization of water balance system to monitor the rate of losses of water it requires for MW, the function is to identify the efficiency of the appropriation of drinking water system. Take that characteristic of MW water balance is global into consideration; further research was needed to take advantage of water balance in identifying what is the factors at the bottom of losses of water, technically or not technically.
OBJECTIVES OF THE RESEARCH
The objectives of the research are:
1. Make model of water balance that account for control function to the rate of losses of water in MW. 2. To identify the type of losses of water which have largest volume and the subject factors.
RESEARCH METHODOLOGY
1. Materials and Equipment
a.
Materials for research contain:1) Semarang MW administrative data which consist of volume of processed water, volume of distributed water, and map of pipe network of Semarang MW.
2) Questioner and observation data of physical and commercial losses of water in Semarang MW.
b.
Equipment1) Map of network of pipe distribution of drinking water of Semarang MW 2) WB-EasyCalc Software 1.07 version as a tool to compile water balance.
WB-EasyCalc 1.07 software has some items to determine amount of non-revenue water as follows:
a.
Annual System Input Volume. Total volume of water that process by MW installation during 1 year, where system input value divided into some resources of water.b.
Billed Consumption. A yearly volume of water both revenue and non-revenue, take from the registered consumers, water supplier, and others parties that legally allowed. [Sri Manganti 2007].c.
Unbilled Consumption. Uncollected consumers data based on MW calculation for bothd.
Unauthorized Consumption. Illegal consumers data based on MW calculation, revenue and non-revenue.e.
Customer Meter Inaccuracies and Data Handling Errors. Error data make by MW officer or because of damage of the device.f.
Network Data. Waterworks Company system data consists of length of main pipe, service pipe, and the amount of illegal consumer data.g.
Pressure. Rate of water pressure on Waterworks Company pipe system. 2. Data Collecting MethodData collecting method is the method conducted by the authors to collect data that support compilation of this case study as follows:
a. Observation
Observation is a technique used to make direct observation to the activity or something which have relation with losses of water in Semarang MW. Data collecting using this method was focused on installation of water pipe distribution of Semarang MW and in consumer’s water meter. Data that was taken was numeric and annalistic data. This method was used to support primary data find from the questioner which was distributed to know the factors of physically losses of water.
b. Questioner
Questioner was conducted to get information from related parties that positively can strengthen the earlier information. In this research about losses of water, the respondent is employee and costumers of Semarang MW. Remembering that data that taken from this study is a primary data, therefore capability of respondents in answering the questions is vary important in this study. For that reason, limitation of respondents is conducted to keep the validity of the results.
1). Conditions of respondent
Respondent must fulfill conditions as follows:
a) Must be employee, especially technician of Semarang municipal waterworks, since the technicians are directly deal with damages, and questioner is intended to get technical data related to the loss of water,
b) Must be consumer of Semarang municipal waterworks, which is intended to get supporting data of loss of water cause by consumer behaviour or the situations around consumer’s home.
2). Objectives of the questioner
The objectives of the questioner are intended to get data or factors causing lossof water as follows:
a)
Illegal userb)
Inaccuracy of consumer recorded device and error on handling data.c)
Leak on transmission and/or main pipesd)
Leak and abundant of reservoir tankCollecting of sample of questioner was conducted by using areal random sampling, where the quantity of respondents or sample was decided with some considerations as follows:
a.
Questioner for MW consumers were focused to the locations where the condition of water distribution worst or where the percentage loss of water high. The numbers of respondent were taken 270 of fixed consumer. This numbers based on table made by Stephen Isaac and Michael William B, in their “Handbook in Research and Evaluation”. The table, with some justification can be seenTable 1. Determination the number of Isaac William’s sample by some justifications (PrasetyoWijaya, 2009)
Population
Number of Sample Level of Error
1 %
Level of Error 5%
Level of Error 10%
10000 622 336 263
50000 655 346 269
100000 659 347 270
150000 661 347 270
250000 661 347 270
500000 663 348 271
1000000 663 348 271
Distribution of questioner to the consumers was focused to the: 1) District of Candisari (MW Central Semarang branch office) 2) District of Banyumanik (MW South Semarang branch office) 3) District of Semarang Utara (MW North Semarang branch office)
b.
Questioner for MW technician will take to the priority to all MW technicians which stationin the
field. This was intended in order data needed was on target.
RESULT AND ANALYSIS
Loss of water model using Water balance
Water balance was used by MW have recorded the performance of MW drinking water supply system during the year of 2006 to 2009 according to Government Regulation No. 16/2005 about Control to system of water supply. Within that time, MW have faced some problems which expected can be solved.
Water balance calculation was conducted by using software recommended by Indonesia MW Association that was WB-EasyCalc version 1.07. Need to understand that on the easycalc calculation form, cells to put data have been formulated by the developer. Data only can be filled to the green colour cell, then will automatically appear in the green column of the form.
Legal Consumption
a. Legal revenue consumption
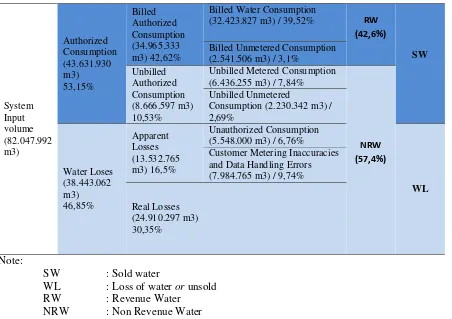
Based on water balance calculation using WB-EasyCalc 1.07, the amount of Semarang MW legal revenue consumers in 2009 were 34.965.333 cu meter per year or 42.62%. Legal revenue consumption Legal revenue consumers divided into legal revenue consumption have amount of 32.423.827 cu meter/year or 39.52%,This consumption is MW normal consumption. The consumption which include legal category is un-revenue consumers, that was MW water consumption which is performed by government institutions, and the amount was 2.541.506 cu meter/year or 3.1%.
b. Legal un-revenue consumers
Semarang MW legal un-revenur consumption include the water use for fire extinguisher, MW network pipe cleaning, city garden, etc, which the amount reach 8.666.597 cu meter/year or 10.53%. This figures divided into two categories first, legal un-revenue consumption which include free consumption, consumption by MW itslef, flushing pipe and water give by MW, total amount was 6.436.255 cu meter/year or 7.84%, and illegal un-revenue consumption which include water supplay for fire extinguisher, city garden, and pipe wshing 2.69%.
Input data of legal un-revenue consumption come from the section of bill collector and payement of MW. In this section all legal water consumption were recorded.
Loss of Water
a. Illegal consumption
Majority of Semarang MW illegal consumption in the year 2009 was water burglary which the amount reach 5.458.000 cu meter or 6.76%, this figures were found from NRW section of MW, where were found that amount of 9.8% and 1000 consumers do water burglary. From those data can be estomated that water burglary in 2009 was 15.200 illegal of water connection.
Input data of illegal consumption can be known that there were 3 type of illigal consumptions, that was house hold illegal connection, and other illegal connection like tampering meter as well as pipe by pass from legal consumer, and also abuse of fire hydrant.
b. Inacuracy consumer meter and mistake on dealing with data
Mistakes dne by MW management in filed data processing as well as mistake in reading recorder device by filed officer or damage of recorder device and causing error reading, cause loss of water reach 7.984.765 cu meter/year or 9.74% from the total production in the year 2009.
Figures of inaccuracy meter and data mistaken were found from percentage of recorded meter which lower from the volume of legal revenue consumption. MW was also taken estimation of a 5% irregularity on reading meter from total volume of legal revenue consumption. To cover volume of loss of water up cause by meter inaccuracy, MW add amount volume of water 1.5 million cu meter per year.
c. Physically loss of water
Loss of water in Semarang MW also physically occurs, cause by leak of water in transmission pipes and main pipe, as well as loss of water from reservoir overflow. Based on water balance calculation, volume of physically leak of water was 24.910.297 cu meterper year or 30.35% from the total production in the year 2009. Sutjahjo (2009) pointed out that loss of water is (volume input – legal consumption – commercially loss).
Based on that formula, physical loss of water = (82.047.003 – 43.631.930 – 13.532.765) cu meter = 24.910.297 cu meter.
Table 2 2009 balance water of Semarang MW (2009 analysis result) volume of loss of water based on NRW method.
Control function of water balanceto commercially loss of water
Figure 1. shows the graph of the loss of commercial water, shows increasing of loss of commercial water in the year 2007 and 2008. If observed since the implementation of policies to conduct audits water with more detail 2006, using water balance instead of reckoning Unaccounted for Water (UFW). UFW not as complicated as water balance with NRW, the number of increasing loss of commercial water is caused by unpreparedness of MW in administrative inventoried and processing data in site. The indication can be seen from data of questionnaire for the case wrong reading meter by the site officers, and in optimum meter. Those two problems take long time to make better, considering lake of the amount of person and time, and also the problem of water burglary which still occurs. In addition unpreparedness of human resources for data processing, force, since the year 2006 – 2008, MW have to adjust with the new water auditing as replacing UFW.
In 2009 the level of loss of commercial water decline up to 16.5 percent, from 29.8% in 2008 and 25.3% in 2007. However, in 2006 the loss of commercial water was recorded only 15.54%, yet this figures was false number, because the year of 2006 was the beginning of the new method of water audit put into effect, so it is logic if there are some data items are not take into account, also the reasons were the highest of loss of water (43.49%) and was not optimally handled yet.
Figure 1Graph shows progress component of commercially loss of water
One reason or item of loss of commercial water is illegal consumption. Even though the fluctuation dynamic, but still under 10%. Based on the questioner, illegal consumption is rarely done by the consumers (89% answer do not know or there are not illegal consumption), anyhow, if show to water balance estimation, illegal consumption may be done by very small consumers, because they are afraid with the risk if catch, and the system also concealed enough as well as difficult to detected. This difficult to detect make the amount of loss of water high (6 – 9% from total production). One method to reduce loss of water cause by illegal consumption is by intensively unknown inspection and placed the water meter outside the building.
Based on MW technical findings, majority of illegal consumption was cause by unsatisfied of
society to the MW tariff that the society fell to high. To reduce the amount of illegal consumption,
based on technician data questioner, increasing of tariff must be balanced with increasing of the
quality of MW service on supplying clean water.
Control Function Water Balanceto Physical Loss of Water.
Control function water balance to the physical loss of water cannot be regardless from the performance of field technician who involve to MW’s Division of Transmission and Distribution to make improvement and normalization of pipe network, as well as the policy of municipal government as MW owner.
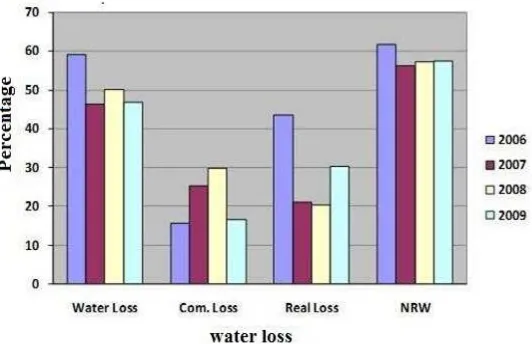
Figure 2The graph of development of Water Loss in Semarang MW
Based on the development of handling physical loss of water within 2006 – 2009 as shown in Figure 2, the real physical loss of water in Semarang MW from 2006 to 2009, have significantly declined (about 20%) in 2007 and 2008, but then again increase about 10%.
maintenance. External factor which affect increasing of physical of loss water, was the target of income which determine by the Major of Semarang as the owner (Sorasem, 2009), who have plot the income target by 10% per year in 2009.
Increasing the amount of consumers, will straightly proportional to physical loss of water. Significantly increasing the amount of consumers was not offset by installation equipment and improving of old pipe network (majority of pipe have used for more than 25 years), caused increasing the number of physical loss of water. Old pipe network was the primary factor the reason of leaking of water (data of questioner, 2010). Can be concluded that the increasing of consumers is the reason 10% target of declining loss of water was not reach (Koran Jakarta, 2009).
In 2009 Semarang MW only able reduces 3.36 % loss of water, and this can be understand since the target of 10% was too high, considering MW resources and one year time given was not sufficient.
There are six groups of site technician in Semarang MW, four groups was for repair and the other two groups for water distribution. Formation of each group is according to Standard of Operational Research and Development Board of the Department of Public Works (2002). However, four groups for repair were not insufficient to serve area of Semarang to be completed in target, since the report show that the amount of leak and disturbance in flow of water was significant, i.e. 4 to 6 cases per day. (Semarang MW data, 2009). Target fulfillment by the Government of Semarang to add costumers in the limitation of supporting means have caused physical of loss water in 2009 increase.
CONCLUSIONS
a.
Loss of water model using water balance to audit the system of appropriation of drinking water in Semarang MW have worked in trace on recording and monitoring performance of the system within 2006 to 2009. This function according to General Regulation No. 16/2005 Article 1, that informing the development of water supply system, especially to monitor the progress of loss of water. Loss of water track record of 2006 – 2009 has given the constraints obstacle face by MW in its effort to provide clean water service, and maintaining efficiency of the system, by (a) improving the quality of human resources especially in field of administration or data, (b) add the site technician, and (c) management or policy on tariff.b.
In the last 2009, Semarang MW undergo inefficiency 57.4% in water supply systems by losing largest physical lose water reach 30.35%. Physical loss of water includes leak in transmission pipe and main pipe, overflow reservoir and leaks of service pipe as well as consumer meter. The main factor causing leaks was pipe network which elderly more than 25 years and damage in units water treatment of MW.REFERENCES
Sutjahjo, Budi (2009). Audit and Water Balance of the National Workshop on Energy Efficiency and Water Audits For Improved Performance of Municipal Waterworks (MW). Jakarta
SemarangMW (2009), Balance Water 2008 Report. .
Permendagri (Minister of Home Affair Regulation) No. 23 Year 2006. Technical guide and Procedure for Regulating Drinking Water on Municipal Water Company in Jakarta.
Perpamsi (2009). Semarang Municipal Waterworks. www.perpamsi.com.