Baratawidjaja et aI. Med J Indones
Allergy profile
study
in
patients attending
a
private allergy
clinic
Iris
R.Baratawidjaja*
,Pramita
P. BaratawidjaiaT,Allan DarwisI,
Karnen G. Baratawidjaja*
Abstrak
Studi dilakukan pada 1000 pasien yang berkunjung ke klinik swasta di Jakarta, terdiri atas 416 pria dan 584 wanita dengan usia antara 1 bulan - 79 tahun. Tujuan studi ialah unnk rnengetahui gambaran yang luas mengenai berbagai reaksi alergi dan hubungannya padaberbagai golonganusia. Pasien dibagi dalam, golongan usia A(0-5 thn), B (6-13 thn), C (14-30thn), D (31-50thn) dan E (5I -78thn). Prevalensi asma tertinggi ditemulcan pada A dan rinitis pada B yang disertai dengan sensitivilas tertinggi terhadap tungau debu rumah. Di kedua golongan usia ini asma dan
initis
ditemukan lebih banyak pada anak laki dibanding perempuan. Urticaria merupakan alergi terseing d.an ditemukan terbanyak pada wanita usia muda. Alergi kontak terbanyak ditemukan terhadap nickel dan fragrance, lebih banyak pada wanita dibanding pria meskipun perbedaannya tidak bermalçta. Alergi obat ditemukan pada 25,6Vo, tersering terhadap analgesikdan
NSAID, penisilin, sulfa dan tetracyclin, Alergi maknnan ditemulanpada
28,07o pasien, tersering terhadap ikan, udang/kepiting, telor d.an kncang tanah. Studi menemul<an prevalensi alergi yang sangat tin17i terhadap berbagai alergen pada golongan usia tertentu; yang nampaknya berhubungan denganfaktor dalam lingkungan. Penulis menganjurkan untukmemberil<an lebih banyak perhatian terhadap penanganan dan pencegahan penyakit alergi pada anak dan wanita muda.Abstract
A
study was conductedon
1000 patients attending a private allergy clinic in Jakarta, consisting of 416 males and 584 females, age betweenI
month and 79 years. The aim of the study was to assemble a more comprehensive picture of the relationship between allergicreactionsandallergy-relateddiseasesacrossallagegroups.Thepatientswere groupedintoA(0-5yr),8(6-13yr),C(Ia-30yr)' D( 3l-50yr)andE(51-79yr).ThehighestprevalenceofbothasthmaandrhinitiswerefoundingroupB whichwereaccompaniedwith the highest sensitivity to housedust mite. More males were affected compared to females. (Jrticaria was the most common allergy with highest prevalence in young adult females. Most common contact allergy were due to nickel and fragrance which affected more females compared to males. Drug allergy was found in 25.6Vo, mostly due to analgesic and NSAID, penicillin, sulfu and tetracyclin. Food allergy v,tas foundin
28.0Vo, mostly due to fish, crustacean, egg and peanut. The study found abnormally high prevalence of allergy to several allergens in specific age groups, all seemingly related 1o environmental causes. The authors recommend more attention should be paid to the management and prevention of allergic diseases in the younger age group and young adult females.Keywords: AIIergy profile, riskfactor, sensitisation, bettermanagement, early prevention
Incidence statistics
of allergic
diseasesfor
Indonesia
aredifficult
to obtain becauseof
limited facilities,
time
and
funding available to
researchers.A few
studiesusing
questionnaires have
found a
5Vo -
6.5Voprevalence
of
asthma and
9.8Vo-
27.)Voof rhinitis in
children
and adultsrespectively.l
Our
hospital
offers
several alternatives
for
an allergysufferer.
The EmergencyUnit
and the Departmentsof
Child Health,
ENT, Dermatology
and
Medicine all
have allergy treatmentcapabilities. Asthmatic
patientsDivision of Allergy-Immunology, Department of Medicine, ,Faculty of Medicine, University t of Indonesia, Jakarta
AIIergy and Immunology Clinic, Jakarta
may
also be treated at theDivision of
Pulmonology
in
the
Child
Health
or
the Departmentof
Pulmonology.
Unfortunately,
doctors
working
in
oneclinic
may
not
see
the entire
rangeof allergic
diseases and thereforewill not be able
to
effectively compare profiles
of
different allergic
diseasesin
different
agegroups.
In
addition, the lack
of
standardisation between
studies increases thedifficulty
of producing meaningful
com-parisons.Comparing
datafrom within
studies is muchmore reliable.
In our
study
we
hadthe
opportunity
to
observeprevalence, sex
distribution,
atopic
andother
influences
of various
allergic
diseases
in all
ageVol 7, No 4, October - December 1998
METHODS
In
this study, we
drew
1000files from
thenearly
5000 casehistories
of patients treated since 1992- 1997atthe
Allergy-Immunology
Clinic. Most
patients
were
referred
by
outside
generalpractitioners
or
specialists(internists,
paediatricians,
dermatologists, ENT
specialists
andothers)
with
diagnoses such asallergic
rhinitis (further called rhinitis), dermatitis,
bronchial
asthma,
drug
/food allergy
andchronic
urticaria
for
allergy
evaluation, or with
symptoms
of
possible
al-lergic
mechanisms.The patients
were classified
into
group
A
(0-5
yr),
B
(6-13
yr),
C (14-30
yr), D
(31-50
yr)
andE
(51-19)
yr.
Every patient was given a
general
physical
ex-amination
supplemented
by
Skin Prick Test
(SPT),
Patch
Test and specific
IgE (ELISA)
measurement,chest
X-ray (on all
patients
with
asthma
andchronic
cough) and sinus X-ray
when indicated.
A
further
diagnosis
of
bronchial
asthma
was made
with
aspirometric examination, PFR
measurement
(Wright
PFM
andMini Wright PFM)
before
andafter
inhala-tion,
or recorded
twice
a dayfor
atleast
14 days.Skin
testsperformed
for
various extracts
of
allergens such asfood, molds, pollen,
cat, dog, HouseDust
Mite
(Dermatophagoides
pteronyssinus and
Der-matophagoides farinae), cockroach and latex.
TheEuropean
Standardfor
Contact
Dermatitis
Allergens
were usedin
the PatchTest.Specific IgE
measurementwas done
on
patients
with skin abnormality,
patientstaking
antihistamines, dermographism
or
those
with
other
allergic
disorders
to obtain
for
comprehensive
results.The results
were analysed
by
descriptive
statistic
method.
Analysis
for
comparing subgroup
proportion
by Chi
SquareTest
and pvalue
0.05 wasindicative of
a significant difference.
All
statistical analysis
wasperformed using
Epi Info
version 6.03
(CDC Atlanta
te96).
RESULTS AND DISCUSSION
The
1000patients
agedbetween
I
month
-
79
years werecomprised
of 416 males (mean29.4yr,SD
+15.3)
and
584 females (mean 27.3
yr,
SD +12.5).
Becauseprevalence,
sexdistribution,
triggers
and otherfactors
may
vary
in
different
age groups, subjects
weredivided
into
five
age groups. The total number
of
patients
of
each agegroup is shown
ontable
1.Allergy profiIe
study
205PREVALENCE
AND SEX
DISTRIBUTION
The prevalence of the
allergic
diseasesin
1000 patients rankedby
frequency
were
451(45.IVo) urticaria,
390 (39.08o)rhinitis,
288
(28.8Eo)bronchial
asrhma, 280 (28.0Eo)food allergy, 256
(25.6Vo)drug allergy,
82 (8.7Vo)chronic
cough, 77 (7.7Eo)Quincke's
edema and75
(7.5Eo)dermatitis
(table
1).
In this study
chronic
cough
is included,
as increasedincidence of
chronic
coughoften
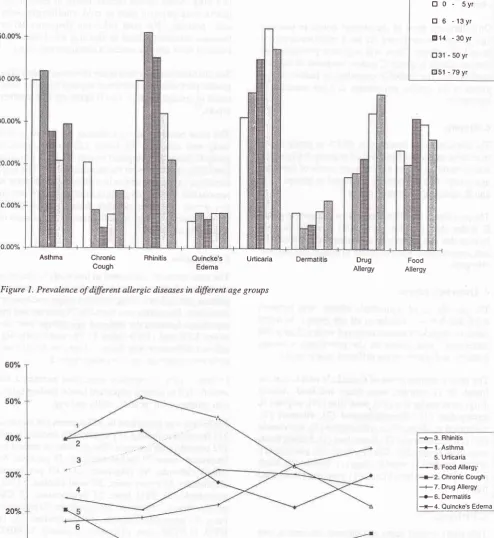
precedes asthma. Prevalencecomparisons
for the allergic
diseasesby
age
group are
shown
in
figure
1.We
studied the sexdistribution
of
theallergic
diseasesin different
agegroups
(
table 2). Except in
group C
(female
=
2.7
x
males),
theratio
male/female patients
were
relatively
constant. The
sexdistribution
and the possiblefactors contributing
to femaleoverrepresenta-tion in
group C
will
be discussedbelow.
a.
Bronchial asthma
The prevalence
of bronchial
asthmain
group
A (figure
2)
was
39.8Voincreasing
in
group
B
reaching
to
amaximum
at42.0Vo, decreasingin
groupsC
andD
andincreasing
slightly in
group E. The rise
in
prevalence
in
group
B
can be explained
dueto the high activity
levels ofolder
age grouf) exposing them to moreindoor
andoutdoor
allergens.In
Group
A
(table
2),
theprevalence
of
asthma
wasgreater
for
males
compared
to,females
(p=0.021),
agreeing
with
the literatures.-""
The disparity
is
reduced
in
older
age groups.
As
remissions
from
asthmaduring
adolescence are lesslikely
in
females,the ratio
of
male/female asthmatics reaches
ap-proximate parity in
adulthood.5 Wefound Il4(3g.6%)
rhinitis
among
288 asthmatics
accompanied with
rhinitis,
as comparedwith
approximately
5-20Voof
the
generalpopulation.
Among
390patients
with rhinitis,
wefurther
found
180 (46.2Vo) asthmatics as comparedwith
5Voprevalence noted
in
the general population.
This finding
showed
astrong
link
between bronchial
asthma andrhinitis which is in
agreementwith
other
finding.
The
mechanismsconnecting upper
andlower
airway dysfunction
arenot
entirely
undËstood.6
b. Chronic
cough
206
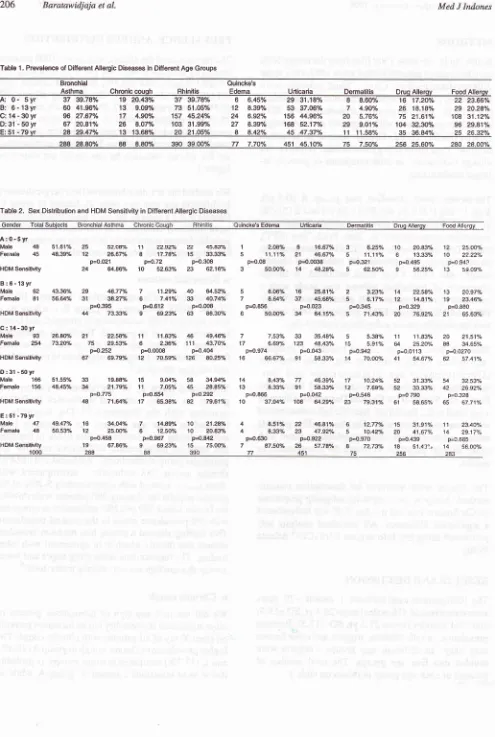
Baratawidjaja et al. Med J IndonesTable 1. Prevalencê of Difterent Allergic Diseases in Ditlerent Age Groups
'Bronehial
Quincke'sAsthma
Chroniccouqh Bhinitis
Edema
Urlicaria
Dermatitis
Oruq Allerav Food AllerwA:o.5yrg7gg.78oA1g2o.4ghg7gg.78%66.45%2g31.18%88.m
B: 6- 13yr C:14-30yr
O:31 - 50 yt
60
41.96% 13 9.09%
7351.05% 12 8.39%
53 37.06%7 4.90%
26 18.1Bo/o
29 20.28%96
27.67% 17 4.90o/"
15745.24Vo 24 6.92Vo
15644.96% 20 5.76%
7521.61"/"
108 31.12%67
20.81y" 26 8.07o/"
10331.99% 27 8.39%
16852.17Vo 29 9.01"/0
10432.300/6
96 29.81%E:51-79yr
2829.47o/"
1313.68%
20 21.05%8 8.42V"
4547.37V"
1111.58%
3s
36.84%
2s
26.320/"288
28.80V" 88
8.80% 3903900% Tt 7.70"/.
45145.10"/" 75
7-SOo/" 256 25.600/" 2SO 28000/"Table 2. Sex Distribution and HDM Sensitivity in Ditferent Allergic Diseases
inck€'s
Edema Unicaria
Oermalitis
Drug Allergv Fæd AllergvA:0-5yr
Mal€
48Fsr,lalo 45 51.61% 25
48.39"/" 12 s2.o8y" 11
22.920/o 22 45.830/o 26.67% 8 17.746/" 15 33.33"/"
p=0.021 p=o.72 p=0.308
64.86"Â l0 52.63"/" 23 62.16Yè 46.77"/. 7 11.29yo 40 64.52h
s8-27% 6 7.41Vo 3it 40.740/" p=0.395 F0.612 p=0.0o8
73.330/" I 69.2æ/" 63 85.30%
p4.252 p=O.0008 p=0.4O4 69.79% 12 70.597" 126 80.2504
19.88% 15 g.Mh 58 34.940À
21.79Ph 11 7.050/. 45 2E.a30A
p=O.775 p=0.654 p=O.292
71.64"/" 17 65.38% 82 79.6t%
u.o4% 7 14.89V" 10 21-2Aflo 2s.ooo/" 6 12.50% 10 20.83"/"
p=0.458 p=0.967 p4.842 67.86V" I 69.230l" 15 7S.Oæh
1 2.O8% 8 16.67% 3 6.25"/. l0 20.83"/" 12 2sO01"
s 11.1'lyo 21 46.670/" 5 11.11ï" 6 13.33./. 10 2222"/"
p=o.08 p=o.00i18 p=o.321 p=0.495 p=O 943
3 50.00% 14 48.2gfl. 5 62.sO/" 9 56.25"h 13 s909%
5 8.06% 16 25.816/" 2 3.23V" 14 22.581" 13 20.97%
7 8.640/" 37 45.68% 5 6.170/. 't2 14.8't"/" 19 23.46y"
p=0.856 p=O.023 p=0.345 p=0.329 p=0.880
6 50.00% 34 64.15% 5 71.43y" 20 76.920/o 21 65.63./.
7 7.530/o 33 35.48% 5 5.38% 11 11.83% 20 21.510/è 17 6.69% 123 48.43y" 15 5.91"h 64 25.2æ/" 88 34.65%
p=0.974 p=0.O43 p=O.942 p=0.0113 p=0.027o
't6 66.6r 91 58.33% 14 70.OOo/" 41 54.670/. 62 57.41"/"
14 8.43Â Tt 46.39% 17 10.24ïo 52 31.330/. 54 32 53%
13 8.gto/o 91 58.330/" 12 7.690/. 52 3i).330/" 42 26.92y"
p=o.866 p=0.042 p=0.5{6 p=o 790 p=0.328
10 37.M"/" 108 64.29"/" 23 79.310/è 6.t 58.6s% 65 67.71y"
Male 93 26.80f/o 21 22.58"/" 11 11.83% 46 49.46yo Fomds 254 73.2e/" 75 29.s3V" 6 2.36"/" 11 1 43.701" HOM Senslûvlty 24
B:6-13yr
Mals 62 ,$.36% 29
Fsmale 8l 56.64% 31
HDM Sensitivity 44
C:14-30yr
HDM SssllMly 67
D:31-50yr
Male 166 51.55% il] Famale 156 48.451" U
HDM S€nsiliviiy 48
E:51-79yr
Male 47 49.47"/" 16
Femalo 48 50.53% 12
HDM Ssnsitivlly 19
4
I 8.51% 22 46.81% 6 12.770/è 15 31.91%
.11 23.40./" 833% 25 47.92ô/" 5 10.4210 20 41.67% 14 29.17"/"
p=0.6:to p4.922 p=0.970 p=0.439 p=0.6s5
7 87.5æh 26 S7-780/o I 72.73y" 18 51.43:, 14 56.00%
71 451 75 256 2a3
[image:3.595.49.540.87.678.2]Vol7, No 4, October - December 1998
[image:4.595.49.544.99.638.2]Rhinitis Quincke's
Urticaria EdemaFigure 1. Prevalence of different allergic diseases in
dffirent
age groups2
3
4
0
-
Syr6
-13yr
14 -30yr
Asthma
ChronicCough
Dermatts
Allergy
Drug
AilergyFoodAllergy profiIe study
tr
0
-
syrB 6
-13yr814
- 30 yrtr31 - 50 yr @51 - 79 yr
-ô-3.
Rhinitis--.-
1 Asthma 5. Urticâria-8.
Food Allerg).
--r-2. Chronic Cough ---+-7. Drug Allergy
--.-6. Dermatitis --x-4. Ouincke's Edema
6
7
I
Figure 2. Prevalence of allergic diseases in different age groups
208
Baratawiàjaja et al.group
F,
due
to
bronchitis,
smoking and similar
causes.'On
follow
up,
most
of
the
chronic
cough
in
younger
age groups
were
found
to
be a
manifestation
of
bronchial
asthma.
There
was
a
greaterprevalence
of
chronic cough
in
group C
males comparedto
females(p=0.0008).
The
probable
contributing
factors
in
this
group
is
the
greater percentage
of
male
smokers
in
Indonesia.
c. Rhinitis
The prevalence
of rhinitis
was
39.8Voin
group
A.
As
in
asthma, the prevalence peakedin
group B(figure
2),which could
be dueto high
activity
levels
of
theolder
age
group. The prevalence
decreasedin
groups C, D
and
E,
agreeingwith
other
report.oThe prevalence of
rhinitis
(table
1) washigherin
group
B
males than
females
(p=0.008) possibly
because boysin this
agegroup
tend to bemore
active thangirls
and
consequently
more exposed toindoor
andoutdoor
allergens.
d.
Quincke's
edema
The
prevalence
of
Quincke's edema
was
between 6.5Vo and8.4 Vo,
similar
in
all
agegroups.
In
many
patients
Quincke's
edemaoccurred
with
urticaria. No
difference
was
found
in
the prevalence
between
females
andmales in
the
different
age groups.The most common
causeof Quincke's
edema that wefound in
'17 patients,
were drugs
and
food.
Among
drugs
were
analgesics(29),
penicillin
(19),
sulpha(9),
tetracycline
(3),
chloramphenicol
(2),
vitamins
(2),traditional
medicine (2),
erythromycin
(1), loperamide
HCI
(l),
streptomycin
(1),heartdrug
(1).Amongfoods
were crustacean
(30), fish (7), lamb (2),
chicken (1),
instant noodle (1),
wine (l),egg
(1), tomato (1), black
pepper (1), chocolate (1),
rice
(1),emping (1)
anddried
fish
(1).
e.
Urticaria
This
study treated acute
andchronic urticaria
as onediagnosis.
Acute urticaria is arbitrarily
defined
asur-ticaria
of
< 5 weeks andchronic urticaria of
> 5 weeks.Chronic urticaria
accountsfor
approximately
75Voof
all urticaria.
Theprevalence
of urticaria
was 3l.2Voin
group
A,
rosein
groupsB
andC, peaking
in
group
D
(table
I
and
figure 1). Group E, however,
showed
alower
Brevalence
than group
D agreeing
with
other
report.'
Med J Indones
The most common
cause of acuteurticaria
were
food
and
drug.
Some causal
factors
found
in
chronic
ur-ticaria
were
physical
such
ascold, cholinergic,
solar
and
pressure.
No
viral
infection
(hepatitis
B) or
parasitic
infection
related
to urticaria
was
found.
The causeof
most chronic
urticaria
remained unknown.
Sex
distributions
in
urticaria
are shown on table2.The
greater prevalencein
females comparedto
malsswere
noted
in
groups A, B,
C
andD
agreeingwith
anotherreport.lo
The most common allergic
diseasewe found
in
this
study was urticaria.
We
found
123
female urticaria
group
C
(table 2)
comparedto only
33male
urticaria
ip=o.ozg),
agreeingwith
theliteratures.ll-12 Th"
high
incidence
of female
urticaria within
thepopulation is
responsible
for
the overrepresentation
of
females
in
this
group.
An
other possible factor responsible
is
possibly
because atopyin
adult group
isfound
morein
females thanmales."
f. Dermatitis
The
term
clermatitis was usedin this
study to
describeall
forms
of disease
which involve the
eczematous process, notdifferentiating
betweenatopic
andcontact
dermatitis. Dermatitis
wasfound
in
75patients
and the prevalence betweenthe
different
agegroups were
be-tween
4.9Vo andlI.6Vo (table
1).No statistically
sig-nificant difference
was
found between
female
and male prevalencein
any
agegroup (table
2 ).Patients
with
dermatitis
were also examined for
specific IgE to
severalimportant foods,
finding IgE
tofish,
shrimp,
crab,peanut, milk,
and egg.Patch Test was
performed
in
307patients (96
males&
211females)
including
75 patientswith
dermatitis
and232 patients
with urticaria.
The prevalence ranked by
frequency
were
77 nickel
sulphate,
7l
paraben,
69cobalt chloride,
61
fragrance
mix,
49
potassium
dichromate, 38 epoxy resin,
36 wool alcohol,
31
for-maldehyde,
31
PPD base,
27
benzocaine,
23
CM
isothiazolinon,
23primine,
20 colophane, 20 balsamof
Peru, 19 neomycin sulphate, 18 quaternium
15,
16IPPD,
14PTBF resin,
14 lactonessequiterp,
12MBT,
11clioqinol,
11mercapto
mix,
8 thiuram
mix.
We found
of
77 allergies
to
nickel, 58
(27.5Vo)in
females and 19 (l9.8Eo)
in
males,
of
61
allergies to
fragranôe,
44
(20.9Eo)in
females
and 17
(17.77o)
i.n maies(table
3),which
agreedwith
other findings.la-16
However the differences between male and
female
Vol 7, No 4, October - December 1998
incidence
of
theseallergies
in
females
was dueto
thegreatû
likelihood
of femaleswearing
casualjewellery
and
using cosmetic/fragrances
comparedto
males.Table 3. Sex distribution in Nickel and fragrance allergy
Contact
Allergen
Patch Test MaleFemale
TotalNickel
+19
58
77l9.79Vo
27.49Vo77
153
2308O.2lVo
72.5lVo
p=0,19496 211
307t7
44
6177.7l%o
20.85Vo79
t67
24682.29Vo
79.l5Vo
P=0,62796 2ll
307Total
Fragrance
+g.
Drug allergy
Drug allergy
was
found
in
256
(25.6Vo)
of
1000 patients(figure
1). The prevalencein
females(p<0.05)
was
higher compared to
malesin
group C (14-30
yr.).
This
also can
be
explained
by
the greater
allergy
prevalence
in
females
of this ug"
groop.l3 The
drugsmost
commonly
causing
allergic
reactions ranked by
frequency
were:
158 analgesic and
NSAID,
108penicillin, 42
sulfa,
13tetracycline,
8 cough remedies, 7vitamin,
5chloramphenicol,4 streptomycin,4
tradi-tional medicine, 3
antihistamine,
2
steroid,
2
antacid
and
other drugs
such asacyclovir,
terbutaline
sulfate, ephedrine,metronidazole, loparamide
HCl, rifampicin
andguinolon. This list largely
agreeswith
the
litera-ture.l6
The most common
clinical
manifestations
of
drug
al-lergy
were
urticaria
andor Quincke's
edema.Sulfa
isone
of
the
very allergenic
drugs.
We noted only
42sulfa allergy
cases.This
is
not surprising
since this
drug is
now
much less prescribed compared to the past.We also found
cross reactions among
the penicillin
preparations and among analgesicandNSAID.
Greaterprevalence
of
drug
allergy
wasfound in
females
than males.This
is maybe Fecause females are moreallergic
in nature than
malesl2
or because our subject consistedof
more female
thanmale
patients.h.
Food allergy
We
used
the term
food
allergy
in this
study although
food
intolerance
might
bemore appropriate,
since theAllergy profile
study
209involvement
of
the immune
system such
aspositive
SPT and
RAST to certain food could not always
beshown.
Food allergy were found
in
280
(28.0Vo)
of
1000
patients
(table
1).The prevalence
in
female
washigher (p=0.02)
comparedto
malesin
group C (14-30
yr.
group).
This
may
berelated
to
the greater
allergy
prevalence
in
females
of
this
age
group. The
most
common foods causing allergic reactions ranked
by
frequency
were:
163fish,
I
10crustacean,32
egg,23
peanut,
18chicken,
II
lamb,
7milk,
5durian,
5squid,
5
food additives,
4 mussels,4 ice,3
pineapple,
3 greenpepper,
3
rambutan,
3 dried
seafish
and others
(fer-mented
cassava,MSG, corn,
avocado,
banana,black
pepper, cheese,chocolate, emping
(fried
rice cracker),
grape,
jackfruit,
soursop,
tomato, tempe
(fermented
soybean), tuna, honey,
tomato
sauce,and
wine.
This
list largely
agreeswith
the
literature.lT-18 Allergy
to
dried fish
was
found much
less
than allergy
to
fresh
fish.
This
might
be dueto
a changein
thefish
allergen
structure
by
the
process
of
drying.
We
also
found
greater prevalence
in
females
comparedto males,
dueto the
fact
thatfemales
aremore
aliergic
than males.12SPECIAL CONSIDERATIONS
a.
Sensitivity to
House
Dust
Mite (HDM)
Sensitivity
toHDM
surveyed by
SPT(reaction
>2+)
and or
specific IgE
measurement toDermatophagoides
pteronyssinus were done
in all
patients.
The
sig-nificance
of HDM sensitivity
in
asthmaand rhinitis
is
already
known.
In
our
study,
the highest HDM
sensitivity
in
asthma
(73.3Eo)
and
rhinitis
(83.6Vo)were found
in
group
B,
which
also had
the
highest
prevalence of those diseases.
Many
studies havefound
a
correlation
betweenthe
degreeof
exposureto
HDM
andseverity
of
the disease.A
high
percentageof
posi-tive
SPTreaction (>2+)
toHDM
was alsofound in our
patients
with
chronic cough
(5Z.6Eo-
70.680) andder-matitis
(62.5Vo-79.3Vo). This might
be due noronly
rothe facts
that many
of
thepatients
with
chronic cough
and dermatitis
also
suffered
from
asthma and or
rhinitis, but
alsothat
theHDM
alsoplay
arole
in
themechanism of these
allergies.
As is alreadymentioned,
chronic cough
werein many of
ourpatients proofed to
be
amanifestation
of
bronchial
asthma.Aggravation
of
skin symptoms after
exposureto dust
and improve-mentof
eczemain patients
allergic to
dustwhile in
anallergen
free
environment, association
of
elevated
serum
IgE
in
many patients
with
atopic
dermatitis,
positive
Patchtesting
toHDM in
atopic patients,
havebeen
reported.''
Epidemiological
studies
have
alsofound
strong evidence
of
a possible pathogenic
link
par-2lO
Baratawidjaja et aI.ticular, young children who
developAD in
thefirst
1-2yr
of
life
stand
ahigh risk of also developing
asthmatefore
the ageof
5 yiars.20'21Th"re
studiËsùggested
apathogenic
role
for HDM
sensitivity
in
atopic
der-matitis which
support our finding.
b. Onset
of
asthma and sensitivity to
HDM
The
onsetof atopic or extrinsic asthma
is
reportedto
be more frequent
in
patients
<
30 year
of
age(early
onset),
while
intrinsic
asthma onpatients >
30 yearof
age(late onset).
In
adults who
had been diagnosed ashaving
asthma,infection with rhinovirus
wasusual-ly
associated
with
wheezy
bronchitis.
In
our
study,among the
184early onset asthmatics, sensitivity
toHDM
wasfound in
136(73.9Vo)
andin
94 late onsetin66
(7O.2Vo) patients.We did not
find
anydifference
in
HDM
sensitivity
between
early
andlate
onset of
asthmatics(p=0.65).
c. Correlation
between
positive SPT and
positive
specifÏc
IgE
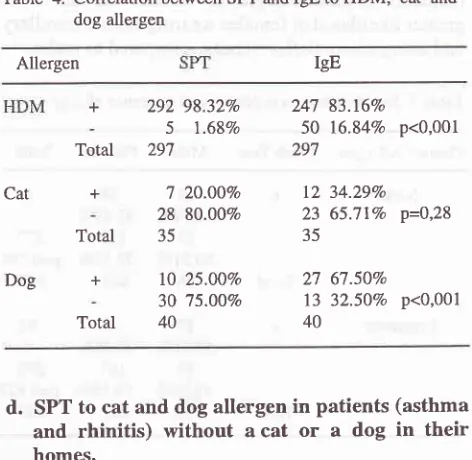
i. HDM
In 297
asthmatics and allergic rhinitis patients both
SPT and specific
IgE to HDM
measurement
wereperformed.
Of
these,292 (98.3Vo)
werepositive
and5 (l3%o) were negative on SPT to HDM
(table 4).
A
further
247
(83.2Vo) were
IgE
positive
while
50(l6.8Vo) were IgE negative
to HDM. This
indicated
that SPT was more sensitive compared toIgE
measure-ment (p<0.001).
ii.
Cat
andDog
SPT and specific
IgE
measurements
to
cat allergen
were performed
in
35
asthmatics and/or
rhinitis
patients
with
a catin their
homes(table 4). We found
I
(20.0Vo)were SPT
positive
and
12
(34.3Vo)were
IgE positive
tocat allergen (p=0.28).
The sameproce-dure was
performed on 40 patients
for
sensitivity
to
dog allergen
with
a dogin their
homes.We
found
10(25.\Vo) wereSPTpositive
and27 (67.5Vo)
were IgE
positive
to dogallergen (p<0.001).
The testsindicated
that at least 34.3Vo patientswith
a cat and atleasl67 .57opatients with
adog in their homes were
sensitised tothose pets.
In
contrast
with sensitivity to
HDM,
sen-sitivity
to dogs can be morereadily
discoveredthrough
IgE
measurementcompared
to SPT. This can be
ex-plained due to the antigens usedin
theIgE
assay.HDM
antigen consistsof 10
groups andusually only group
1or
group
2 is
used
in
IgE
assay.Both cat and
dog allergensconsistofonly
2 groupsofallergens andboth
are
readily
usedin the
assay. [image:7.595.306.542.90.320.2]Med J Indones
Table 4. Correlation between SPT and IgE to
HDM,
cat anddog allergen
Allergen IgE + Total + Total + Total 98.32Vo l.68Vo 20.007o 8O.OÙVo 25.0QVo 15.OO7o 83.16%o
l6.84Vo p<0,001
34.29Vo
65.7lVo P=QP$
67.50%
32.50Vo p<0,001
d.
SPT to cat and dog
allergen in patients (asthma
and
rhinitis)
without
acat
or
a
dog
in
their
homes.
We
compared thepositive
SPTto cat
anddog
amongpatients (asthma and
rhinitis)
without those pets
in
their
homes ( table 5).
Of
265patients without
a catin
their
homes, wefound positive
SPTin99
(37 .4Vo) andin
166 (62.6Vo)negative SPT to cat
(p-0,07)
.Of
227patients without
dog in their
homes,we
found
posi-tive
SPT
in72
(3I.17o)
and in
155 (68.3Vo)negative
SPTto dog (p=Q.lJ).
Sensitisation to HDM
occurred
in
the homes due to close contactwith HDM
allergensin
mattress,
pillow,
sofa and carpets
which are
dustreservoir
and
placesof
mite
infestation. Due to
their
aerodynamis
sizeof <
5pm, cat
anddog allergens
areairborne
andreadily inhaled by patients when visiting
ahomewiththosepets. This
explainswhy sensitisation
to
cat
or
dog occurred also outside the homes
andwhich
are probably responsible
for
immediate
symptoms experienced
by
cat and dog
sensitive
asthmaticsfollowing
short exposurein
the homeswith
cator
dog.Table 5. SPT to cat and dog allergens in patients (asthma and
Rhinitis) with and without cat and dog in their homes
Petathome
SPT+SIrI
-
Total 247 50 297 12 23 35 27 13 40 292 5 297 7 28 35l0
30 40 Cat Dog Cat 28 166 194 30 155 185Yes
7No
99Total
106Yes
10No
72Total
8220.00%
37.36Vo
25.ÙOVo 3l.72Vo
80.007o
3562.64%
265 P=Q,Q1 30075.00Vo
4068.28Vo
221 p=Q,tJ267
Vol 7, No 4, October - December 1998
e. Allergy Triad
Allergy triad
(
asthma,rhinitis
and
dermatitis
simul-taneously
in
one
patient)
wasfound
in
6 patients
(3males and 3
females),
2fromgroup A,
3from
group
C(1
male,
2females)
and 1from
group
E.All
6 patientsshowed
astrong
sensitivity to HDM.
One had adrug
allergy (analgesic),
one hadfood allergy (shrimp),
andone had
food (shrimp, fish, local food
tempe) anddrug
allergy
(penicillin).
CONCLUSION AND
RECOMMENDATION
The most common allergic reactions found
in
this
study ranked
by
frequency were urticaria
(45.7Vo),rhiniti
s (39 .0 Vo), bronchi al as thma (28.87o),food
aller-gy (28.0Vo), drug alleraller-gy
(25.6Vo),Quincke's
edema(7.1Vo)
and
dermatitis
(7.5Vo).There
aremore
malesthan
females
with
early
childhood
asthma andrhinitis
compared
to later childhood but
in
adults there
weremore
females
than
maleswith urticaria, food
allergy
and drug
allergy. We
alsofound
alinkbetween rhinitis
and asthma.
The highest
HDM
sensitivity was found
in
the
agegroup
of
6-13
accompaniedby
thehighest
prevalenceof
asthma and
rhinitis.
High
percentage
of
positive
reaction (> 2+) to
HDM
was
found
also
in
patientswith chronic
cough
anddermatitis. The
SPTto
HDM
rffas
more sensitive
compared
to IgE
measurement.Sensitisation
to cat
and
dog
allergen
also occurred
outside
the homes.Ranked
by frequency
wefound
contactallergy
tonick-el,
paraben,cobalt
chloride,
fragrance
mix
andpotas-sium dichromate; drug allergy
to
analgesic,
NSAID,
penicillin,
sulpha andfood allergy
to
fish,
crustacean,egg and
peanut.From
the results
of
this
study,
we
recommend
housedust
avoidancenot
only in
the managementof
asthmaand
rhinitis,
but
alsoin
chronic
cough
anddermatitis.
HDM-SPT
should
be carried out
in
rhe diagnosis
of
allergy before the
measurement
of
specific IgE.
Thelast
assayshould
only
be done
with indications.
Thecat
and
dog allergic patients should
take precaution
when
visiting
ahome
with
a cator
dog.Further
moreattention should
bepaid
in
the management andearly
prevention
of
allergy
in
the younger
agegroup
andyoung adult
females.REFERENCES
l.
BaratawidjajaK,
SundaruH,
Samsuridjal D, Sukmana N. Allergic disease in Indonesia. ACI News. 1992:4:166-70.Allergy profile
study
2112. Warner JO, Jackson
WF.
Asthma and other allergicdisor-ders of thelung. In: Paediatric allergy. London: Wolfe; 1994.
p.17-32.
3. Thomson NC, Kirkwood EM, Lever RS. Asthma. In :
Hand-book ofclinical allergy. Oxford: Blackwell; 1990. p. 72-124.
4. Sears MR. Epidemiology of asthma. In: O'Byrne
pM
(ed). Asthma as an inflammatory disease. NewYork:
Marcel Dekker, Inc; 1990. p. l5-48.5. Cerio R. Eczema/Dermatitis. In: Jackson WF (ed). Allergic
disorders. London: Mosby-Wolfe ; 199j, p. 109 -26. 6. Coren J. Allergic rhinitis and asthma. How important is the
link? J Allergy Clin Immunol ,1997;99:5j81-6.
7. Aberg
N,
Sundell J, ErikssonB,
HesselmarB,
Aberg A.Prevalence of allergic diseases in school children in relation to family history, upper respiratory infections and residential characteristics. Allergy 1996;51:232-j .
8. Mygind
N,
DahlR.
Allergic Rhinitis.In
:
Jackson WF, Editor. Allergic Disorders. London: Mosby-Wolfe; 1997 . p.l-18.
9. De Monchy JGR, Kauffman H. Urticaria en angio-oedeem.
in
allergologie. Utrecht: Wetenschappelijke uitgeverijBunge; 1994. p.259-67.
10. Baratawidjaja
K,
SoebaryoRW.
A
Randomised double-blind parallel study of cetirizine versus loratadin in chronic idiopathic urticaria. Presented at the Taiwan dermatology annual congress; 8 November 1995; and at The 2ndAsia-Pacific congress of allergology and clinical immunology;
2l
November 1995; Taipei, Taiwan.
11. Thomson NC, Kirkwood
EM,
Lever RS.Urricaria.
In
:Handbook of clinical allergy.
Oxford:
Blackwell; 1990. p.220-34
12. Jackson WF. Urticaria and related allergic skin disorders. In
: Allergic disorders. London: Mosby-Wolf;1997. p. 127-42.
13. Baldacci S, Modena P, Canozzi
L.
Skin prick test reactivity to common aeroallergens in relation to total IgE, respiratory symptoms, and smokingin
a general population sampleof
northem Italy. Allergy 1996;51:149-56.14. Holgate ST, Church
MK.
Eczema and contact dermatitis. pathophysiology.In:
Allergy.
London: Gower; 1993. p.23.1-10
15. Fitzpatrick TB, Johnson RA,
Wolff
K, polanoMK,
Suur-mond D. Eczemaous dermatitis. In Color atlas and synopsis of clinical dermatology. NY: McGraw-Hill; 1997. p; 48-53. 16. SchultzND,
GianniniAV,
ChangTT,
Wong DC. Foodallergy.
In:
The best guideto
allergy. 3td ed. Totowa: Humana Press; 1994. p. 111-35.17. Pascual C, Crespo JF, Sanchez-Pastor S et al. The Impor-tance of fish
in
IgE-mediated food hypersensitivity. ACINews 1995; (7):73-5.
18. Schultz
ND,
GianniniAV,
ChangTT,
Wong DC. Drug allergies.In:
The best guideto
allergy. 3'o ed. Totowa: Humana Press; 1994. p. 163-78.19. Jones
SM,
SampsonA.
Therole
of
allergensin
atopic dermatitis. In: Gershwin ME, Leung DYM, Editors. Clinical reviews in allergy. Totowa: Humana press; 1993. p. 471-90.20. Warner
JO. The ETAC
trial:
aimsand
methodology.Abstract
for
the symposium: Allergyfrom
skinto
lung. Congress of the European Respiratoy Society; 17 19 t I 99 5 ; p. 18.21. Gergen PJ, Weiss KB. Epidemiology of asthma. In: Busse