SPATIAL MODELING OF LAND SURFACE TEMPERATURE
AND ITS RELATIONSHIP WITH ECOLOGICAL FACTORS
IN BOGOR MUNICIPALITY
EMA KURNIA
GRADUATE SCHOOL
BOGOR AGRICULTURAL UNIVERSITY BOGOR
STATEMENT
I, Ema Kurnia, hereby declare that this thesis entitled
Spatial Modeling of Land Surface Temperature and its Relationship with Ecological Factors in Bogor Municipality
Is a result of my work under the supervision of advisory board and that it has not been published before. The content of this thesis has been examined by the advisory board and external examiner.
Bogor, May 2016
Ema Kurnia
RINGKASAN
EMA KURNIA. Permodelan Spasial Suhu Permukaan Tanah dan Hubungannya dengan Faktor Ekologi di Kota Bogor. Dibimbing oleh I NENGAH SURATI JAYA dan WIDIATMAKA.
Salah satu parameter kunci permukaan bumi melalui proses pertukaran energi dan air dengan udara disebut sebagai Suhu Permukaan Tanah (SPT), SPT juga memainkan peranan penting dalam berbagai penelitian ilmiah, seperti ekologi, hidrologi, dan studi perubahan global. Struktur buatan manusia seperti jalan dan bangunan biasanya memiliki nilai albedo yang lebih rendah dari permukaan bumi dan menyerap lebih banyak radiasi sinar tampak. Hal ini menunjukkan bahwa penurunan dan peningkatan jumlah vegetasi pada permukaan bumi wilayah perkotaan akan menyebabkan efek pulau panas. Tujuan penelitian ini adalah untuk membangun permodelan spasial suhu permukaan tanah di Kota Bogor menggunakan citra satelit Landsat-8, dan untuk mengidentifikasi hubungannya dengan faktor-faktor ekologi. Algoritma Split-Window (SW) digunakan untuk membuat SPT dengan menggunakan input berupa suhu kecerahan, emisivitas permukaan tanah (EPT) dan uap air. Validasi citra dilakukan untuk mengevaluasi nilai SPT dihitung dari citra satelit tahun 2014 Kota Bogor dengan pengukuran suhu lapangan yang dilakukan selama bulan Maret 2015 pada tanggal 2, 4, 7, 9, 11, 14, 16, 18, 21, 23, 25, 28 dan 30.
Validasi citra menunjukkan bahwa suhu udara memiliki hubungan dengan SPT pada waktu siang hari tanggal 2 dan 28 Maret 2015 dengan R² = 0,6119. Jenis tutupan lahan memiliki peranan penting terhadap pola termal panas perkotaan. Pada lokasi penelitian, nilai-nilai SPT meningkat dari pedesaan menuju perkotaan, yang berkisar dari 270C sampai dengan 490C, dengan rata-rata 370C. Pola SPT yang ditemukan tidak simetris melainkan konsentris, dengan zona suhu tinggi terpusat menuju daerah penelitian. Daerah dengan tingkat vegetasi terendah berupa jenis tutupan lahan pemukiman / daerah terbangun dengan nilai SPT berkisar antara 400C sampai dengan 49.50C. Sebaliknya, daerah dengan tingkat vegetasi tinggi yang mengindikasikan keberadaan vegetasi hijau, terutama di bagian selatan daerah penelitian, merupakan jenis tutupan lahan dari lahan pertanian dan lahan rumput dengan nilai SPT berkisar antara 270C sampai dengan 390C. Beberapa wilayah dengan tingkat vegetasi tinggi juga terlihat pada bagian tengah daerah penelitian yang merupakan daerah hutan perkotaan.
ditemukan pada wilayah pemukiman / terbangun (400C), diikuti oleh lahan rumput (35.260C), lahan pertanian dan badan air (35.10C), dan suhu terendah terdeteksi berada di hutan kota (34.10C). Penelitian ini menunjukkan bahwa SPT dan faktor-faktor ekologi di Kota Bogor memiliki hubungan yang signifikan, menyiratkan bahwa peningkatan jumlah vegetasi umumnya akan mengurangi suhu permukaan dan intensitas pulau panas perkotaan. Permodelan spasial menunjukan nilai
Y = 0.33X1 + 0.33X2 + 0.34X3
dimana Y adalah suhu permukaan tanah yang diduga dari variabel X1 sebagai tutupan lahan, X2 sebagai jarak dari jalan, dan X3 sebagai ketinggian wilayah. Penelitian ini menunjukkan fungsi yang disediakan oleh SPT sebagai sarana dalam memperkirakan intensitas pulau panas perkotaan dan suhu musim panas yang diperkirakan terjadi karena perubahan iklim. Diharapkan bahwa temuan yang disajikan dalam penelitian ini dapat berguna dalam perencanaan kota dan ekologi di Kota Bogor. Pengenalan dan kesadaran fungsi ini sangat penting karena dapat berguna sebagai alat untuk beradaptasi terhadap perubahan iklim dan mengetahui dampak negatif dari pembangunan perkotaan untuk meningkatkan perencanaan dan manajemen strategi perkotaan.
SUMMARY
EMA KURNIA. Spatial Modeling Land Surface Temperature and its Relationship with Ecological Factors in Bogor Municipality. Supervised by I NENGAH SURATI JAYA and WIDIATMAKA.
One of the key parameter in the physics of the earth surface through the process of energy and water exchange with the atmosphere called as the Land Surface Temperature (LST), it also plays an important role in a wide variety of scientific studies, such as ecology, hydrology, and global change studies. Man-made structures such as roads and buildings typically have a lower albedo than the natural surface and absorb more visible radiation. This shows that the reduced of the vegetation and the increased in urban surface will cause heat island effect. The objective of this study are to develop spatial modeling the land surface temperature distribution in Bogor Municipality using landsat-8 satellite imagery, and to identify its relationship with the ecological factors. Split-Window (SW) Algorithm was used to derive the LST by using the inputs of the brightness temperature, land surface emissivity (LSE) and water vapor. The image validation was done to evaluate the relationships among LST calculated from a 2014 satellite image of the Bogor Municipality and ground-based temperature measurements monitored during the month of March 2015 at a specific date of 2, 4, 7, 9, 11, 14, 16, 18, 21, 23, 25, 28 and 30.
The image validation shows that the air temperature has a relationship with the LST at a day time of date 2 and 28 of March 2015 by R² = 0.6119. The land cover types has an important role in the thermal pattern of the urban heat island. Across the entire study area, LST values increased from the outskirts towards the inner urban areas, which ranged from 270C to 490C, with a mean of 370C. The LST pattern were found to be non-symmetrical but rather concentric, with high temperature zones clustered towards the center of study area. The areas with the lowest vegetation levels were corresponded to the land cover types of settlement/built-up area with the value of LST ranged from 400C to 49.50C. Conversely, high levels of NDVI indicating the presence of green vegetation were observed, primarily at the south part of the study area, and corresponded to the land cover types of farmland and grass area with the value of LST ranged from 270C to 390C. Some pockets of high NDVI were also noticeable within the central portion of the study area and corresponded to urban forest area.
followed by grass (36.50C), farmland and waterbody (360C), and the lowest temperature detected in urban forest (34.50C). This study found that within the Bogor Municipality, LST and the ecological factors shared a significant relationship,
implying that increasing vegetation abundance will generally reduce surface temperatures and thus urban heat island intensity. The spatial modeling exhibit
Y = 0.33X1 + 0.33X2 + 0.34X3
where Y was the LST suspected from the variables X1 as the land cover, X2 as road distance, and X3 as the elevation. This study pointed on the functionality provided by LST as a means of estimating the urban heat island intensity and the heightened summer temperatures within urban areas which are predicted to occur due to climate change. It is hoped that the findings presented in this study may prove useful to those involved in urban and ecological planning in Bogor Municipality.
Recognition and awareness of this functionality is critical as it can serve as a tool for adapting cities to climate change and knowing some of the negative impacts of urban development to improve urban planning and management strategies.
Copyright © 2016, Bogor Agricultural University
Copyright are protected by law
It is prohibited to cite all or part of this thesis without referring to and mentioning the source. Citation is only permitted for the sake of education, research, scientific writing, critical writing or reviewing scientific problems.
Citation does not inflict the name and honor of Bogor Agricultural University.
A Thesis submitted for the Degree of Master of Science in Information Technology for Natural Resources
Management Program Study
SPATIAL MODELING OF LAND SURFACE TEMPERATURE
AND ITS RELATIONSHIP WITH ECOLOGICAL FACTORS
IN BOGOR MUNICIPALITY
GRADUATE SCHOOL
BOGOR AGRICULTURAL UNIVERSITY BOGOR
2016
Thesis Title : Spatial Modeling of Land Surface Temperature and its Relationship with Ecological Factors in Bogor Municipality
Name : Ema Kurnia
ID : G051120011
Approved by, Advisory Board
Prof Dr Ir I Nengah Surati Jaya, MAgr Supervisor
Dr Ir Widiatmaka, DAA Co-Supervisor
Endorsed by
Program Coordinator of MSc in IT for Natural Resources
Management
Dr Ir Hartrisari Hardjomidjojo, DEA
Dean of Graduate School
Dr Ir Dahrul Syah, MScAgr
Date of Examination: March, 29th 2016
ACKNOWLEDGEMENT
In the name of Allah SWT, the Most Gracious and the Most Merciful. Alhamdulillah, all praises to Allah for the strength and His blessing in completing this thesis, I would like to express my highly appreciation to the following:
1. Prof Dr Ir I Nengah Surati Jaya, MAgr as my supervisor for his supervision support. His invaluable help in the forms of constructive comments and suggestions throughout the experimental and thesis works have contributed to the success of this research and Dr Ir Widiatmaka, DAA as the co-supervisor for his ideas and knowledge regarding this topic during my research.
2. Dr Ir M. Buce Saleh, MS as the external examiner for his positive inputs and ideas.
3. All my lecturer for giving knowledge and experience.
4. All my friends at MIT and at Laboratory of Remote Sensing and GIS (Alos lab) in Faculty of Forestry IPB, for their help and support in finishing my study. 5. All of my family. Thank you for always supporting me.
Bogor, May 2016
LIST OF CONTENTS
LIST OF TABLES xiv
LIST OF FIGURES xiv
LIST OF APPENDICES xiv
1 INTRODUCTION 1
Background 1
Problem Formulation 3
Research Objectives 3
2 METHODOLOGY 4
Time and Location 4
Data and Tools 5
Research Conceptual 5
Data Analysis Procedure 6
Derivation of Land Surface Temperature 7
Ecological Factors 13
Spatial Modeling of LST 15
3 RESULT AND DISCUSSION 16 Land Surface Temperature Distribution 16
Relationship between LST and Air Temperature 18
Ecological Factors Relationship Analysis 19
LST and Humidity Relationship Analysis 19
LST and Elevation Relationship Analysis 20
LST and Road Density Relationship Analysis 20
LST and Land Cover Types Relationship Analysis 23
Spatial Modeling of LST 24
Model Validation 27
4 CONCLUSION 27
REFERENCES 28
APPENDICES 32
LIST OF TABLES
1 Descriptions of the research conceptual 6
2 SW coefficient values 7
3 Rescaling Factor 8
4 K1 and K2 Values 8
5 Emissivity values 9
6 Sample site description 12
7 Ecological factors 13
8 LST proportion area 17
9 Mean LST of Land Cover 17
10 Separation matrix of Landsat-8 supervised classification 21 11 Confusion matrix of landsat-8 supervised classication 22
12 Ground truth of land cover classification 22
13 Land cover scoring 24
14 Road distance scoring 25
15 Elevation scoring 25
16 Weight for each variable 25
17 Spatial distribution of LST 26
18 Confusion matrix validation 27
LIST OF FIGURES
1 Study area of Bogor Municipality 4
2 Research operational flowchart 6
3 Design sampling 11
4 LST map 18
5 Relationship between LST and air temperature 19
6 Relationship between LST and humidity 19
7 Relationship between LST and elevation 20
8 Mean values of LST associated with road buffer 21
9 Land cover classification result 23
10 Mean values of LST associated with each LC type 23
11 Score map of LST and its spatial distribution 26
LIST OF APPENDICES
1 Wet and dry bulb thermometer 32
2 Ratio water vapor content to the total in different atmospheric profiles 32
1
INTRODUCTION
Background
Development in big cities causing global temperature changes that result in a change of climate elements, especially the increase in temperature. This has inspired many countries to resolve the issue, include Indonesia. Bogor Municipality with the rapid development of economics, more and more people enter into the city, which causes the urban area expansion. Now, the global warming has been an international issue that attracting the international attention. At the site level, the land surface temperatures (LST) has been used by many researchers as an indicator of energy balance. Specifically, the LST has been used as a key parameter that describes the land surface processes. Within the urban areas, the LST might be closely related to the urban heat island (UHI) which is mainly affected by the human activities. The causes of UHI mainly comes from the human activities that include lifestyle, that use fossil fuel in main human activities, e.g., liquid petroleum gasses for cooking, electricity for room heating and cooling, gasoline or diesel for transportation, industry etc. The waste from the energy usage by every household was also a secondary contributor to the heat. As the population in the city also grows, this tends to expand the area and increase its average temperature. Development of built-up area with the less green open area may cause global temperature changes that result in a change of climate elements, especially the increase in temperature.
The UHI extent may vary across a city, depending on the spatial distribution of the GHG emitter and absorber. Taha et al. (1990) reported that heat islands can develop in ‘pockets’ around single buildings and temperature differences of 4 °C have been reported along a single street. It is also mentioned that the UHI is affected by the height and spacing of buildings and their orientation relative to the prevailing wind that restrict airflow and limit cooling. Urban with very high ratio between building height and street width, as well as the very dense settlement may have high waste heat from human activities. In Bogor, where only a few tall buildings available, the dominant heat contributors might become from human (metabolic and non-metabolic) activities and road traffic. Fan and Sailor (2005) pointed out that road traffic contributed about 32% of heat emission while the human metabolic heat emission is only 8%.
Frequently, cities have warmer land’s average temperature than its
surrounding suburban and rural areas. The rapid development of built-up areas in Bogor, such as settlements, tall buildings for hotel, commerce, and/or offices, mainly alters the physical characteristics of the land surface, from vegetation to vegetated areas. The replacement of green vegetated surfaces with non-vegetated and non-porous urban materials with high heat capacity and low solar reflectivities, such as concrete masses, asphalt roads and metal surfaces exhibit a high degree of thermal inertia (Arrau and Pena, 2010). These areas are characterized by a high level of absorption of solar radiation, with a greater capacity for thermal conductivity as compared to natural surfaces (Rose and Devadas, 2009).
2
it is also quite common that emission from public traffic as well as private traffic may increase the GHG released to the atmosphere, then eventually increase the surface temperature. Some gasses that are emitted into the atmosphere will act as a greenhouse gas that is transparent to short-wave solar radiation and absorb long-wave radiation of the earth thus increasing global warming. Urban development can raise the local temperature of the city where the rate of temperature rise is proportional to the rate of urban development (Fukui, 2003). The increase of population also caused an increase of heat waste, mainly emitted from non-metabolic activities such as vehicles, personal waste, energy consumption and manufactures etc. This may affect local climate change especially air temperature directly and indirectly (Mas'at, 2008). The temperature of the urban areas might be effectively managed and slightly modified by increasing the extent of GHG absorber or by reducing the source of heat gasses. The common strategy applied is by increasing the amounts of heat energy absorbed and stored in the vegetation. Vegetation would be a very effective way as it delivers several mechanisms of cooling simultaneously and it had been recognized as a very cheap way to implement the cooling strategy.
To spatially measure the spatial distribution of the heat emitter and heat absorber, it needs to develop a technique to derive land surface temperature quickly, consistently, accurately, comprehensively and with a reasonable cost. One technique that frequently applied is by using the remote sensing approaches. Traditionally, the land surface temperature is mapped by using interpolation technique using the data recorded by each national weather station. Interpolation method for sparsely stationed network had been a focus of many researchers, including the examination of geostatistics and deterministic approaches. This method will provide very rough map since the distances between climatology stations are very low. The different interpolation method can provide different accuracy and deviation.
Now, the availability of remotely sensed data recorded using thermal bands, coupling the available middle-infrared, near-infrared, as well as the visible bands, has given a very good prospect. There is no interpolation method required in this approach. The temperatures were derived from every grid of the data. The algorithm used by combining the thermal, near-infrared and red-band of Landsat data, the pixel-based temperature might be derived. On the LST estimation, the accuracy of LST estimation is mainly affected by the surface capability of emitting radiation. In many algorithms, the LST estimations are based on the assumption that the ground surface acts as a blackbody (emissivity equals one).
3 studies on land surface temperature can be found in Liang et al. (2012); Zhang and He (2013). The main objective of the study was to develop spatial modeling of land surface temperature (LST) based on the Landsat-8 OLI and TIRS imageries using Split-Window (SW) algorithm and its relationship with the ecological factors in Bogor Municipality, Indonesia.
Problem Formulation
The most basic needs of the population are housing and vacancies. This has led to the land conversion of green area into built area. Green area has always been a victim because of the assumption that green area is not included in the mechanism of the market economy, and has a market value that is lost by the price of land (Irwan, 2008). The population and land use that are not controlled can lead to reduced quality of the environment. Good environmental quality conditions can be comfortable, healthy, and aesthetically pleasing for residents. According to Oliver (1981) in Irwan (2008), human comfort can be determined quantitatively by temperature and relative humidity indicators. Air temperature is determined to a great extent by surface properties that vary in both space and time (Oke, 1987) and, therefore, directly responds to local changes in land surface (Arribas et al., 2003). Despite the fact that ground meteorological stations provide important local point data, such as air temperature, which is needed to monitor the ecosystem on a macro scale, their spatial density is highly variable and their distribution is usually not optimal for regional and local applications. However, remote sensing data, due to their high sampling rate and repetitive basis over large and heterogeneous regions, offer us a continuous surface that provides additional information between ground meteorological stations where there is a lack of meteorological data (Vogt et al., 1997).
In order to control the urban development especially as a prevent of urban heat island in Bogor Municipality and also as a prediction of the land surface temperature due to relationship with the ecological factors, so it is important to make problem definition. There is some research question that should be known:
1. How is the land surface temperature distribution in Bogor Municipality? 2. How the ecological factors can give a contribution in affecting the land surface
temperature in the research location?
Research Objectives
The main objective of this research is to develop spatial modeling of land surface temperature (LST) in Bogor Municipality. As for the specific purposes of this study are:
1. To estimate the land surface temperature distribution in Bogor Municipality using landsat-8 satellite imagery.
4
2
METHODOLOGY
Time and Location
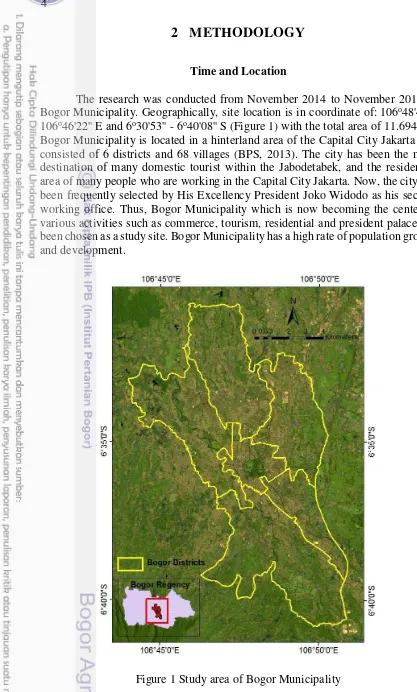
The research was conducted from November 2014 to November 2015 in Bogor Municipality. Geographically, site location is in coordinate of: 106o 48'40''-106o46'22'' E and 6o30'53'' - 6o40'08'' S (Figure 1) with the total area of 11.694 Ha. Bogor Municipality is located in a hinterland area of the Capital City Jakarta that consisted of 6 districts and 68 villages (BPS, 2013). The city has been the main destination of many domestic tourist within the Jabodetabek, and the residential area of many people who are working in the Capital City Jakarta. Now, the city has been frequently selected by His Excellency President Joko Widodo as his second working office. Thus, Bogor Municipality which is now becoming the center of various activities such as commerce, tourism, residential and president palace has been chosen as a study site. Bogor Municipality has a high rate of population growth and development.
5 Data and Tools
The Supporting Data
The main data used are Digital Satellite Landsat-8 OLI (Operational Land Imager) imageries path 112-row 65; acquired on 13th September 2014. The bands used particularly red band (band 4), near infrared band (band 5), and Thermal Infrared Sensor (TIRS), namely band 10 and 11. The data was captured at approximately 10:00:37 a.m. local time. Landsat-8 provides metadata of the bands such as thermal constant and rescaling factor value that used for calculating the LST. Although the Landsat-8 OLI recorded on 13th September 2014, while the ground measurement was done in March 2015, the difference between the temperature in March 2015 and in September 2014 in the day time is not significantly different (at measurement time). The land cover and land use within at the measurement points
didn’t change drastically. Data satellite Aster GDEM has the spatial resolution of 30 m was obtain from the United States Geological Survey (USGS). The humidity data was obtain from the field measurement and from BMKG. While the vector data of basic geospatial information of Bogor Municipality was obtain from the BAPPEDA (Spatial Planning Agency) year 2011.
Software, Hardware, and Tools Used
Software : Erdas Imagine 9.1 and ArcGIS 9.3 for the Remote Sensing (RS) and Geographic Information System (GIS) spatial analysis. Hardware : Personal computer and printer
Tools : - Thermometer (dry and wet bulb) was obtain from laboratory of Geophysics and Meteorology of Bogor Agricultural University (Appendix 1).
- GPS - Camera.
Research Conceptual
6
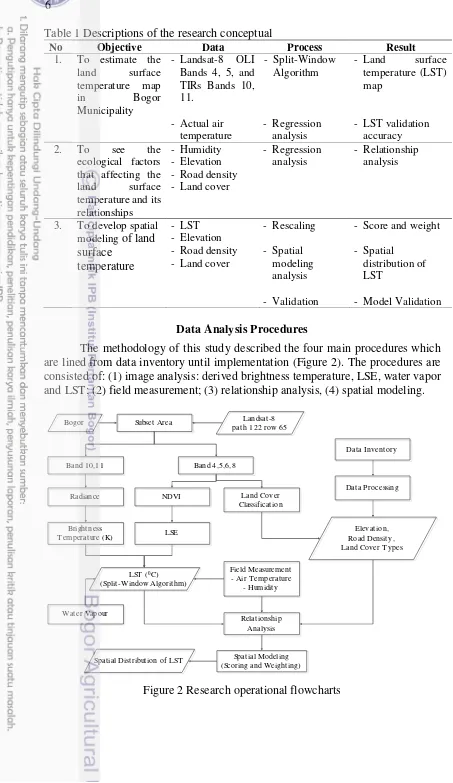
Table 1 Descriptions of the research conceptual
No Objective Data Process Result
The methodology of this study described the four main procedures which are lined from data inventory until implementation (Figure 2). The procedures are consisted of: (1) image analysis: derived brightness temperature, LSE, water vapor and LST; (2) field measurement; (3) relationship analysis, (4) spatial modeling.
Figure 2 Research operational flowcharts
7 Derivation of Land Surface Temperature
Land surface temperature calculated by transforming two bands (10, 11) of TIR DN into a radiance value, and then convert the radiance into the brightness temperature (BT). It also uses the mean and difference in land surface emissivity (LSE) for estimating the LST of an area. LSE was derived from OLI bands of 4 and 5 by using the NDVI threshold method.
Subset area
Subset area was done to define the area location of the research. Landsat-8 scene covers an area of 170 km by 185 km, subset area was to cut out of this larger image to simplify the analysis and focus on the scene portion of primary interest. Land Surface Temperature
Landsat-8 TIR sensor is capable of recording the radiance heat data on the earth's surface in thermal infrared spectrum. The radiance heat information in the thermal spectrum is strongly influenced by the surface temperature and the object emissivity. The higher temperature of an object is the higher intensity of the radiance. Split-window (SW) algorithm was used to determine the LST of an area.
The basis of the SW technique is that the radiance attenuation for atmospheric absorption is proportional to the radiance difference of simultaneous measurements at two different wavelengths (Sobrino et al., 1996). The basic inputs for SW algorithm were the brightness temperature and land surface emissivity (LSE). The Split-Window technique uses two TIR bands typically located in the
atmospheric window between 10 and 12 m. The SW algorithm only requires the
knowledge of water vapor (w).
The brightness temperature of two bands of TIR, mean and difference in land surface emissivity was used to calculate the LST. The formula is in equation-1 (Jimenez-Munoz, 20equation-14): (see equation-7); w is atmospheric water vapor content; and Δ ε is difference in LSE (see equation-8)
Table 2 SW coefficient values
Constant C0 C1 C2 C3 C4 C5 C6
Value -0.268 1.378 0.183 54.300 -2.238 -29.200 16.400 (Source: Skokovic et al., 2014)
Radiance conversion to Brightness Temperature (BT)
8
value and the conversion of the radiance into brightness temperature. Once the spectral radiance L ( ) is obtained by using of equation-2, the brightness temperature at the satellite level can be directly calculated by either inverting
Planck’s radiance function for temperature (Sospedra et al., 1998). Brightness Temperature (BT) of Band 10 and 11 is the electromagnetic radiation traveling
upward from the top of the Earth’s atmosphere. Thermal calibration process done
by converting thermal DN values of raw thermal bands of TIR sensor into TOA Spectral Radiance. TIRS band 10 and 11 was taken to estimate Brightness Temperature (BT) in 0Kelvin using the algorithm of equation-3 by converting the spectral radiance to brightness temperature (BT) for both the TIRs bands.
L = ML * Qcal + AL ….……….(2)
whereμ L is Top of atmospheric radiance in watts/ (m2 srad m); ML is Band specific multiplicative rescaling factor; Qcal is Band 10/11 image and AL is Band specific additive rescaling factor (Table 3).
Table 3 Rescaling factor
Rescaling Factor Band 10 Band 11
ML 0.0003342 0.0003342
AL 0.1 0.1
TIRS bands 10 and 11 were taken to estimate Brightness Temperature for thermal band ith (BTi) in 0Kelvin using the algorithm of equation-3. Brightness temperature for both the TIRs bands:
�= ( 1 � + )
…. (3)
where: K1 and K2 are thermal conversion constant and they vary for both TIR bands (Table 4); L is Top of atmospheric radiance.
Table 4 K1 and K2 values
Thermal Constant Band 10 Band 11
K1 774.89 480.89
K2 1321.08 1201.14
In the IR-range, brightness temperature is also known as equivalent blackbody temperature. The blackbody obtained from the top of atmospheric (TOA) radiance is the brightness temperature of TOA and the blackbody obtained from surface radiance (which contains effect of emissivity and reflected downwelling radiance) is the brightness temperature of the surface. Brightness temperature of the TOA is generally lower than the LST and the brightness temperature of the surface (except for an atmosphere that is warmer than the surface) (Dash, 2005).
9 NDVI
The Normalize Difference Vegetation Index (NDVI) is an index that describes the level of greenness of vegetation. The NDVI value was calculated by dividing the difference of the near infrared from red band and sum of the near infrared and red band obtained from satellite imagery (Lillesand and Kiefer, 1997). Considering pixels as a mixture of soil and vegetation, NDVI was used to calculate the fractional vegetation cover in order to obtain the emissivity variation. The method classifies each pixel as a combination of either bare soil or vegetation and then combines their separate effects to derive LST. The NDVI formula is shown in equation-4, this equation result in an image with pixel value ranging between -1 to 1.
� �� =
�� −�� + ………(4)Land Surface Emissivity (LSE)
Emissivity describes the object’s ability to emit the radiance energy, as the emissivity of the land surface varied dynamically (Nerry et al., 1988), its effect must also be compensated for. Unlike the oceans, the emissivity of land, can differ significantly from unity and vary with vegetation types, surface moisture, roughness, and viewing angles (Salibusbury and D’Aria, 1992). The mean and the difference LSE map of band 10 and 11 in Bogor Municipality is an important parameter when deriving LST as the emissivity of a surface will influence the amount of thermal radiation that it emits. LSE is determined by several factors including the chemical composition, roughness and moisture content of a surface. The emissivity of a surface can have values between 0 and 1, however, for most objects spectral emissivity is very close to 1 (Stathopoulou et al., 2007).
Since LSE can change substantially over short distance, it is important to estimate its value for every pixel prior to applying the split window algorithm. NDVI map was used to retrieving the proportional of soil and vegetation in order to estimate the LSE (Sobrino et al., 2000; Qin et al., 2006). LSE is estimated from information collected by OLI in VNIR bands (reflectance or vegetation indices) depending on the Fractional Vegetation Cover (FVC) for a given pixel (Sobrino et al., 2008). The formula of LSE as shown in equation-5.
LSE = εs(1-FVC) + εv*FVC ………(5)
whereμ εs and εv are soil and vegetation emissivity values, respectively (Table 5) and FVC is Fractional Vegetation Cover
10
NDVI values are < 0.2; while it would be considered as full vegetation when the NDVI values are > 0.5 (Stathopoulou et al., 2007). The calculation as shown in equation-6.
�� =
� �� −� ��� ��−� �� ………(6)where: NDVIs is the NDVI of soil with value of 0.2; while NDVIv is the NDVI of vegetation with the maximum value of vegetation cover (more than 0.5). The mean of emissivity (ɛ) and difference of emissivity (Δε) are calculated using equation-7 and equation-8.
ε = (ε10+ε11)/2 ……….(7)
whereμ ε is mean emissivity; ε10 and ε11 is the emissivity of band 10 and 11
Δε = ε10-ε11 ………..(8)
where: Δε is difference of emissivity; ε10 and ε11 is the emissivity of band 10 and 11 Water Vapor
Water vapor (w) had been recognized as one factor that affecting the land surface temperature. Most atmospheric water vapor is concentrated in the lower atmosphere (Sobrino et al., 1991) especially in the first 3 km of the profile (appendix 2). Though the total water vapor content is different, the distributions of the ratio of water vapor content to the total in the atmospheric profiles are very similar. The standard distributions of the atmospheres or just their average for simplification can be used to develop a simple method to generate the required distribution of water vapor content at each layer of the atmosphere, from the measurement of total water vapor content in the atmosphere as shown in equation-9 (Qin et al., 2001):
w(z) = w Rw(z) ………(9)
where: w(z) is water vapor content at altitude z; Rw(z) is the ratio of water vapor content to the total in the standard atmospheric profiles.
11 Ground Measurement
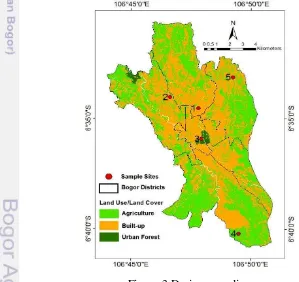
Land Surface Temperature (LST) is defined as the temperature of the interface between the earth’s surface and its atmosphere and thus it is a critical variable to understand land-atmosphere interactions and a key parameter in meteorological and hydrological studies, which involve energy fluxes (Niclòs et al., 2009). Land surface air temperature (LSAT) is the temperature of the air near the earth´s surface which is routinely measured at 1.5 to 2 m by common meteorological stations distributed across a territory. For validating the land surface temperature derived from the model in equation 1, the authors made ground measurements. Ground-based temperature measurements were taken in 13 days during March 2015 starting from 2nd March to 28th March. The measurement days were selected randomly, at the following specific date: 2nd, 4th, 7th, 9th, 11th, 14th, 16th, 18th, 21st, 23rd, 25th, 28th, and 30th. The temperature measurements were done between 12.00 – 14.00 pm local time, which is the closest time to the Landsat-8 image captured. A total of five thermometers at measurement points were mounted at 1.5 m height in an open space that protected from solar radiation. Each of the stations was also measured relative humidity at the same height and at the same time. Field visits was undertaken to collect the data actual of air temperature in the area under study based on the land use/land cover (LU/LC) data year 2011. The LU/LC was divided into three classes to make easier in defining the design samples. The design sampling was done by using a purposive sampling method (Nasir, 2005) where the location of the samples was determined at a specific location with consideration to represent the characteristics of the region such as built-up, urban forest, rice field, housing and manufactured area (Table 6). Camera and GPS are also used to precisely locate the ground sites investigated and location pictures. Design sampling was shown in Figure 3.
12
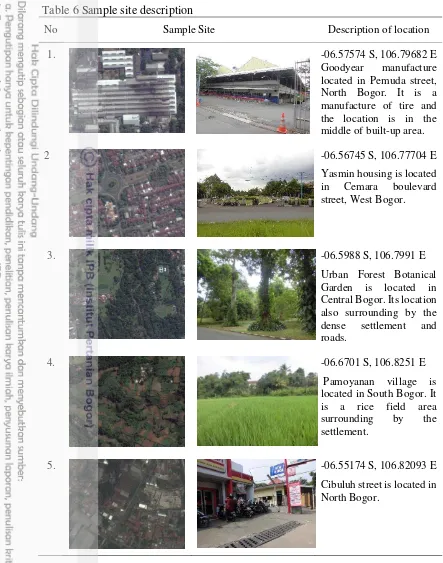
Table 6 Sample site description
No Sample Site Description of location
1. -06.57574 S, 106.79682 E
Goodyear manufacture
located in Pemuda street, North Bogor. It is a manufacture of tire and the location is in the middle of built-up area.
2 -06.56745 S, 106.77704 E
Yasmin housing is located
in Cemara boulevard
street, West Bogor.
3. -06.5988 S, 106.7991 E
Urban Forest Botanical Garden is located in Central Bogor. Its location also surrounding by the dense settlement and roads.
4. -06.6701 S, 106.8251 E
Pamoyanan village is located in South Bogor. It is a rice field area
surrounding by the
settlement.
5. -06.55174 S, 106.82093 E
Cibuluh street is located in North Bogor.
To know the consistency and the relationship between these ground-based
temperatures and the average of LSTs estimation, then the Pearson’s correlation
13 values of the samples (n). A good model has a value of less than 10%.
Ecological Factors
Spatial dynamics of the population is rooted in social and economic activities. Activities of the urban population represented by the increasing demand for built area. Built area in this case represented by the settlement, either for residential, industrial, and educational. Each of these activities result in spatial changes over time into a certain extent, this activity will eventually be limited by biophysical carrying capacity of the region. The city climate is influenced by the development of the city which cannot be separated from the physical development of the city, due to the population growth of the city; and increased human activity in the city; this is caused by the industry and life sustaining needs of the people. According to Tjasjono (1986), physical development and the increase of human activity in the city resulted in the higher city temperatures. Industrial development of the city will cause the layer of the atmosphere above becomes soiled by dust particles, smoke and others caused by the increasing number of motor vehicles and factories. Man-made structures such as roads and buildings typically have a lower albedo than the natural surface and absorb more visible radiation. This shows that the reduced of the vegetation and the increased in urban surface will cause heat island effect. This is also increasing the mass of the earth's surface that can store (and release) a lot more energy than the surface. Urban surfaces tend to heat faster than natural surfaces that hold water; the water will be released rapidly by urban surfaces in contrast with natural surfaces such as vegetation that can hold water. Anthropogenic heat source comes from the heating and ventilation systems, industrial processes, and internal combustion engines. In general, the consumption of energy will result heat.
Based on the analysis above, then variables in this study are variables which are suspected as the ecological factors that related to the surface temperature and represented by five factors (Table 7):
Table 7 Ecological factors
No Variables Method Data Source Unit
1. LST Split-window algorithm Landsat-8 TIRs bands 0C 2. Humidity Direct measurement from
certain location
Actual data %
3. Elevation Spatial analysis Aster Image m
4. Road density Spatial operation (buffering technique) of the existing road
Vector data km
14
The underlying assumption of the ecological factor was the relationship between the LST and the areal differentiation of the certain location. Simple linear regression was used to see the relationship between them. The variables used in this research were:
1. Humidity
This factor suspected with the assumption that the higher humidity then the lower LST. Relative humidity is the percent of water vapor, in the air, compared to what would be present if it were saturated. The data measurement of humidity was collected at the same time and using the same method with the air temperature. Relative humidity can be found on psychometric charts using the difference value of dry and wet bulb temperatures. Relative humidity is always expressed as a percentage, and a value of 100% means the air is saturated.
2. Elevation
This factor suspected with the assumption that the lower elevation, then the higher LST. Elevation significantly affects the surface temperature and relative humidity, temperature typically decreases with an increase in elevation. Therefore, daytime mixing of the atmosphere near the ground will yield a uniform amount of moisture, and the decrease in temperature will yield an increase in relative humidity. 3. Road density
The proximity factor to the road has led to the increasing of the temperature due to road surface temperature (RST) is the highest among land use/land cover (Chudnovsky et al., 2004). This factor suspected had a relationship that the closer to the road then the higher probability of temperature increasing. The assumption of coating or road pavement material of all road in studied area are the same. The road density analyzed by using the road buffer of 100 m distance.
4. Land cover
Land cover classification of Landsat-8 imagery was performed using the maximum likelihood classification (MLC) algorithm. The MLC has been the most popular parametric classifier used for remote sensing data classification (Foody et al., 1992; Jia et al., 2011). The MLC assumed that for a given unknown pixel, the probability of membership in each class is calculated using the mean feature vectors of the classes, the covariance matrix, and the prior probability. The unknown pixel is consider belong to the class with the maximum probability of membership. The classification process started with creating the training area of Landsat-8 bands composite (654). Evaluation of the training area that has been made for land classification is based on the value of separability. The separability measurement was done to obtain the quality classification accuracy. The method chose was Transformed Divergence (TD), because it is good in evaluating the separability of each land cover type. It also give the best estimation (Jaya, 1996). The value of TD for each land cover type was calculated by using the formula as shown in equation-9 and equation-10 (Swain dan Davis, 1978; Singh, 1984).
15 TDij = 2000 [1 −exp [−Dij / 8]] ……….(12) where: i and j is two class to compare; Ci is covariance matrix of class i; M is the
average of vector class i; tr is the matrix algebra; T is the transpose function; and TDij is the separation between class i and j.
The separability analysis was needed to exhibit the separability statistics of each land cover type based on the average digital number classified so that it can concluded whether it needs to clustered or not. The criteria of value TD in this research were (Mather et al., 1990; Jaya and Kobayashi, 1995; Jensen, 1996):
1. Inseparable: ≤ 1600 2. Poor: 1601 – 1699
3. Fair: 1700 – 1899
4. Good: 1900 – 1999, and
5. Excellent: 2000
The accuracy analysis of land cover classification was done by calculating the overall accuracy and kappa accuracy as shown in equation 13 and 14 (Jensen, 1996):
……… (13)
……….. (14) where: N is the number of all pixel (training area); r is the number of rows in error
matrices; Xkk is the number of pixel in the class (diagonal matrices); Xk+ is the number of all columns at rows-i; X+k is the number of all rows at column-j.
The accuracy was calculated using the overall accuracy equation and kappa accuracy equation. Kappa accuracy was used to takes into account all the element in the matrix contingency. Overall accuracy (producer accuracy and user accuracy) describe the truth, but not considering the possibility of similarity/agreement map related to the reference data. A field survey was done in order to improve and examine the sample unit by reviewing locations using GPS and camera for each point which is useful for the visual interpretation.
Spatial Modeling of Land Surface Temperature
16
One of the important part of the spatial modeling was to develop the standardized score value, ranged from 10 to 100 by using the rescaling score (Jaya, 2007). The formula for rescaling factor as shown in equation-15.
� �� . = .�. ax − − . �. � � � �� . �� − � �� . min + � �� . � ..(15) where:
ScoreR.out = Rescaling score
ScoreE.input = Input estimated score input ScoreE.max = Maximum estimated score ScoreE.min = Minimum estimated score ScoreR.max = Maximum score of rescaling ScoreR.min = Minimum score of rescaling
The weighted will be done to identify the influence of each variables to the LST. The weighting will be done quantitatively based on the calculation of the object’s relationship to LST. The weight calculated using regression based on the standardization score. The next step was to re-rescaling so that the weight equal to one (1).
3
RESULT AND DISCUSSION
Land Surface Temperature Distribution
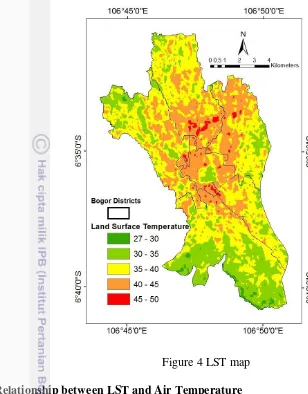
The input parameters to derive the LST of SW algorithm includes the brightness temperature of the two adjacent band of the TIRS, mean and difference of emissivity which is an FVC can be estimated from the red and near-infrared reflectance of the OLI bands, and water vapor content. LST output portrayed that it varied from 301 to 322 Kelvin and converted into Celsius by subtracting 273.15. The spatial distribution of LST within the study area is shown in Figure 4.
Across the entire study area, LST values increased from the outskirts towards the inner urban areas, which ranged from 270C to 500C, with a mean of 370C and a standard deviation of 3.670C. The rise of surface temperature will affect to the increasing of air temperature especially in the urban areas (e.g., Cheng et al., 2008). The LST pattern was found to be non-symmetrical but rather concentric, with high-temperature zones clustered towards the center of the study area. The areas with the lowest vegetation levels were corresponded to the land cover types of settlement/built-up area with the value of LST ranged from 400C to 500C. Conversely, high values of NDVI indicating the presence of green vegetation which mainly occurs, at the southern part of the study area.
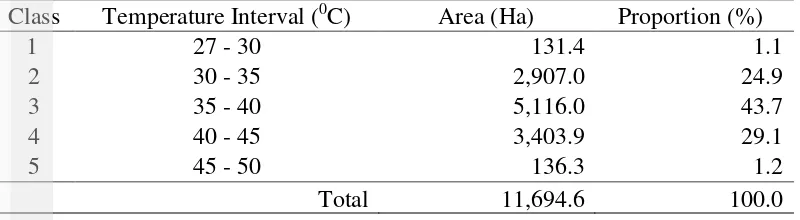
17 Table 8 LST proportion area
Class Temperature Interval (0C) Area (Ha) Proportion (%)
1 27 - 30 131.4 1.1
The highest LST of more than 450C is spread in the North and Center parts of Bogor with an area of 136.26 Ha such as Cibuluh, Kedung Badak, Kedung Jaya, Kebon Pedes, Menteng, Babakan Pasar, and Gudang Villages. The area with high LST is an area that dense with the settlements, roads, manufactures and business area. The smallest area of 131.4 Ha is varied from 270C to 300C was spread in the South part of Bogor such as Mulyaharja, Kertamaya, Rancamaya, and Bojong Kerta Villages and a little part area at Situ Gede Village of West Bogor was the area with high vegetated area/urban forest.
LST with the largest area of 5,116.05 Ha is varied from 350C to 400C was spread all over Bogor with proportion area of 43.7%. It has been largely demonstrated that cities with variable landscapes and climates can exhibit temperatures several degrees higher than their rural surroundings. LST and land cover values were computed to understand further how LST interact with land cover parameters. The LST and land cover values as shown in Table 9.
Table 9 Mean LST of land cover
18
Figure 4 LST map Relationship between LST and Air Temperature
The correlation between LSTs and air temperature in the canopy layer was generally high, due to the transfer of thermal energy emitted from the surface to the atmosphere (Nichol, 1994; Arrau and Pena, 2010). The air temperature has a positive correlation with the LST at a day-time of day 1 and day 11 where the air temperature normally fluctuate less than LST across a given area during the day (EPA, 2009). In general, the close relationship between LST and the air temperature has been shown to be valid (Mostovoy et al., 2006; Prihodko and Goward, 1997).
Pearson’s correlation coefficients analysis (r) shows moderately high association with the value of 0.78 with the significant correlation of > 0.01 (1%) and mean deviation of 2.7%. Some research also shows the significant relationship during night-time measurement (Unger et al., 2009; Li et al., 2008) and under cloudy conditions, where air temperature alone explained over 94% of the variance observed in LST for the stations included, because of the relatively homogeneous land surface characteristics encouraged in the immediate vicinity of the stations, and potential regional differences in surface features that might influence the observed relationships (Gallo et al., 2011).
19 range of 0.61 (Figure 5), this means that the variation of in situ temperature can be explained by the LST into 61%. In this case, the study area was limited only for Bogor Municipality, with the assumption that the ecological factor outside the study area was not considered.
Figure 5 Relationship between LST and air temperature
By all means, we should not forget that the obtained relationship is based on the data of only two days, however complex, measurement campaigns. In the future, when using data of more measurements on days with similar environmental conditions to that of the investigated days, the result could be refined. In the frame of this study, a data collection in different seasons could also be a new direction, which can provide a possibility to examine the specific seasonal features and enable their comparison.
Ecological Factors Relationship Analysis
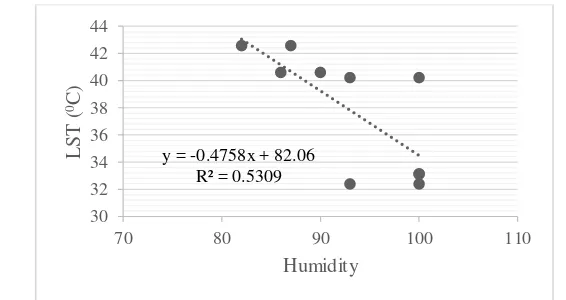
LST and Humidity Relationship Analysis
The result shows that the humidity has a correlation with the LST at a day time of date 2 and 25 (day 1 and day 11 of measurement) of March 2015. Pearson’s correlation coefficients analysis (r) shows moderately high association with value of 0.73 with the significant correlation of > 0.05 (5%). The value R2 obtained was 0.53, this means that the variation of in situ temperature can be explained by the LST into 53% (Figure 6).
20
LST and Elevation Relationship Analysis
The spatial distribution of Elevation within the study area is shown in Figure 7. A digital elevation model (DEM) of Aster image at 30-meter resolution were used to assess the altitude. The altitude represent the range from 124 into 518 meters above sea level (asl).
To identify the relationship between the LST and the elevation then sample site was taken in 100 different location, it was done randomly by using the spatial analysis process to all over the study location. Simple linear regression was used to quantify the relationship between LST and the independent variable of elevation. The result exhibit that in Bogor Municipality the elevation has a negative relationship with the LST by R2 = 0.9256. This means that the increasing of elevation will affected to the decreasing of LST into 92% (Figure 7).
Figure 7 Relationship between LST and elevation
The anomalous warm of the city creates relatively low air pressures that cause cooler, rural air to converge on the urban center, thus forcing warm air to ascend (i.e. convection), which at higher altitudes condensates and precipitates. LST and Road Density Relationship Analysis
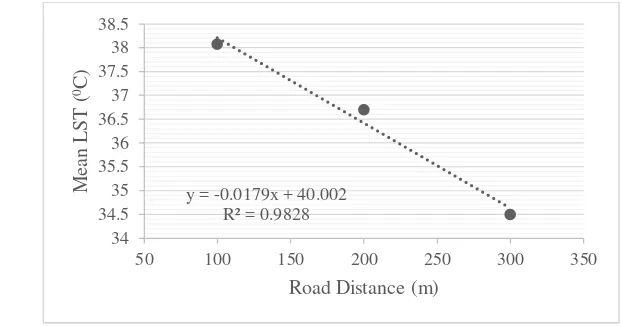
Roads in this study did not resulted the highest temperature, which is inconsistent with some other studies, where high thermal signature on roads were usually detected as a result of construction materials, heat emissions from combustion engines, and polluted air (Chudnovsky et al., 2004). The road density sampel was taken for 100 sample, equal based on the road distance class. The road distance based on the mean value of LST exhibited the significant pattern, the closest to the road then the higher temperature. This is shown by the mean highest value of surface temperature 380C on the first 100 m of distance (Figure 8). The temperature had degrading along with the increase of the distance, it has been described significantly into 300 m. It can be concluded that the road density had role in affecting the increasing of LST, the probability of increasing relevant with the addition of the distance.
100 150 200 250 300 350 400 450
21
Figure 8 Mean values of LST associated with road distance Land Cover Classification of OLI Data in Bogor Municipality
Land cover is the biophysical cover on the earth's surface that can be observed and a result of arrangements, activities and human treatment performed on certain types of land cover to carry out production activities, changes, or maintenance of the area (SNI 7645, 2010). In this study, to assess the land cover (LC) of Bogor Municipality, composite images of bands 654 were selected for analysis. Furthermore, maximum likelihood classifier (MLC) algorithm was applied on satellite images during the classification analysis. Based on the national scale of land cover, there are five classes for this area were identified as waterbody (including lakes and rivers), built-up area, urban forest, grass, and agriculture. The samples were randomly selected from known area using the region of interest (ROI) tools provided by Erdas Imagine 9.1 software. The analysis in this research commonly shows the good separability. The overall classification statistics of land cover has the separability of 1900 so that the training area can be used. The separability analysis shown in Table 10.
Table 10 Separability matrix of Landsat-8 supervised classification
No Land Cover Water Urban
The accuracy of the classification testing in this research concluded has a good accuracy, showed by the high value of overall accuracy and kappa accuracy. The number of pixel used to make the training area of classification Landsat-8 year
2014 was 14.003 with the average of producer’s accuracy and user’s accuracy was
98.5% and 96%. The classification accuracy and kappa statistics were estimated based on the validation samples and the confusion matrix is shown in the Table 11, respectively. The overall accuracy for the land cover classification showed the value of 99% and kappa coefficient 97%. The kappa coefficient means that 97% of the training area matrix were classified correctly.
22
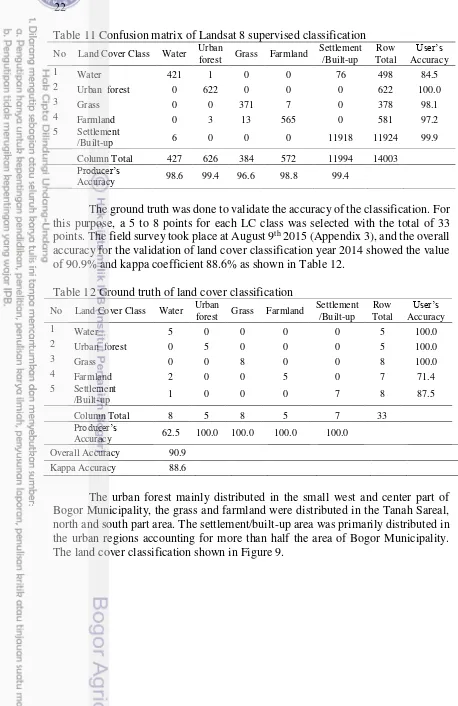
Table 11 Confusion matrix of Landsat 8 supervised classification
No Land Cover Class Water Urban
The ground truth was done to validate the accuracy of the classification. For this purpose, a 5 to 8 points for each LC class was selected with the total of 33 points. The field survey took place at August 9th 2015 (Appendix 3), and the overall accuracy for the validation of land cover classification year 2014 showed the value of 90.9% and kappa coefficient 88.6% as shown in Table 12.
Table 12 Ground truth of land cover classification
23
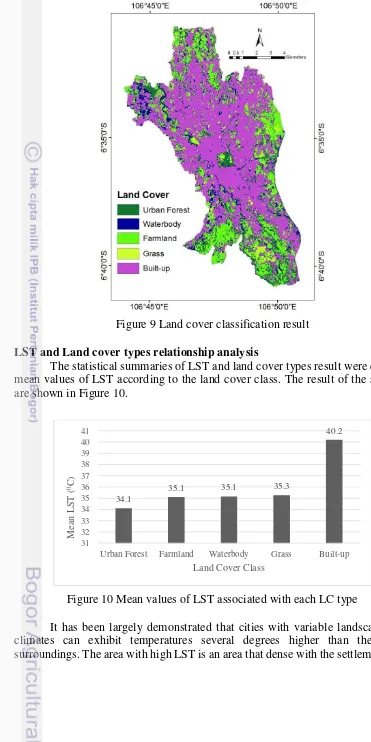
Figure 9 Land cover classification result LST and Land cover types relationship analysis
The statistical summaries of LST and land cover types result were depicted mean values of LST according to the land cover class. The result of the statistics are shown in Figure 10.
Figure 10 Mean values of LST associated with each LC type
It has been largely demonstrated that cities with variable landscapes and climates can exhibit temperatures several degrees higher than their rural surroundings. The area with high LST is an area that dense with the settlements and
34.1
35.1 35.1 35.3
40.2
31 32 33 34 35 36 37 38 39 40 41
Urban Forest Farmland Waterbody Grass Built-up
M
ea
n
L
S
T
(
0C)
24
roads (built-up). LST and land cover values were computed to understand further how LST interact with land cover parameters. The highest LST was found in built-up (40.20C), followed by grass (35.30C), waterbody (35.10C), farmland (35.10C), and the lowest temperature detected in urban forest (34.10C). This implies that urban development has brought up LST by replacing natural vegetation with non-evaporating and non-transpiring surface such as stone, metal, and concrete (Lo et al., 1997; Weng, 2001).
The urban forest has low temperature that is related to the area with open space and green vegetation (Weng and Yang, 2004), the temperature in urban forest was detected to be lower than the surrounding area of land cover types with average of 34.10C. Waterbody (river and lake) and farmland in Bogor Municipality seem to have the same value average of LST. (Wong et al., 2012; Oke, 1992) stated that within an urban region water features can have positive influence on the microclimate of the surrounding regions when the natural cooling coming from the evaporation will be required in the hot sunny days. The more chances of water availability generally improve evaporation, and the related lift of latent heat offers and extra daytime cooling influence. Water bodies work as the cooling source of the microclimate of surrounding region. The temperature of the air above and near waterbody is different from the temperature over the land because the water has a different system of cooling and heating. Waterbodies are believed to be the best radiation absorbers, but on the other hand, they provide a very small thermal response. The farmland in south part area of Bogor is still in highly vegetation cover.
Spatial Modeling of Land Surface Temperature
Based on the identification and the correlation analysis result of variables, there was 3 variables used. The land cover, road density, and elevation. The selected variables have the different unit so that it needs to make a standardization for scoring. Scoring was done according to the relationship of each variable with the LST based on its class, equally and mean values. In this analysis there was 5 class for land cover, 3 class for road distance, and 6 class for the elevation. The scoring as shown in Table 13, Table 14, and Table 15 was calculate according to the equation-15.
25 The road was divided into three classes based on its distance of 100, 200, and 300. The minimum mean value LST of 10 was given to the road with far distance and the maximum mean value LST of 100 was given to the road with near distance.
Table 14 Road distance scoring
Road Distance (m) Mean LST Score
300 34.49 10
200 36.70 65
100 38.07 100
Total Mean LST 36.42
Min 34.49 10
Max 38.07 100
The elevation was divided into six classes based on its altitude. The minimum mean value LST of 10 was given to the elevation with high altitude and the maximum mean value LST of 100 was given to the elevation with low altitude. Table 15 Elevation scoring
Elevation (m) Mean LST Score
150 39.67 100
200 41.03 96
250 39.54 85
300 36.52 67
350 35.12 42
400 33.44 10
Total Mean LST 37.55
Min 33.44 10
Max 41.03 100
Spatial model of LST obtain from the score standard of each selected variable then weighting. The weight available from the round-up mean value LST of each variable divided by the total mean value LST of all variable and multiply by 1. The weight for each variable as shown in Table 16.
Table 16 Weight for each variable
Variable Mean LST Weight
Land cover 36.0 0.33
Road distance 36.4 0.33
Elevation 37.6 0.34
26
Based on the weighting value of each variable, the spatial modeling obtained was:
Y = 0.33X1 + 0.33X2 + 0.34X3
where: Y was the LST suspected from the variables X1 as the land cover, X2 as road distance, and X3 as the elevation.
Elevation reach the highest score rather than land cover and road density, as Pepin and Losleben (2002) hypotheses indicate that the surface temperature is highly modified by the local terrain and it was decreased in LST at high altitude. A significant issue in the study of whether or not temperature trends depend on elevation is that of surface temperature trends. Atmospheric surface temperatures are those directly influenced by interaction with the land surface.
The spatial distribution of LST divided into 3 classes of low, middle, and high based on the equal interval of temperature (Figure 11). The result shows that the high value of LST was found in the northern part to the center part of Bogor Municipality reach into 69.7% (Table 17). The low value was found in the southern part of Bogor Municipality with small area only 4.8%.
Table 17 Spatial distribution of model LST
Temperature Interval (0C) Class Area (Ha) Proportion (%)
33 – 36 Low 567 4.8
36 – 38 Middle 2.970.8 25.4
38 – 41 High 8.156.8 69.7
Total 11.694.6 100
27 Model Validation
The validation was done to evaluate the LST model compare to the actual data of air temperature. Validation was done by using the confusion matrix to calculate the overall accuracy and the kappa accuracy (Table 18). The kappa accuracy generally result a less value than the overall accuracy because the kappa accuracy calculate the pixel value classified in the model was inappropriate with the reference class. The actual air temperature were classified into 3 classes based on equal interval and so is the air temperature based on model, as a reference for the validation.
Class 1 actual : 23 – 28 0C Class 1 model : 33 – 36 0C Class 2 actual : 28 – 33 0C Class 2 model : 36 – 38 0C Class 3 actual : 33 – 41 0C Class 3 model : 38 – 41 0C Table 18 Confusion matrix validation
Class CM1 CM2 CM3
CA1 2 1 0
CA2 0 1 3
CA3 0 0 3
Overall Accuracy 60.00 Kappa Accuracy 41.18
Based on the model validation result, the overall accuracy was 60% and the kappa accuracy was 41%.
4
CONCLUSION
LST in Bogor Municipality can be estimated from the thermal sensors of satellite data, validated using ground-based air temperature exhibit by r = 0.78 with significant correlation of 0.01 and mean absolute deviation (MAD) of 2.7. The study revealed that only 1.12% area under the temperature of 300C and other 98.89% of the total area are ranged from 31 to 490C. The land use change in Bogor Municipality from non-built area into built area has affected to the increasing of land surface temperature. The spatial modeling exhibit the model of:
Y = 0.33X1 + 0.33X2 + 0.34X3
Elevation reach the highest score was indicate that the surface temperature is highly modified by the local terrain and it was decreased in LST at high altitude with the model accuracy of 41%. This study found that within the Bogor Municipality, LST and the ecological factors shared a significant relationship,
28
REFERENCES
Akhoondzadeh M, Saradjian MR. 2008. Comparison of Land Surface Temperature Mapping Using Modis and Aster Images in Semi-Arid Area. Remote Sensing Division, Surveying and Geomatics Dept., Faculty of Engineering, University of Tehran, Tehran, Iran. The International Archives of the Photogrammetry, Remote Sensing and Spatial Information Sciences. Vol. XXXVII. Part B8. Beijing 2008
Arrau CP, Pena MA. 2010. The Urban Heat Island (UHI) Effect. Available online at: http://www.urbanheatislands.com (accessed 29 June 2015).
Arribas AC, Gallardo MA, Gaertner, Castro M. 2003, Sensitivity of the Iberian Peninsula climate to a land degradation, Clim. Dyn., 20, 477– 489.
[BPS] Badan Pusat Statistik of Bogor Municipality. 2013. Bogor in Figures 2013. Central Bureau of Statistics-Bogor Municipality.
Cheng KS, Su YF, Kuo FT, Hung WC, Chiang JL, 2008. Assessing the effect of land cover changes on air temperature using remote sensing images – a pilot study in northern Taiwan. Landscape Urban Plan. 86, 85–96.
Chudnovsky A, Ben-Dor E, Saaroni H. 2004. Diurnal thermal behavior of selected urban objects using remote sensing measurements, Energy and Buildings. 36:1063–1074.
Dash P. 2005. Land Surface Temperature and emissivity Retrieval from Satellite Measurement. Institute of Meteorology and Climate Research. Faculty of Physics. University of Karlsruhe.
[EPA]. Environmental Protection Agency. 2009. Reducing Urban Heat Islands: Compendium of Strategies–Urban Heat Island Basics. Available online at: http://www.epa.gov/heatisland/resources/pdf/BasicsCompendium.pdf (accessed 29 June 2015).
Fan H, Sailor DJ. 2005. Modeling the Impacts of Anthropogenic Heating on the Urban Climate of Philadelphia: A Comparison of Implementations in Two Pbl Schemes. Atmospheric Environment 39, 73–84.
Foody GM, Campbell NA, Trodd NM, Wood TF. 1992. Derivation and applications of probabilistic measures of class membership from the maximum-likelihood classification. Photogrammetric Engineering and Remote Sensing. 58: 1335–1341.
Fukui Y. 2003. A study on surface temperature patterns in the Tokyo metropolitan area using aster data. Geoscience Journal, 7, pp. 343-346.
Gallo K, Hale R, Tarpley D, Yu Y. 2011. Evaluation of the Relationship between Air and Land Surface Temperature under Clear- and Cloudy-Sky Conditions. Journal of Applied Meteorology and Climatology. 50: 767-775 Irwan ZD. 2008. Challenges of Environmental and Forest City Landscape. Jakarta:
Bumi Aksara. 179 pages.
Jaya I, Kobayashi S. 1995. Classification of detailed forest cover types based upon the separability algorithm: a case study in the Yahiko Mountain and Shibata Forest Area. Journal of the Remote Sensing Society of Japan. 15(1): 40-53. Jaya INS. 1996. Monitoring Forest Cover Change Using Multi temporal Landsat
29 Jaya INS. 2007. Digital Image Analysis: Remote Sensing Perspective for Natural Resource Management. Forest Management Department. Faculty of Forestry. Bogor Agricultural University.
Jensen JR. 1996. Introductory digital image processing: A remote sensing perspective. New Jersey Prentice Hall.
Jia K, Wu BF, Tian YC, Zeng Y, Li QZ. 2011. Vegetation classification method with biochemical composition estimated from remote sensing data. International Journal of Remote Sensing. 32: 9307–9325.
Jimenez-Munoz JC, Sobrino JA, Skokovic D, Mattar C, Cristobal J. 2014. Land surface temperature retrieval methods from Landsat-8 thermal infrared sensor data. IEEE Geosci. Remote Sens. Lett. 11, 1840–1843.
Li Z, Guo X, Dixon P, and He Y, 2008. Applicability of Land Surface Temperature (LST) estimates from AVHRR satellite image composites in northern Canada. Prairie Perspectives, Vol. 11, p 119.
Liang S, Li X, Wang J. 2012. Advanced Remote Sensing: Terrestrial Information Extraction and Applications; Elsevier Science: Amsterdam, the Netherlands. Lillesand TM, Kiefer FW. 1997. Remote Sensing and Image interpretation.
Yogyakarta. UGM Press.
Lo CP, Quattrochi D, Luvall J. 1997. Application of high resolution thermal infrared remote sensing and GIS to assess the urban heat island effect, International Journal of Remote Sensing, 18:287–304.
Mas’at A. 2008. Dampak pembangunan terhadap variasi iklim di wilayah DKI Jakarta. BMKG Bulletin vol. 4.
Mather P, Steven M, Clark J. 1990. Theoretical problems in image classification. Application of RS in Agriculture. 127-135.
Mostovoy GV, King RL, Reddy KR, Kakani VG, Filippova MG, 2006. Statistical estimation of daily maximum and minimum air temperatures from MODIS LST data over the state of Mississippi. GISci. Remote Sens. 43, 78–110. Nasir M, 2005. Metode Penelitian. Ghalia Indonesia Press. 544 pages.
Nerry F, Labed J, Stoll MP. 1988. Emissivity signature in the thermal IR band for remote sensing: calibration procedure and method of measurement. Appl. Opt. 27(4):758-764
Nichol JE. 1994. A GIS-Based Approach to Microclimate Monitoring in
Singapore’s High-Rise Housing Estates. Photogrammetric Engineering and Remote Sensing, 60, 1225-1232.
Niclòs, Valiente JA, Barberà MJR, Estrela MJ, Galve JM, Caselles V. 2009. Preliminary results on the retrieval of land surface temperature from MSG-SEVIRI data in Eastern Spain. Proceedings p.55, EUMETSAT Meteorological Satellite Conference, Bath, UK, 21-25 September 2009, 8 p. Oke TR. 1987. Boundary Layer Climates, 2nd ed., 435 pp., Routledge, London. Oke TR. 1992. Boundary layer climates: Psychology Press.
Pepin NC, Losleben ML. 2002. Climate change in the Colorado Rocky Mountain: Free air versus surface temperature trends. International Journal of Climatology, Vol. 22, 311–329.
Prihodko L, Goward SN, 1997. Estimation of air temperature from remotely sensed surface observations. Remote Sens. Environ. 60, 335–346.