Dengan Hormat,
Dengan mengucap Puji Syukur Kehadirat Tuhan
Yang Maha Esa, buku “Laporan Statistik
Asuransi Gempa Bumi Indonesia (LSAGBI)
Desember 2015” telah selesai disusun.
Penyusunan LSAGBI ini selaras dengan salah
satu Visi MAIPARK yaitu menjadi “Center Of
Excellence” dan sebagai upaya dalam
memberikan pelayanan yang terbaik bagi
Industri Asuransi Umum di Indonesia khususnya
mengenai statistik serta pengetahuan risiko
gempa bumi.
Sebagai salah satu publikasi rutin, LSAGBI ini
memuat hasil kajian risiko-risiko gempa bumi
terkait data
exposure
, premi nasional, jumlah
risiko dan perkembangan risiko gempa bumi. Di
dalam laporan ini kami juga menyajikan ulasan
aktuaria dan risiko
exposure
dari sudut pandang
asuransi gempa bumi
Dukungan dari seluruh perusahaan asuransi
umum sangat berarti bagi kami dalam upaya
pengembangan laporan statistik ini. Kami
menyadari kebutuhan penyempurnaan buku ini
sangat tinggi sehingga kritik maupun saran
sangat kami harapkan.
Akhir kata, semoga laporan ini dapat menjadi
referensi
yang
berkualitas
dan
dapat
memberikan manfaat tidak hanya bagi
perusahaan yang menangani asuransi gempa
bumi, namun juga bagi Industri Asuransi Umum
di Indonesia. Kami mohon maaf apabila masih
ditemukan kesalahan data dan informasi yang
disajikan dalam buku ini.
Dear Sir / Madam,
Our gratitude to God Almighty, the “Indonesian
Earthquake Insurance Statistic Report as at
December 2015” is ready to publish. This report
publication is aligned with MAIPA
RK’s vision,
which is to be a "Center of Excellence” and also
to provide the best service for the General
Insurance Industry in Indonesia, especially
statistic and earthquake risks knowledge.
As a regular publication, it contains earthquake
risks study related to the national Exposure,
premium, number of risks and development of
the earthquake risks management. We also
include actuarial and Exposure risks reviews
from earthquake insurance point of view.
Support from the General Insurance Industry
will be meaningful to us in order to improve this
Statistic Report. We realize the need for
improvement of this report is very high so that
critics and suggestions are appreciate.
Finally, we hope that this report could be used
as a qualified reference and will be beneficial for
all general insurance industries in Indonesia.
We apologize for any possible data and
information errorspresented in this report.
Hormat Kami,
Sincerely,
Satu Dekade Pengelolaan Database Nasional
Asuransi Gempa Bumi Dalam Mendukung
Kemajuan Industri Asuransi
͞
A Decade of National Database Management of
Earthquake Insurance to Support The Insurance
Hal.
Page
Kata pengantar………
...
……i
Daftar Isi
……….iii
Content……
..
………
.i
Foreword………..iii
A.
Umum
………
1
B.
Struktur Pasar
……….2
C.
Premi Bruto dan
Exposure
……….2
D.
Jumlah Risiko
………..4
E.
Incurred Claim
………...
..
7
F.
Analisis
Exposure: Probable Maximum
Loss
(PML) Industri Asuransi Nasional -
Kualitas Data Menentukan Kualitas
Manajemen Risiko
…..
………
...
…1
3
G.
Ulasan
Aktuaria:
Truncation
dan
Modifikasi pada Nilai Nol………..
21
H.
Ulasan Asuransi: Penetrasi Asuransi
Gempabumi Indonesia - Peranan Industri
Asuransi
Melindungi
Area
Rawan
Gempa………
....29
A.
General
………...1
B.
Market Structure
………2
C.
Gross Premium and Exposure
………2
D.
Number of Risk
………..4
E.
Incurred Claim
………7
F.
Exposure Analysis: Probable Maximum Loss
(PML) of National Insurance Industry - The
data quality determines the risk management
quality
………
13
G.
Actuary
Commentary:
Truncation
and
Modification at Zero
………
...21
H.
Insurance Commentary: The penetration of
Earthquake insurance in Indonesia - The Role
of Insurance Industry in protecting the
Earthquake Prone Areas
………
29
Distribusi
Exposure
Gempa Bumi Indonesia
per Provinsi,
Underwriting Year
2015, per 31
Desember 2015
………
34
Distribusi Gempa Bumi Indonesia M > 5 dan
Claim Incurred
2015
………35
Distribusi
Exposure
Gempa Bumi Indonesia
per Provinsi,
Underwriting Year
2015, per 31
Desember 2015, Distribusi Gempa Bumi
Indonesia M > 5 dan
Claim
Incurred
UY
2015
………...
.36
Indonesian Earthquake Exposure Distribution by
Province, Underwriting Year 2015, as at 31
December 2015
……….
34
Indonesian Earthquake Distribution M > 5 and
Claim Incurred 2015 ………...
35
Indonesian Earthquake Exposure Distribution by
Province, Underwriting Year 2015, per 31
December
2015,
Indonesian
Earthquake
Distribution M > 5 and Claim Incurred UY 2015
………...…
36
Iktisar Statistik Asuransi Gempa Bumi
Indonesia Desember 2015
Statistic
Overview
of
Indonesian
Earthquake Insurance December 2015
Exposure Asuransi Gempa Bumi
Indonesia
Indonesian Earthquake Insurance
Exposure
Peta
Map
Tabel 2.1.
Exposure
Per Cresta Zone
……..3
7
Tabel 2.2.
Exposure
Per Okupasi
………...39
Tabel 2.3.
Exposure
Per
Interest
………...41
Tabel 2.4.
Exposure
Per Provinsi
………
43
Tabel 2.5.
Exposure
Per Kelas Konstruksi...44
Table 2.1. Exposure By Cresta Zone ... 37
Table 2.2. Exposure By Occupation ... 39
Table 2.3. Exposure By Interest ... 41
Table 2.4. Exposure By Province
…………
...43
Table 2.5. Exposure By Class of Construction..44
Tabel 3.1. Premi Bruto Per Cresta Zone
……
.46
Tabel 3.2. Premi Bruto Per Okupasi
…………
48
Tabel 3.3. Premi Bruto Per
Interest
………...
50
Tabel
3.4.
Premi
Bruto
Per
Provinsi
………...
...
…
52
Tabel 3.5. Premi Bruto Per Kelas Konstruksi
... 53
Table 3.1. Gross Premium by Cresta Zone
……4
6
Table 3.2. Gross Premium by Occupation...48
Table 3.3. Gross Premium by Interest...50
Table 3.4. Gross Premium by Province
……..…
52
Table 3.5. Gross Premium by Class of
Construction
………
53
Tabel 4.1. Jumlah Risiko Per Cresta
Zone
.. 55
Tabel 4.2. Jumlah Risiko Per Okupasi ... 57
Table 4.3. Jumlah Risiko Per Kelas Konstruksi
... 59
Table 4.4. Jumlah Risiko Per Provinsi...
...…61
Table 4.1. Number of Risk By Cresta Zone ... 55
Table 4.2. Number of Risk By Occupation ... 57
Table 4.3. Number of Risk By Construction Class
………
...59
Table 4.4. Number of Risk By Province ...
….
61
Tabel 5.1. Frekuensi Klaim Per Cresta Zone.62
Tabel 5.2. Frekuensi Klaim Per Okupasi
……
64
Tabel 5.3. Frekuensi Klaim Per Provinsi
……66
Tabel 5.4. Klaim Per Cresta Zone
………
67
Tabel 5.5. Klaim Per Okupasi
………..69
Tabel 5.6. Klaim Per Provinsi
………..
71
Table 5.1. Claim Frequency By Cresta Zone
…..6
2
Table 5.2. Claim Frequency By Occupation
……6
4
Table 5.3. Claim Frequency By Province
………
66
Table 5.4. Claim By Cresta Zone
……….
67
Table 5.5. Claim By Occupation
………...
69
Table 5.6. Claim By Province
………..
71
Underwriting Year
2011 - 2015, Seluruh
Okupasi
……….7
2
Underwriting
Year
2011
-
2015,
All
Occupation……….
.72
Premi Bruto Asuransi Gempa Bumi
Indonesia
Indonesian Earthquake Insurance Gross
premium
Jumlah Risiko Asuransi Gempa Bumi
Indonesia
Indonesian Earthquake Insurance Number
of Risk
Klaim Asuransi Gempa Bumi
Indonesia
Indonesian Earthquake Insurance Claim
Underwriting Year
2014, Seluruh Okupasi
…74
Underwriting Year
2013, Seluruh Okupasi
…75
Underwriting Year
2012, Seluruh Okupasi
…76
Underwriting Year
2011, Seluruh Okupasi
…77
Underwriting Year 2014, All Occupation
……….74
Underwriting Year 2013, All Occupation
……….75
Underwriting Year 2012, All Occupation
………76
Underwriting Year 2011, All Occupation
……….77
Okupasi Agrikultural
……….
78
Okupasi Komersial
………..
79
Okupasi Industrial
………
80
Okupasi Residensial
………
81
Occupation Agricultural
……….
78
Occupation Commercial
………...
79
Occupation Industrial
………
80
Occupation Residential
……….
81
Okupasi Agrikultural
……….
82
Okupasi Komersial
………..
83
Okupasi Industrial
………
84
Okupasi Residensial
………
85
Occupation Agricultural
……….
82
Occupation Commercial
………...
83
Occupation Industrial
………
84
Occupation Residential
……….
85
Okupasi Agrikultural
……….
86
Okupasi Komersial
………..
87
Okupasi Industrial
………88
Okupasi Residensial
………89
Occupation Agricultural
……….
86
Occupation Commercial
………...
87
Occupation Industrial
………88
Occupation Residential
……….89
Okupasi Agrikultural
……….90
Okupasi Komersial
………..91
Okupasi Industrial
………92
Okupasi Residensial
……….………..93
Occupation Agricultural
……….90
Occupation Commercial
………...91
Occupation Industrial
………9
2
Occupation Residential
………93
Profil Risiko dan Klaim Underwriting
Year Per Okupasi 2015
Risk and Profile Claim Underwriting Year
2015 By Occupation
Profil Risiko dan Klaim Underwriting
Year Per Okupasi 2014
Risk and Profile Claim Underwriting Year
2014 By Occupation
Profil Risiko dan Klaim Underwriting
Year Per Okupasi 2013
Risk and Profile Claim Underwriting Year
2013 By Occupation
Profil Risiko dan Klaim Underwriting
Year Per Okupasi 2012
Risk and Profile Claim Underwriting Year
2012 By Occupation
Profil Risiko dan Klaim Underwriting
Year Per Okupasi 2011
Okupasi Agrikultural
……….9
4
Okupasi Komersial
………...
...95
Okupasi Industrial
……….96
Okupasi Residensial..
………...
..97
Occupation Agricultural
……….9
4
Occupation Commercial
………
...95
Occupation Industrial
………9
6
Occupation Residential
……….97
Exposure
, Premi Bruto, Jumlah Risiko & Klaim
per
Cresta
Zone,
Underwriting
Year
2015
………98
Exposure
, Premi Bruto, Jumlah Risiko & Klaim
per
Cresta
Zone,
Underwriting
Year
2014
………99
Exposure
, Premi Bruto, Jumlah Risiko & Klaim
per
Cresta
Zone,
Underwriting
Year
2013
………
..100
Exposure
, Premi Bruto, Jumlah Risiko &
Klaim per Cresta Zone,
Underwriting Year
2012
………
..101
Exposure
, Premi Bruto, Jumlah Risiko &
Klaim per Cresta Zone,
Underwriting Year
2011
………..
102
Exposure, Gross Premium, Number of Risk &
Claim by Cresta Zone, Underwriting Year
2012………101
Exposure, Gross Premium, Number of Risk &
Claim by Cresta Zone, Underwriting Year
2011………10
2
Exposure
, Premi Bruto, Jumlah Risiko & Klaim
per
Okupasi,
Underwriting
Year
2015………..10
3
Exposure
, Premi Bruto, Jumlah Risiko & Klaim
per
Okupasi,
Underwriting
Year
2014………..10
4
Exposure
, Premi Bruto, Jumlah Risiko & Klaim
per
Okupasi,
Underwriting
Year
2013………..10
5
Exposure
, Premi Bruto, Jumlah Risiko &
Klaim per Okupasi,
Underwriting Year
2012………
..106
Exposure, Gross Premium, Number of Risk &
Claim by Occupation, Underwriting Year
2015………10
3
Exposure, Gross Premium, Number of Risk &
Claim by Occupation, Underwriting Year
2014………104
Exposure, Gross Premium, Number of Risk &
Claim by Occupation, Underwriting Year
2013………105
Exposure, Gross Premium, Number of Risk &
Claim by Occupation, Underwriting Year
2012………106
Exposure, Premi Bruto, Jumlah Risko
dan Klaim Asuransi Gempa Bumi
Indonesia Per Cresta Zone
Indonesian Earthquake Insurance
Exposure, Gross Premium, Number of Risk
and Claim By Cresta Zone
Exposure, Premi Bruto, Jumlah Risko
dan Klaim Asuransi Gempa Bumi
Indonesia Per Okupasi
Indonesian Earthquake Insurance
Exposure
, Premi Bruto, Jumlah Risiko &
Klaim per Okupasi,
Underwriting Year
2011………..10
7
Exposure, Gross Premium, Number of Risk &
Claim by Occupation, Underwriting Year
2011………10
7
Exposure
, Premi Bruto, Jumlah Risiko & Klaim
per Provinsi,
Underwriting Year
2015
…….. 10
8
Exposure
, Premi Bruto, Jumlah Risiko & Klaim
per Provinsi,
Underwriting Year
2014
……...
109
Exposure
, Premi Bruto, Jumlah Risiko & Klaim
per Provinsi,
Underwriting Year
2013
……...
110
Exposure
, Premi Bruto, Jumlah Risiko & Klaim
per Provinsi,
Underwriting Year
201
2………
111
Exposure
, Premi Bruto, Jumlah Risiko & Klaim
per Provinsi,
Underwriting Year
201
1………112
Exposure, Premi Bruto, Jumlah Risiko & Klaim
per
Provinsi,
Underwriting
Year
2015………..
108
Exposure, Premi Bruto, Jumlah Risiko & Klaim
per Provinsi, Underwriting Year
2014………...10
9
Exposure, Premi Bruto, Jumlah Risiko & Klaim
per Provinsi, Underwriting Year
2013………...
110
Exposure, Premi Bruto, Jumlah Risiko & Klaim
per Provinsi, Underwriting Year
2012………
..111
Exposure, Premi Bruto, Jumlah Risiko & Klaim
per Provinsi, Underwriting Year
2011………..
112
Lampiran
1.
Daftar Istilah…….………
113
2.Tarif
asuransi
Gempa
Bumi
Indonesia
…….……….………...
...115
3. Zona Asu
ransi Gempa Bumi Indonesia………116
4. Cr
esta Zone Indonesia………129
5.
Skala
First Loss
………
136
6. Tabel
Short Periode
kurang dari 1
tahun
…..………
..
………
..137
7. Skala
Indemnity Period
………
...138
Attachment
1.
Glossaries………..…..11
3
2.
Indonesian
Earthquake
Insurance
Tariff………..11
5
3.
Cresta Zone and Zone Table………116
4. Indonesia Cresta Zone ……….129
5.
First Loss Scale …..………
136
6. Short Period Table Less Than One Year
Period………137
7
. Indemnity Period Scale………..…
138
Referensi
Reference
1. Otoritas Jasa Keuangan (OJK).
2. Badan Pusat Statistik (BPS).
1. Financial Service Authority (OJK).
2. Central of Statistic Bureau (BPS).
Exposure, Premi Bruto, Jumlah Risko
dan Klaim Asuransi Gempa Bumi
Indonesia Per Provinsi
*)
Laporan Statistik ini dapat diperoleh di website
PT Reasuransi MAIPARK Indonesia
www.maipark.com
*)
S
tatistic report is available on
Ikhtisar Statistik Asuransi Gempa Bumi Indonesia Desember 2015
S
tatistic Overview of Indonesia Earthquake Insurance December 2015
A. Umum
A. General
Berdasarkan
data
Badan
Pusat
Statistik, Perekonomian Indonesia pada tahun
2015 sebagaimana diukur dari Produk Domestik
Bruto
(PDB),
tumbuh
sebesar
4,79%
dibandingkan tahun 2014. Nilai PDB Indonesia
atas dasar harga konstan 2010 pada tahun 2015
mencapai Rp8.976,9 triliun sedangkan pada
tahun 2014 sebesar Rp8.566,3 triliun. Bila dilihat
berdasarkan harga berlaku, PDB tahun 2015
adalah sebesar Rp11.540,8 triliun sedangkan
tahun 2014 adalah Rp10.565,8 triliun.
Based on Central of Statistics Bureau
Data, Indonesian economic in 2015 as
measured by Gross Domestic Product (GDP)
increased by 4.79 % compared to 2014. GDP
based on Constant Price 2010 in 2015 reached
the amount of
Rp
8,976.9 trillion while in 2014
was
Rp
8,566.3 trillion. If it is based on Current
Market Price, GDP in 2015 was
Rp
11,540.9
trillion while in 2014 was
Rp
10,565.8 trillion.
Sampai dengan kuartal ke empat tahun
2015, sesuai data Asosiasi Asuransi Umum
Indonesia (AAUI), pencapaian Premi Brutto
untuk seluruh lini usaha Asuransi Umum adalah
sebesar Rp58.888,28 miliar. Sedangkan Premi
Brutto khusus untuk Lini Usaha Harta Benda
mencapai Rp17.673,93 miliar. Pertumbuhan
Premi Brutto lini usaha Harta Benda kuartal ke
tiga tahun 2015 dibandingkan dengan kuartal
ketiga tahun 2014 adalah sebesar 6,7%,
sedangkan pertumbuhan klaimnya sebesar
22,2%.
Until fourth quarter of 2015, according
to the General Insurance Indonesia Asociation
(AAUI) data, General Insurance gross premium
achievement for all business line was
Rp
58,888.28 billion. Whereas gross premium
especially for property business line was
Rp17,673.93 billion. The Gross Premium
growth for property business line in third quarter
2015 to third quarter 2014 was 6.7%, whereas
the claims growth by 22.2%.
Sesuai Surat Edaran Otoritas Jasa
Keuangan (OJK) Nomor 21/SEOJK.05/2015,
tanggal 30 Juni 2015, menetapkan zona dan tarif
asuransi gempa bumi Indonesia, revisi dari
regulasi
sebelumnya
(SE
OJK
No.
06/D.05/2013, tanggal 31 Desember 2013).
In accordance to Financial Services
Authority
(OJK)
Circular
Letter
No
21/SEOJK.05/2015, 30 June 2015, there are
some changes in earthquake rate zone for
regency related to the previous circular letter
Pada SE OJK 2015 (terbaru), sebanyak
134 Daerah Tingkat II (Kota/Kabupaten)
mengalami peningkatan risiko dan berpindah
naik ke level zona di atasnya dibandingkan
dengan SE OJK 2013. Sedangkan 104 Daerah
Tingkat II lainnya mengalami penurunan.
Sedangkan tarif mengalami penurunan pada
Zona I
–
IV dalam kisaran 4%-21% sedangkan
tarif pada Zona V tidak ada perubahan
(Lampiran xx).
According to SE OJK on 2015 (the latest),
134 regency (City/District) have increased the
risk and shifts the level up compared to the
previous zone in the SE OJK 2013. While other
104 regency have change the rate zone (drop).
Premium rate have drops in the range 4%-21%
for Zona I-IV while constant or no change in
zona V.
Selama tahun 2015, OJK telah
menerbitkan regulasi terkait Gempa Bumi yaitu:
Surat Edaran Otoritas Jasa Keuangan Nomor
21/SEOJK.05/2015, tentang
Penetapan Tarif
Premi Atau Kontribusi Pada Lini Usaha
Asuransi Harta Benda Dan Asuransi
Kendaraan Bermotor Tahun 2015, tanggal 30
Juni 2015.
During 2015, OJK has issued
regulations related to Earthquake i.e.: Financial
Service Authority Service Circular Letter No
21/SEOJK.05/2015, about
Premium tarrif
arrangement or Property lines of business
contribution and Motor Vehicle Insurance
2015
, date June 30 2015.
B. Struktur Pasar
B. Market Structure
Berdasarkan data OJK pada buku Direktori
2015: Industri Keuangan Non Bank, terdapat 76
perusahaan asuransi umum, 6 perusahaan
reasuransi, 2 asuransi sosial, dan 3 perusahaan
asuransi wajib yang memiliki izin beroperasi di
Indonesia.
Based on OJK data in the book of
Directory 2015: Non Bank Financial Institution,
there are 76 general insurance companies, 6
reinsurance companies, 2 social insurance
companies, and 3 mandatory insurance
companies having operating licenses in
Indonesia.
C. Premi Bruto
C. Gross Premium
Sampai dengan 31 Desember 2015,
premi bruto asuransi gempa bumi
Underwriting
Year
2011 adalah sebesar Rp2.823,4 miliar.
Premi bruto untuk
Underwriting Year
2012
As at 30 June 2015, earthquake gross
premium for Underwriting Year 2011 was
Rp
2,823.4
billion.
Gross
premium
for
tercatat Rp2.719,6 miliar, sedangkan untuk
Underwriting Year
2013 adalah Rp4.530,3 miliar.
Untuk
Underwriting Year
2014 dan 2015 adalah
Rp5.004,5 miliar dan Rp2.634,9 miliar. Angka
–
angka ini akan terus bergerak naik terutama
untuk
Underwriting Year
2014 dan 2015.
Rp
2,719.6 billion, while for Underwriting Year
2013 was
Rp
4,530.3 billion. For Underwriting
Year 2014 and 2015 were
Rp
5,004.5 billion and
Rp
2,634.9 billion. These figures would certainly
increase especially for Underwriting Year 2014
and 2015
.
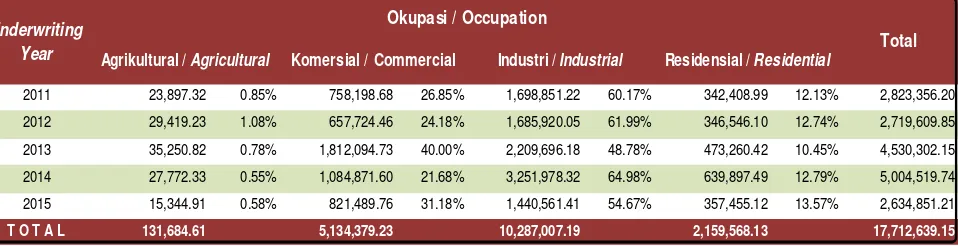
Tabel 1.1 menyajikan rincian premi bruto
berdasarkan jenis okupasi dari
Underwriting
Year
2011 hingga
Underwriting Year
2015.
Prosentase okupasi Industrial selalu berada
pada posisi pendapatan tertinggi dibanding 3
(tiga) okupasi lainnya (Agrikultural, Komersial,
Residensial), yaitu di atas 48% dari total premi.
The table 1.1 shows the details of gross
premium
based
on
occupation
from
Underwriting Year 2011 to Underwriting Year
2015. Industrial occupation always has the
biggest percentage income compared to 3
(three) remaining occupations (Agricultural,
Commercial, Residential), that is above 48 %
from premium total.
Meskipun okupasi Komersial, Residensial
dan Agrikultural tidak memberikan kontribusi
premi sebesar okupasi Industrial, namun ketiga
okupasi tersebut memperlihatkan pertumbuhan
premi yang cukup signifikan. Hal ini terlihat
terutama pada premi okupasi Residensial pada
Underwriting Year
2014 yang meningkat
sebesar 35,21% dari Rp473.260,42 juta di
Underwriting Year 2013
menjadi Rp639.897,49
juta. Faktor yang paling mempengaruhi angka
tersebut adalah kenaikan yang signifikan di
Provinsi Jawa Tengah dan Jawa Timur,
terutama Kabupaten Semarang dan Kota
Surabaya.
Kenaikan ini di duga diakibatkan oleh
peletusan Gunung Kelud pada 13 Februari 2014
di daerah Jawa Timur dimana abu hasil
peletusan menyebar hingga ke Kota/ Kabupaten
di Jawa Tengah dan Jawa Timur (Ulasan
Although occupation of Commercial,
Residential and Agricultural do not contribute
premium as much as Industrial occupation,
those three occupation show significant
premium growth. In this case, the premium
under Residential occupation in Underwriting
Year 2014 increased by 35.21% from
Rp
473,260.42 million in Underwriting Year 2013
to
Rp
639,897.49 million. The most affected
factor to number of risks is due to the significant
increasing in the Central Java and East Java
province, especially in Disctrict of Semarang
and City of Surabaya.
This increase was suspected due to Kelud
eruption at 13 February 2014 in East Java
Province area where the volcanic ash spread to
city/district in Central Java and East Java.
Asuransi: Penetrasi Asuransi Gempabumi
Indonesia - Peranan Industri Asuransi
Melindungi Area Rawan Gempa).
Earthquake insurance in Indonesia - The Role
of Insurance Industry in protecting the
Earthquake Prone Areas)
D. Jumlah Risiko
D
.
Number of Risk
Tabel 1.2 menyajikan jumlah risiko pada
Underwriting Year
2011 hingga
Underwriting
Year
2015 yang tercatat sampai dengan 31
Desember 2015.
Table 1.2 shows the number of risks from
Underwriting Year 2011 to Underwriting Year
2015 recorded until 31 December 2015
.
Dalam Jutaan Rupiah
In Million Rupiah
2011
23,897.32
0.85%
758,198.68
26.85%
1,698,851.22
60.17%
342,408.99
12.13%
2,823,356.20
2012
29,419.23
1.08%
657,724.46
24.18%
1,685,920.05
61.99%
346,546.10
12.74%
2,719,609.85
2013
35,250.82
0.78%
1,812,094.73
40.00%
2,209,696.18
48.78%
473,260.42
10.45%
4,530,302.15
2014
27,772.33
0.55%
1,084,871.60
21.68%
3,251,978.32
64.98%
639,897.49
12.79%
5,004,519.74
2015
15,344.91
0.58%
821,489.76
31.18%
1,440,561.41
54.67%
357,455.12
13.57%
2,634,851.21
T O T A L
131,684.61
5,134,379.23
10,287,007.19
2,159,568.13
17,712,639.15
Tabel 1.1 Premi Bruto dan Rasio Berdasarkan Okupasi per 31 Desember 2015
Table 1.1 Gross Premium and Ratio By Occupation as at 31 December 2015
Underwriting
Year
Okupasi / Occupation
Total
Agrikultural /
Agricultural
Komersial / Commercial
Industri /
Industrial
Residensial /
Residential
Tabel 1.2 Jumlah Risiko Berdasarkan Okupasi per 31 Desember 2015
Table 1.2 Number of Risk By Occupation as at 31 December 2015
Jumlah /
Total
%
Jumlah /
Total
%
Jumlah /
Total
%
Jumlah /
Total
%
Jumlah /
Total
%
Agricultural /
Agricultural
A
379
0.23
420
0.24
535
0.28
487
0.22
172
0.12
Komersial /
Commercial
C
91,426
55.10
94,471
54.52
100,579
53.17
116,563
51.89
70,863
49.12
Industrial /
Industrial
I
14,997
9.04
17,184
9.92
18,427
9.74
18,513
8.24
11,185
7.75
Residensial /
Residential
R
59,138
35.64
61,199
35.32
69,631
36.81
89,058
39.65
62,040
43.01
165,940
100.00
173,274
100.00
189,172
100.00
224,621
100.00
144,260
100.00
Occupation
Jumlah /
Total
Jumlah risiko terbesar untuk setiap
oleh okupasi Residensial dengan rasio di atas
35%.
The highest number of risks for each
Underwriting Year, in this case from Underwriting
Year 2011 to Underwriting Year 2015, is under
Commercial occupation, which is always on the
ratio above 49% from the total risk. Then, it is
followed by Residential occupation with ratio
above 35%.
Jika terdapat asosiasi antara kontribusi
premi dengan banyaknya risiko maka belum
tentu asosiasi tersebut berbentuk linear dan
positif. Hal ini dibuktikan dengan apabila
If there is any association between the
premium contribution and the number of risks then
the association is not necessarily linear nor
positive. This is proved which the highest gross
Number of Risk By Occupation
As at 31 Dec 2015
UY 2011 UY 2012 UY 2013 UY 2014 UY 2015
Agricultural
UY 2011 UY 2012 UY 2013 UY 2014 UY 2015
Commercial
UY 2011 UY 2012 UY 2013 UY 2014 UY 2015
Industrial
UY 2011 UY 2012 UY 2013 UY 2014 UY 2015
melihat dari premi bruto tertinggi berada di
okupasi industrial sedangkan banyak risiko
tertinggi berada pada okupasi komersial.
premium is on the industrial occupation while the
highest total risk is under commercial occupation.
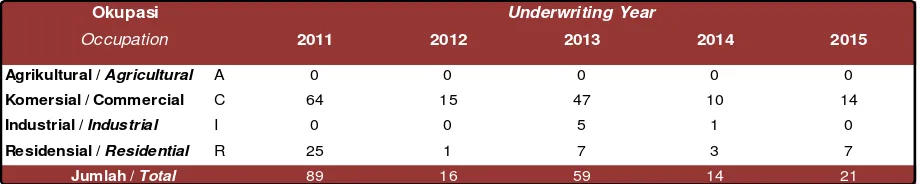
Berdasarkan data okupasi, okupasi
Komersial terdiri dari beberapa kode okupasi.
Jumlah risiko terbesar berdasarkan kode
okupasi di
Underwriting Year
2011
–
2015
adalah sebagai berikut:
Based on occupation data, Commercial
occupation consist of several occupation codes.
The highest number of risks by occupation code
in Underwriting Year 2011
–
2015 are as follows:
Okupasi Residensial terdiri dari beberapa
kode okupasi. Jumlah risiko terbesar
berdasarkan kode okupasi di
Underwriting
Year
2011
–
2015 adalah sebagai berikut:
Residential occupation consist of several
occupation codes. The highest number of risks by
occupation code in Underwriting Year 2011
–
2015 are as follows:
Jumlah Risiko Terbesar pada Okupasi Komersial Berdasarkan Kode Okupasi per 31 Desember 2015
The Highest Number Of Risk in Commercial Occupation as at 31 December 2015 by Occupation Code
U/Y 2011
U/Y 2012
U/Y 2013
U/Y 2014
U/Y 2015
Jumlah /
Total
Jumlah /
Total
Jumlah /
Total
Jumlah /
Total
Jumlah /
Total
Shops
2934
0
0
0
27,917
16,792
Shops - Subject to Waranty A
29341
22,158
22,998
15,976
0
0
Private Warehouses and
Storehouses - Subject to
Warranty A
29371
12,800
13,061
14,346
0
0
Veem and Bonded Warehouses -
Subject to Warranty A
293941
1
2
3
0
0
34,959
36,061
30,325
27,917
16,792
Deskripsi & Kode Okupasi
Description & Occupation Code
Jumlah /
Total
Jumlah Risiko Terbesar pada Okupasi Residensial Berdasarkan Kode Okupasi per 31 Desember 2015
The Highest Number Of Risk in Residential Occupation as at 31 December 2015 by Occupation Code
U/Y 2011
U/Y 2012
U/Y 2013
U/Y 2014
U/Y 2015
Jumlah /
Total
Jumlah /
Total
Jumlah /
Total
Jumlah /
Total
Jumlah /
Total
Dwelling Houses, not classified
as Shop-Houses (Ruko), not
exceeding 3 storeys.
2976
35,956
35,388
34,149
48,291
37,268
35,956
35,388
34,149
48,291
37,268
Jumlah /
Total
Deskripsi & Kode Okupasi
E.
Incurred Claim
E. Incurred Claim
Berdasarkan tabel 1.3, frekuensi klaim
gempa bumi paling banyak terjadi di
Underwriting Year
2011 yaitu sebanyak 89
klaim dan didominasi okupasi Komersial
sebanyak 64 klaim. Hal ini disebabkan oleh
kejadian gempa bumi di 2011 yaitu Gempa
Bumi Nusa Dua pada tanggal 13 Oktober 2011
dengan kekuatan 6,8 S.R dan Gempa Bumi
Sibolga pada tanggal 6 November 2011
dengan kekuatan 6,7 S.R.
Based on table 1.3, the highest earthquake
claim frequency occurred in Underwriting Year
2011 was 89 claims and it dominated by
Commercial occupation of 64 claims. It was
caused by Earthquakes in 2011 namely Nusa Dua
Earthquake on 13 October 2011 with a magnitude
of 6.8 S.R and Sibolga Earthquake on 6
November 2011 with a magnitude of 6.7 S.R.
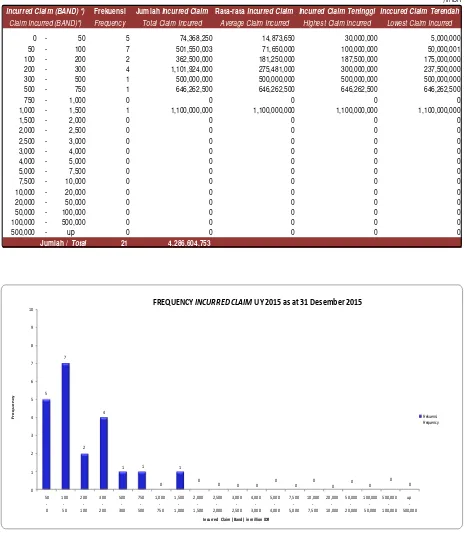
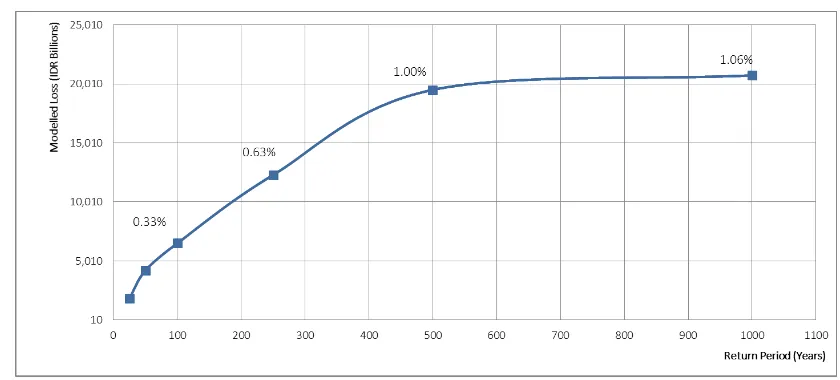
Berdasarkan Tabel 1.4 dan grafik terlihat
bahwa untuk frekuensi klaim tinggi berada
pada Total
Incurred Claim
yang relatife kecil,
sedangkan untuk frekuensi klaim kecil berada
pada Total Incurred Claim yang relative besar.
Based on table 1.4 and graph below it can be
seen that the high frequency claims lies in
relatively small Total Claim Incurred, while low
frequency claims lies in relatively big Total Claim
Incurred.
2011
2012
2013
2014
2015
Agrikultural /
Agricultural
A
0
0
0
0
0
Komersial / Commercial
C
64
15
47
10
14
Industrial /
Industrial
I
0
0
5
1
0
Residensial /
Residential
R
25
1
7
3
7
89
16
59
14
21
Tabel 1.3 Frekwensi Klaim Berdasarkan Okupasi per 31 Desember 2015
Occupation
Jumlah /
Total
Table 1.3 Claim Frequency By Occupation as at 31 December 2015
Underwriting Year
*) Dalam Rupiah *) In IDR
Frekuensi
Jumlah
Incurred Claim
Rata-rata
Incurred Claim Incurred Claim Tertinggi Inccured Claim Terendah
Frequency
Total Claim Incurred
Average Claim Incurred
Highest Claim Incurred
Lowest Claim Incurred
0
-
50
5
74,368,250
14,873,650
30,000,000
5,000,000
Table 1.4 Frequency Incurred Claim Underwriting Year 2015 as at 31 December 2015
Claim Incurred (BAND)*)
Incurred Claim (BAND) *)
Jumlah /
Total
Tabel 1.4 Frekuensi I
ncurred Claim Underwriting Year
2015 Per 31 Desember 2015
5
Incurred Claim (Band) in million IDR
FREQUENCY
INCURRED CLAIM
UY 2015 as at 31 Desember 2015
Dengan melihat tabel 1.5 tampak bahwa
jumlah
klaim
terbesar
berada
pada
Underwriting Year
2013. Klaim yang terbesar
adalah pada okupasi Komersial, yaitu 99.66%
dari total klaim di
Underwriting Year
2013 atau
sebesar Rp286,9 miliar.
Looking at table 1.5 below, it shows that the
largest claim is in the Underwriting Year 2013. The
largest claim is under Commercial occupation that
is 99.66% of the total claim in Underwriting Year
2013 or
Rp
286.9 billion.
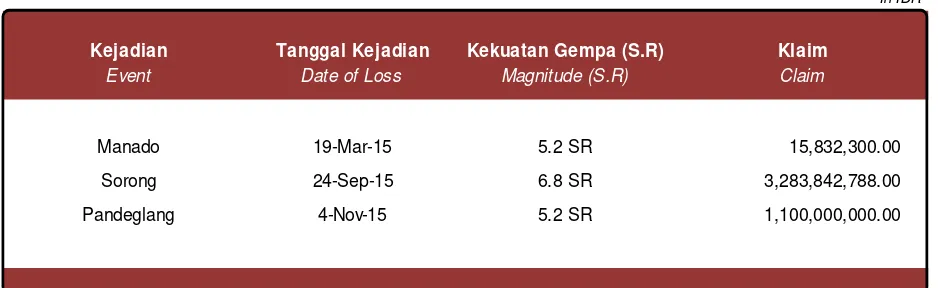
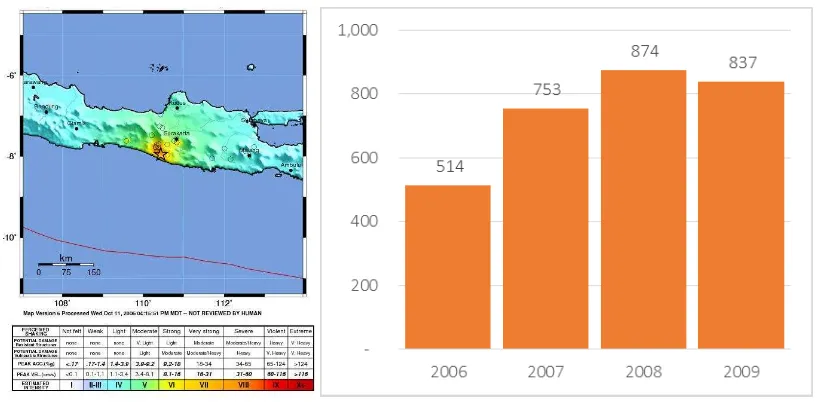
Tabel 1.6 menyajikan kejadian Gempa
Bumi Tahun 2015 dan
Incurred Claim
sampai
dengan 31 Desember 2015.
Table 1.6 shows earthquake events occurred
in 2015 and the corresponding incurred claims as
at 31 December 2015.
Table 1.5 Claim Amount By Occupation as at 31 December 2015
Dalam Rupiah
In IDR
2011
2012
2013
Jumlah /
Total
%
Jumlah /
Total
%
Jumlah /
Total
%
Jumlah /
Total
%
Jumlah /
Total
%
Agrikultural / Agricultural A 0.00 0.00 0.00 0.00 0.00 0.00 0.00 0.00 0.00 0.00Komersial / Commercial C 9,686,155,241.29 97.20 1,877,689,515.05 98.51 286,901,665,720.40 99.66 624,550,950.05 66.80 3,378,130,752.00 0.00
Industrial / Industrial I 0.00 0.00 0.00 0.00 890,057,888.00 0.31 200,000,000.00 21.39 0.00 0.00
Residensial / Residential R 279,190,155.04 2.80 28,314,000.00 1.49 89,882,464.00 0.03 110,464,625.00 11.81 858,474,000.00 0.00
9,965,345,396.33 100.00 1,906,003,515.05 100.00 287,881,606,072.40 100.00 935,015,575.05 100.00 4,236,604,752.00 0.00
2015
Jumlah /
Total
Underwriting Year
Tabel 1.5 Jumlah Klaim Berdasarkan Okupasi per 31 Desember 2015
2014
Okupasi /
Occupation
Tabel 1.6 Kejadian Gempa Bumi Tahun 2015 dan Klaim per 31 Desember 2015
Table 1.6 Earthquak e Event in 2015 and Claim as at 31 December 2015
Dalam Rupiah
In IDR
Kejadian
Tanggal Kejadian
Kekuatan Gempa (S.R)
Event
Date of Loss
Magnitude (S.R)
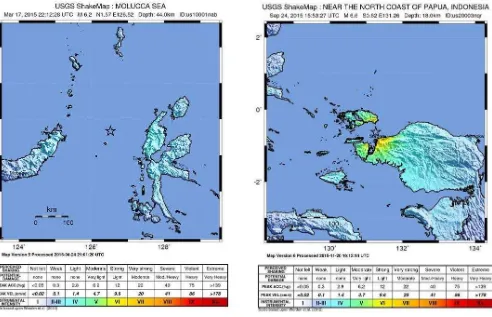
Manado
19-Mar-15
5.2 SR
15,832,300.00
Sorong
24-Sep-15
6.8 SR
3,283,842,788.00
Pandeglang
4-Nov-15
5.2 SR
1,100,000,000.00
Claim
Gambar 3. Peta Intensitas dan ShakeMap Gempa Manado dan Sorong setelah kejadian (sumber peta intensitas:
http://www.earthquake.usgs.gov
).
Picture 3. Intensity Map and ShakeMap Manado and Sorong Earthquake after event (intensity map sources:
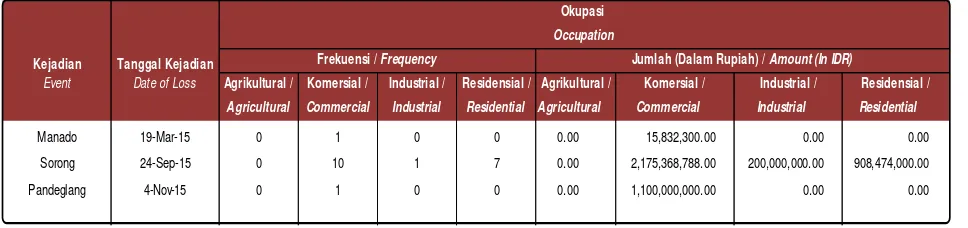
Tabel 1.7 menyajikan klaim untuk
event
Manado, Sorong, Pandeglang perjenis okupasi.
Table 1.7 shows Manado, Sorong,
Pandeglang event by occupation.
Tabel di bawah ini adalah daftar klaim
terbesar sampai dengan tanggal 31 Desember
2015.
The table below is a list of the largest claims
as at 31 December 2015.
Tabel 1.8 menyajikan data jumlah polis dan
loss ratio per 31 Desember 2015. Tabel tersebut
menunjukkan bahwa loss ratio tertinggi berada
pada
Underwriting Year
2013 sebesar 6.35%. Hal
Table 1.8 shows number of policies, and
loss ratio as at 31 December 2015. The table
show that the biggest loss ratio was at
Underwriting Year 2013 i.e. 6.35%. It was
Tabel 1.7 Kejadian Gempa Bumi Tahun 2015 dan Klaim per Okupasi per 31 Desember 2015
Table 1.7 Earthquake Event in 2015 and Claim per Occupation as at 31 December 2015
Event
Date of Loss
Agrikultural / Komersial /
Industrial /
Residensial /
Agricultural
Commercial
Industrial
Residential Agricultural
Commercial
Industrial
Residential
Manado
19-Mar-15
0
1
0
0
0.00
15,832,300.00
0.00
0.00
Sorong
24-Sep-15
0
10
1
7
0.00
2,175,368,788.00
200,000,000.00
908,474,000.00
Pandeglang
4-Nov-15
0
1
0
0
0.00
1,100,000,000.00
0.00
0.00
Occupation
Residensial /
Agrikultural /
Komersial /
Industrial /
Kejadian
Tanggal Kejadian
Okupasi
Frekuensi /
Frequency
Jumlah (Dalam Rupiah) /
Amount (In IDR)
Dalam Rupiah
In IDR
No.
Kejadian
Tanggal Kejadian
Kekuatan Gempa (S.R)
Klaim
Event
Date of Loss
Magnitude (S.R)
Claim
1
ACEH
26-12-2004
9
754,824,800,884.61
2
YOGYA
27-05-2006
5.9
289,242,751,716.49
3
PADANG
06-03-2007
5.8
22,480,129,238.99
4
BENGKULU
12-09-2007
7.9
48,986,738,634.52
5
PADANG
16-08-2009
6.9
42,782,942,555.00
6
TASIKMALAYA
02-09-2009
7.3
24,310,815,987.24
7
PARIAMAN
30-09-2009
7.6
1,083,832,055,213.85
8
BIMA
09-11-2009
6.7
43,046,593,135.48
9
MERAPI
25-10-2010
*)
27,499,741,856.40
10
KELUD
13-02-2014
*)
247,196,101,790.94
*) Penyeba b terka i t l etus a n gunung bera pi
*) Caused by volcanic eruption
Daftar Klaim - Klaim Terbesar Posisi 31 Desember 2015
ini dipengaruhi oleh nilai klaim yang cukup tinggi
yang mayoritas disebabkan dari Erupsi Gunung
Kelud tahun 2014.
influenced by large amount of claim that
majority resulting from Kelud Eruption in
2014.
Tabel 1.9 menyajikan Premi dan
Exposure
per 31 Desember 2015.
Table 1.9 shows Premium and Exposure as at
31 December 2015.
Tabel 1.8 Jumlah Polis dan Loss Ratio per 31 Desember 2015 Table 1.8 Number of Policies and Loss Ratio as at 31 December 2015
Underwriting Jumlah Polis Premi *) Frekwensi Klaim Jumlah Klaim *) Year Number of Policies Premium *) Claim Frequency Incurred Claim *)
2011 165,940 2,823,356,200,046.76 89 9,965,345,396.33 0.35%
2012 173,274 2,719,609,848,391.34 16 1,906,003,515.05 0.07%
2013 189,172 4,530,302,148,356.92 59 287,881,606,072.40 6.35%
2014 224,621 5,004,519,735,884.30 14 935,015,575.05 0.02%
2015 144,260 2,634,851,214,057.95 21 4,236,604,752.00 0.16%
Keterangan : *) Dalam Rupiah
*) In IDR
Loss Ratio