The Segmentation of Facebook Users in Palembang
–
Indonesia
Diah Natalisa*
ES Margianti**
Welly Nailis*
Eko Fitrianto*
*University of Sriwijaya
**University of Gunadarma
Abstract
Human being as social creature have a nature to interact with each other. The advancement of computer technology and internet cause the emergence of many social network sites to facilitate people interaction. Facebook is one of them among others that show no decreasing of popularity and probably having the most users in Indonesia. The users of Facebook come from many kinds of background. This phenomenon makes it interesting in term of consumer profiles and psychographic segmentation. This study aims to investigate the profiles and life styles of Facebook users in Palembang city. The findings would be very useful for marketers who will take advantage of social media to promote in their products. The results of the study showed that the majority of Facebook users are women (64%), age 15 – 19 (50%), high school education (47%), student (69%), favorite color is blue (27%), use Facebook for 2-3 years (45%), use cellular phone (47%), first activity: check the notification (83%), daily access (36%) and length of access: < 30 minutes. Using Cluster Analysis for segmentation resulted: 3 segments for Activity variable; 3 segments for Interest variable; and 4 segments for Opinion variable.
I. INTRODUCTION
As a social living creature, people need to communicate each other, as the natural tendency of God’s creation. There were many experts who tried to identify this through
scientific research. One of them is Abraham Maslow with his pyramid theory. In this theory, Maslow declared that human needs are hierarchical from the basic needs (physiology) to the highest needs (self-actualization). In the third level of pyramid in this theory, people require social needs, the need of interaction to others, the need of love and sharing.
People nowadays are those who cannot be separated from the impact of technology all around. Along with the changing of life style, the development of information technology is rapidly efflorescence such as equipment, infrastructures, and the media of information technology. The development of information technology cut off the distance, so that people can socialize with others even from far away. Social media today appeared as a solution for modern life that make people connected and reach much information from other people and as a result, Friendster, MySpace, Facebook, and others are the pattern of that social media.
In 2007, Facebook started to be popular. This site is very popular because it was used by the candidates of United States president, Barack Obama as a campaigning media. In a few years, the popularity of Facebook got Friendster and MySpace lost. In January 2011, Facebook had 600 million active users in the whole world, and Facebook placed the second rank of web of the world, after Google (August 18 of 2011, Alexa). The interest of joining Facebook also occurred in Indonesia. Indonesia has around 30 million active users of Facebook and they make us of it to share ideas and opinion, express their feelings, form a group, look for old friends, share information, and promote their business.
things that can be found from this phenomenon. The questions appeared with this phenomenon are like about the user profile based on the psychographic variable, and how about the grouping of the consumer? The marketers can use this information for marketing activity, moreover the social media usage nowadays become the new trends of marketing. This is because the social media can be the part of promotional tools efficiently and effectively.
The aim of this research is:
Knowing the profile and the lifestyle of Facebook users in Palembang
As the considered information for business party that want use social media for promotion
II. LITERATURE REVIEW
Lifestyle according to Kotler (2002, p. 192) is the life pattern of people in the world that delivered in activity, intention, and opinion. Lifestyle describes “the entire part of somebody” in interact with the surrounding. Lifestyle draws whole pattern of someone in
acting and interacting to the world. For Assael (1984, p. 252), lifestyle is “A mode of living that is identified by how people spend their time (activities), what they consider important in their environment (interest), and what they think of themselves and the world around them (opinion)”.
174) is the life pattern of people in their daily life expressed through activities, intention and opinion. Lifestyle reflects whole character of people in interact with the environment.
Based on varied definition above can be concluded that lifestyle is someone’s
pattern of life that can be seen from the activities, interest and opinion in spending money and allocate times. The prime factors of lifestyle can be divided in two: demographic and psychographic. Demographic factors can be seen based on the level of education, age, income and gender, meanwhile psychographic factors is more complex because the indicator is based on consumer characters.
Psychograph is the quantitative measurement of lifestyle, personality, and demographics of consumers. Psychograph sometimes meant as the measurement of AIO (activity, interest, opinion). Psychograph accommodates some questions that can describe the consumers’ activity, interest, opinion. Psychograph approach often be used by the producers
to promote their products, as stated by Kotler that psychograph always becomes the valid methodology and valued for many marketers (2002, p. 193). Solomon in Sumarwan (2003, p. 59) explained the study of psychograph in some forms below.
1. A lifestyle profile, analyzed few characteristics that differ the users and non-users of a product.
2. A product-specific profile that identify the group of target and then shape the consumers profile based on the relevant dimensions of products.
3. Study that use the personality as factor to explain, analyze the relation of some variables and the character of personality, in example character of personality that related to the consumers who pay attention on environment cases.
5. Specific product segmentation is the study that group the consumers based on the similarity of products consumed.
People based on the same sub-culture, social class, and jobs can have different lifestyle. Lifestyle is the pattern’s life of someone in the world expressed through activities, interest, and opinion. Lifestyle describes “the entire part of somebody” that interacts with the environment. Marketers find the relation of their products with the group of consumers’ life style. As the sample, the producers of computer possibly find that the majority of computer buyers are oriented to the accession of achievements. For that, marketers can clearly direct their brands to the lifestyle of people with the accession of achievements.
III. METHODOLOGY RESEARCH
This research use exploratory and conclusive descriptive research of single cross sectional. The survey is conducted to 109 Facebook users in Palembang, with purposive sampling.
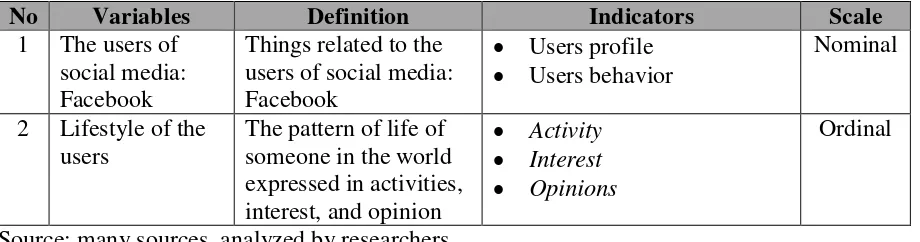
Table below shows the variables, operational definition of variables, indicators and the measurement scale of variables.
Table 1
Operational Definition of Variables, Indicators and Measurement Scale
No Variables Definition Indicators Scale
1 The users of
The pattern of life of someone in the world
The statistic tools used are frecuency, descriptive, cluster analysis, and crosstabulation. Whereas, for the data analysis, SPSS for Windows ver. 17.0 and Microsoft Excel is used.
IV. RESULT AND DISCUSSION
Frequency Analysis of Profile and Behavior
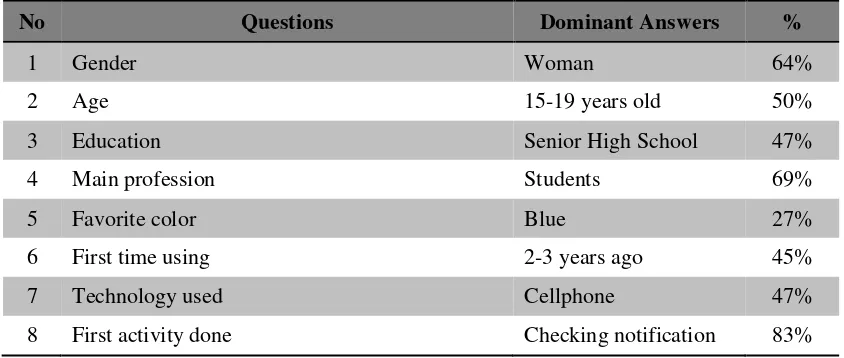
Table below indicates the profile of respondents. It can be seen from the gender, the majority of Facebook users are women (64%), aged 15-19 years old (50%), educated in senior high school (47%), main profession are students (69%), and the favorite color is blue (27%). This data define that the majority of Facebook are the adolescent girls as students that prefer blue as the favorite color.
For the respondents profile, the majority of respondents who first time have Facebook account is in 2-3 years ago (45%), the technology used is cellphone (47%), the first activity run after login is checking notifications (83%), access every day in a week (36%), and the time to access is less than 30 minutes (37%). This proves that the majority of Facebook users knew Facebook for more than 2 years ago, use cellphone to check Facebook notifications every day for less than 30 minutes.
Table 2
Profile and Respondents Behavior
No Questions Dominant Answers %
1 Gender Woman 64%
2 Age 15-19 years old 50%
3 Education Senior High School 47%
4 Main profession Students 69%
5 Favorite color Blue 27%
6 First time using 2-3 years ago 45%
7 Technology used Cellphone 47%
9 Accessing in weeks Every day 36%
10 The time of accessing Less than 30 minutes 37%
Source: primary data, processed
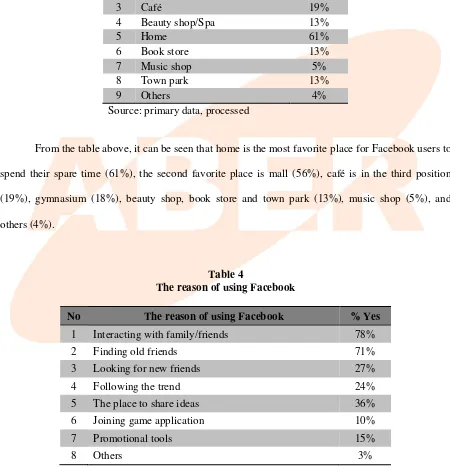
Table 3
Favorite place to spend spare time No Favorite Places % Yes
From the table above, it can be seen that home is the most favorite place for Facebook users to
spend their spare time (61%), the second favorite place is mall (56%), café is in the third position
(19%), gymnasium (18%), beauty shop, book store and town park (13%), music shop (5%), and
others (4%).
Table 4
The reason of using Facebook
No The reason of using Facebook % Yes
1 Interacting with family/friends 78%
2 Finding old friends 71%
friends (27%), following the trend (24%), promotional tools (15%), joining game application (10%)
and others (3%). The result of this analysis indicates that using Facebook is needed to fulfill the
socialization needs (interacting, finding old friends, and sharing ideas), also for the interest of
business (promotion), and for fun (game).
Analysis of Frequency in Activities, Interest, Opinion (AIO) Variables Recapitulation of question item in Activity
Table 5
Recapitulation of question items (Activity)
No Activities STS TS CS S LDS
1 Watching TV more than 4 hours/days 10 30 36 28 5
2 Internet (browsing) more than 2 hours/days 2 26 40 34 7
3 Internet (chatting) more than 1 hour/days 14 34 26 29 6
4 Chatting with friends in spare time more than 1
hour/days 2 14 39 40 14
5 Works more than 8 hours/days 4 27 46 26 6
6 Physical exercise less than 1 hour/days 14 29 31 31 4
7 Calling less than 1 hours/days 13 18 33 38 7
8 Driving (in the vehicles; going to or going back
from activity) more than 2 hours/days 11 38 23 28 9
9 Reading (newspaper, book, others) less than 1
hour/days 6 31 38 28 6
10 Spare time for family (chatting, dinner, watching
TV, and others) more than 4 hours/days 5 19 45 36 4
11 Sleeping more than 8 hours/day 6 30 42 30 1
Source: Primary data, processed
Information: STS = Sangat tidak sesuai (not very appropriate), TS = Tidak sesuai (not appropriate), CS = Cukup sesuai (appropriate enough), S = Sesuai (appropriate), LDS = Lebih dari sesuai (more than appropriate)
The table above is the recapitulation table of answers in activity variable. From the table it is
stated about the composition of answers from in each item of question. Information obtained from the
table above: majority of respondents who watch TV more or less than 4 hours in a day, average hours
of internet browsing 2 hours/day, internet chatting less than 1 hour/day, work more or less 8
hours/day, physical exercise less than 1 hour/day, call more than 1 hour/day, be in the vehicles less
than 2 hours/day, read newspaper less than 1 hour/day, spare time for family more or less 4 hours/day,
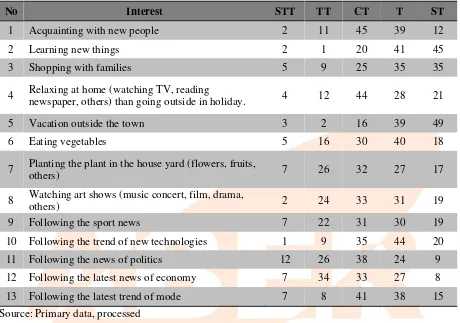
Recapitulation of question items in Interest
Table 6
Recapitulation of Interest question items
No Interest STT TT CT T ST
1 Acquainting with new people 2 11 45 39 12
2 Learning new things 2 1 20 41 45
3 Shopping with families 5 9 25 35 35
4 Relaxing at home (watching TV, reading
newspaper, others) than going outside in holiday. 4 12 44 28 21
5 Vacation outside the town 3 2 16 39 49
6 Eating vegetables 5 16 30 40 18
7 Planting the plant in the house yard (flowers, fruits,
others) 7 26 32 27 17
8 Watching art shows (music concert, film, drama,
others) 2 24 33 31 19
9 Following the sport news 7 22 31 30 19
10 Following the trend of new technologies 1 9 35 44 20
11 Following the news of politics 12 26 38 24 9
12 Following the latest news of economy 7 34 33 27 8
13 Following the latest trend of mode 7 8 41 38 15
Source: Primary data, processed
Information: STT = Sangat tidak tertarik (not very interested), TT = Tidak tertarik (not interested), CT = Cukup tertarik(interested enough), T = Tertarik (interested), ST = Sangat tertarik (very interested)
Table above is the recapitulation of answers in interest variable. From the table it is stated
about the composition of answers from in each item of question. Information obtained from the table
above: majority of respondents who interested enough in acquainting new friends, interested in
learning new things, interested in shopping with family, interested enough in relaxing at home,
interested in eating vegetables, interested enough in watching art shows, interested in following the
sport news, interested in following the trend of new technologies, interested enough in following news
of politics, not interested in following the latest news of economy, and interested enough in following
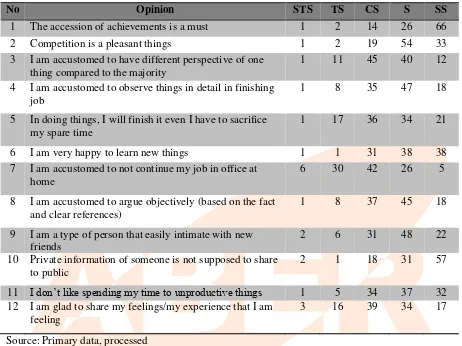
Recapitulation of question items in Opinion
Table 7
Recapitulation of Opinion question items
No Opinion STS TS CS S SS
1 The accession of achievements is a must 1 2 14 26 66
2 Competition is a pleasant things 1 2 19 54 33
3 I am accustomed to have different perspective of one thing compared to the majority
1 11 45 40 12
4 I am accustomed to observe things in detail in finishing job
8 I am accustomed to argue objectively (based on the fact and clear references)
1 8 37 45 18
9 I am a type of person that easily intimate with new friends
2 6 31 48 22
10 Private information of someone is not supposed to share to public
2 1 18 31 57
11 I don’t like spending my time to unproductive things 1 5 34 37 32
12 I am glad to share my feelings/my experience that I am feeling
3 16 39 34 17
Source: Primary data, processed
Information: STS = Sangat tidak setuju (not very agree), TS = Tidak setuju (not agree), CS = Cukup setuju (agree enough), S = Setuju (agree), SS = Sangat setuju (very agree)
Table above is the recapitulation of answers in opinion variable. From the table it is stated
about the composition of answers from in each item of question. Information obtained from the table
above: majority of respondents think that the accession of achievements is a must, competition is a
pleasant things, accustomed to have different perspective, observe things in detail, agree enough to
sacrifice spare time, glad to learn new things, accustomed to continue job in office at home,
accustomed to argue objectively, is a type of person that easily intimate with new friends, doesn’t like
private information to be shared to public, doesn’t like spending time to unproductive things, and glad
Cluster Analysis
Cluster analysis principally used to reduce the data that it is the process of abridging numbers
of variables to be less than before and named it as cluster. In this research, the variable that will be
reduced is based on the main variables, they are: activity (11 questions), interest (13 questions), and
opinion (12 questions).
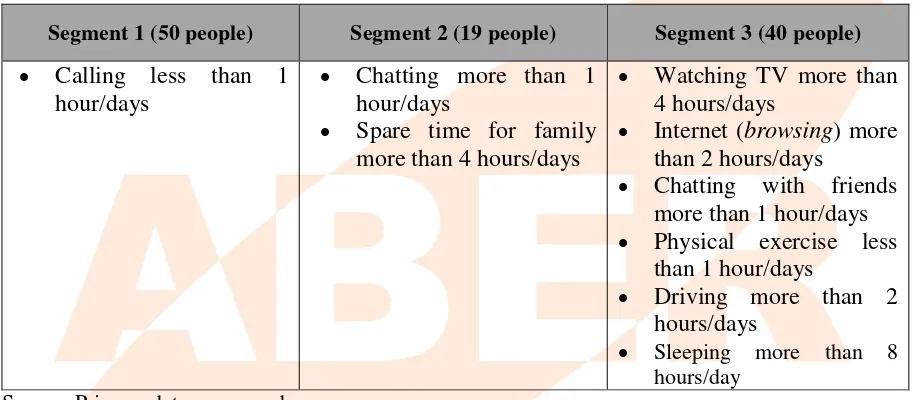
Cluster Analysis in Activities Variable
Table 8
The amount of members in each segment and Items of variable considered important in each segment
Segment 1 (50 people) Segment 2 (19 people) Segment 3 (40 people) Calling less than 1
hour/days
Chatting more than 1 hour/days
Spare time for family more than 4 hours/days
Watching TV more than 4 hours/days
Internet (browsing) more than 2 hours/days
Chatting with friends more than 1 hour/days Physical exercise less
than 1 hour/days
Driving more than 2 hours/days
Sleeping more than 8 hours/day
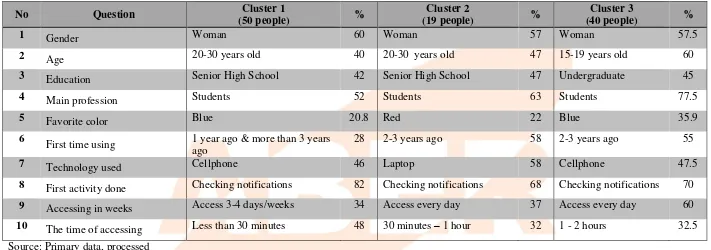
Table 9
Recapitulation of Profile and Behavior Majority of Facebook Users based on Segment (Activities)
No Question Cluster 1
(50 people) %
Cluster 2
(19 people) %
Cluster 3
(40 people) %
1 Gender Woman 60 Woman 57 Woman 57.5
2 Age 20-30 years old 40 20-30 years old 47 15-19 years old 60
3 Education Senior High School 42 Senior High School 47 Undergraduate 45
4 Main profession Students 52 Students 63 Students 77.5
5 Favorite color Blue 20.8 Red 22 Blue 35.9
6
First time using 1 year ago & more than 3 years ago
28 2-3 years ago 58 2-3 years ago 55
7 Technology used Cellphone 46 Laptop 58 Cellphone 47.5
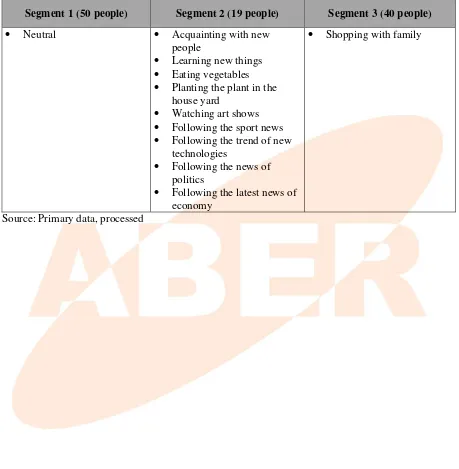
Cluster Analysis in Interest Variable
Table 10
The amount of members in each segment and Items of variable considered important in each segment
Segment 1 (50 people) Segment 2 (19 people) Segment 3 (40 people)
Neutral Acquainting with new
people
Learning new things Eating vegetables Planting the plant in the
house yard
Watching art shows Following the sport news Following the trend of new
technologies
Following the news of politics
Following the latest news of economy
Shopping with family
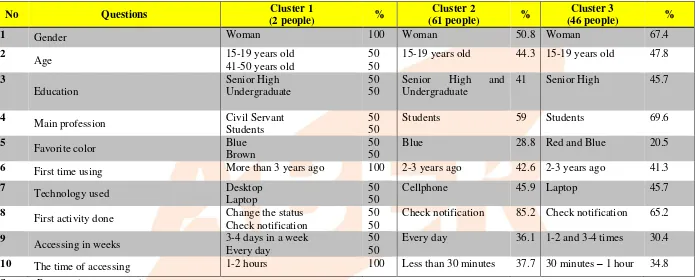
Table 11
Recapitulation of Profile and Behavior Majority of Facebook Users based on Segment (Interest)
No Questions Cluster 1
Main profession Civil Servant
Students
Technology used Desktop
Laptop
50 50
Cellphone 45.9 Laptop 45.7
8
First activity done Change the status Check notification
50 50
Check notification 85.2 Check notification 65.2
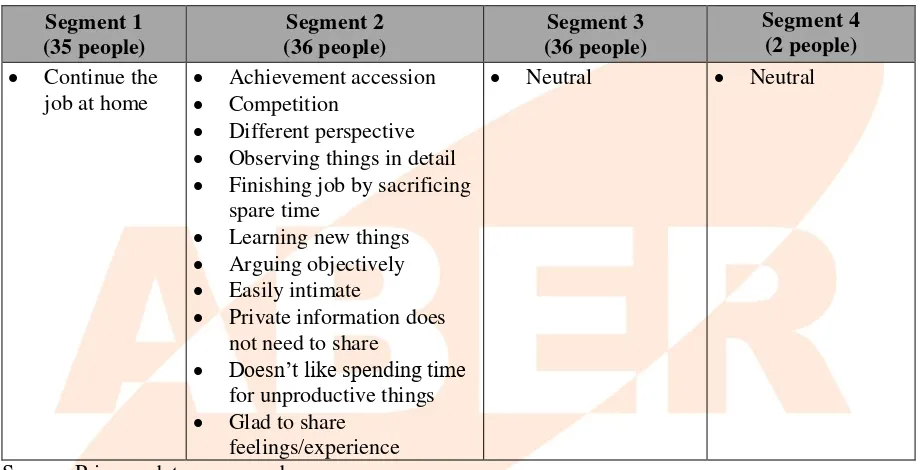
Cluster Analysis of Opinion Variable
Based on the significant value of Anova (as basic of whether the variables are different
between the segment), all the items questions have significant value below 0.05 which means that all
questions have differences between the segment. Based on the cluster analysis, 4 cluster formed that
have different characteristics, the four cluster are:
Table 12
The amount of members in each segment and Items of variable considered important in each segment Segment 1 Observing things in detail Finishing job by sacrificing
spare time
Doesn’t like spending time
for unproductive things Glad to share
feelings/experience
Neutral Neutral
Table 13
Recapitulation of Profile and Behavior Majority of Facebook Users based on Segment (Opinion)
No Questions Cluster 1
Main profession Students 40 Students 69.4 Students 80.6 Private servant
Students
V. CONCLUSION
The findings of this research shows that the majority of Facebook users are women (64%), aged 15-19 years old (50%), educated in Senior High School (47%), as students (69%), the favourite colour is blue (27%), have been using 2-3 years ago (45%), access through cell phone (47%), first activity run is: checking the notifications (83%), access every day (36%), and the access time is: less than 30 minutes (37%). Based on cluster analysis (segmentation), activity variable formed 3 groups, interest variable formed 3 groups, and opinion variable formed 4 groups. After knowing the information of segmentation in consumers’ lifestyle, this can be the consideration (additional information) for marketers in the marketing strategy, mainly for Facebook users as the media of promotion.
This research suggested to do advanced research that dig it more, for example to research one or two interested segments, and run the quantitative research to find the relationship of lifestyle and purchasing decision.
REFERENCES
Cheng, Jen-Son;Yang, Ming-Ching;Ting, Ping-Ho;Chen, Wan-Lin;Huang, Yi-Yu (2011). Leisure, Lifestyle, and Health-Related Physical Fitness For College Students. Social Behavior and Personality; 2011; 39, 3; ProQuest Sociology. pg. 321
http://id.wikipedia.org/wiki/Situs_jejaring_sosial. Accessed in August 17, 2011
http://www.membuatblog.web.id/2010/04/pengertian-gaya-hidup.html. Accessed in August 17, 2011
Kotler, Phillip (2000). Manajemen Pemasaran, Ed. 11, Prenhallindo
Maslow, Abraham (2006). On Dominance, Self Esteem and Self Actualization. Ann Kaplan: Maurice Basset. Hlm. 153, 168, 170-172, 299-342.
Santoso, Singgih and Fandy Tjiptono, 2001. Riset Pemasaran (Konsep dan Aplikasinya dengan SPSS), PT. Elex Media Komputindo
Simamora, Bilson (2002). Membongkar Kotak Hitam Konsumen, Gramedia Pustaka Utama Simamora, Bilson (2002). Riset Konsumen (Falsafah, Teori dan Aplikasi), Gramedia Pustaka
Utama
Sumarwan, Ujang (2001). Perilaku Konsumen (Teori dan Penerapannya Dalam Pemasaran), Ghalia Indonesia
Wikipedia. Org