i
ANALISIS PROSES
SAFETY
DAN PENERAPAN SISTEM
MANAJEMEN KESELAMATAN DAN KESEHATAN KERJA
DI PT INTERNATIONAL CHEMICAL INDUSTRY
Nama : Amor Bayu Pratama NRP : 2508.100.047
Jurusan : Teknik Industri FTI-ITS
Pembimbing : Yudha Andrian Saputra, S.T., MBA Ko-Pembimbing : Ir.Sritomo Wignjosoebroto, M.Sc
Abstrak
PT. International Chemical Industry adalah salah satu perusahaan yang memproduksi baterai. PT. International Chemical Industry telah menerapkan SMK3, tetapi masih belum optimal. Dalam penelitian ini, perhitungan resiko kecelakaan yang mungkin terjadi dalam proses produksi menggunakan metode
Failure Mode Effect Analysis (FMEA). Kemudian menggunakan metode Nordic body map (NBM) dan juga Quick Exposure Checklist (QEC) untuk menentukan
bagaimana postur tubuh saat kondisi kerja dan nyeri atau sakit yang dirasakan. Setelah itu dilakukan root cause analysis untuk menentukan penyebab kecelakaan
secara keseluruhan.
Berdasarkan hasil FMEA diperoleh 6 kategori risiko tinggi, 3 risiko menengah dan 26 kategori risiko rendah. Sementara kondisi pekerja dalam hal postur kerja perlu diselidiki lebih lanjut untuk operator dan perbaikan segera untuk non-operator (pekerja transportasi). Hasil rekomendasi adalah untuk mengembangkan sistem manajemen keselamatan dan kesehatan dan menciptakan sebuah program yang terjadwal, mengendalikan risiko yang terkait dengan alat pelindung diri, kelengkapan peralatan pertolongan pertama (P3K), dan memasang tanda-tanda keselamatan kerja dan kesehatan.
i
ANALYSIS SAFETY PROCESS AND IMPLEMENTATION OF
OCCUPATIONAL HEALTH AND SAFETY MANAGEMENT
SYSTEM IN PT. INTERNATIONAL CHEMICAL INDUSTRY
Name : Amor Bayu Pratama NRP : 2508.100.047
Major : Teknik Industri FTI-ITS
Supervisor : Yudha Andrian Saputra, S.T., MBA Co-Supervisor : Ir.Sritomo Wignjosoebroto, M.Sc
Abstract
PT. International Chemical Industry is one of the companies producing batteries. PT. International Chemical Industry has implemented SMK3, but still not optimal. In this research, the calculation of the risk of accidents that may occur in the production process is using the method of Failure Mode Effect Analysis (FMEA). Then use Nordic body map (NBM) and also Quick Exposure Checklist (QEC) to determine how the body posture when working conditions and labor pains are felt. After the root cause analysis was conducted to determine the cause of the accident as a whole.
Based on the results of FMEA obtained 6 high-risk category, 3 medium risk and 26 low risk category. While the conditions of workers in terms of working posture needs to be investigated further for operators and repair immediately to non-carriers (transport workers). The results of the recommendations is to develop system management of occupational safety and health is to create a scheduled program, to control the risks associated with personal protective equipment, the completeness of first-aid equipment (P3K), and put up signs of occupational safety and health.
v
CONTENTS
ABSTRACT ……… i
PREFACE……… iii
TABLE OF CONTENT ……….. v
LIST OF FIGURE ……… ix
LIST OF TABLE ……….... xiii
CHAPTER I INTRODUCTION ……… 1
1.1 Background ……… 1
1.2 Research Question……….……… 4
1.3 Research Objectives ……….. 4
1.4 Scope of Research ………. 5
1.4.1 Limitation… ……… 5
1.4.2 Assumption ………. 5
1.5 Benefit of Research ……….. 5
1.6 Systematic of Writing ………... 6
CHAPTER II LITERATURE REVIEW ……… 7
2.1 Occupational Health and Safety ………... 7
2.2 Occupational Safety ……… 8
2.2.1 Hazard Risk in Workplace ……… 8
2.2.2 Risk Analysis ……… 9
2.3 Occupational Health ……… 11
2.4 Occupational Accidents ……….. 12
2.4.1 Classification of Occupational Accidents ……….. 12
vi
2.5 The Occupational Health and Safety Management ……….. 15
2.6 Failure Mode and Effect Analysis (FMEA) ……….. 17
2.6.1 Purpose of FMEA ………... 17
2.6.2 The Basic Step of FMEA ………... 18
2.6.3 Determine Severity, Occurance, Detection and RPN …………... 18
2.7 Process Mapping …..………... 20
2.8 Nordic Body Map ………..……… 23
2.9 Quick Exposure Checklist ……….……… 25
2.10 Root Cause Analysis ……….... 31
2.11 Review of Previous Research ……….. 32
CHAPTER III RESEARCH METHODOLOGY ………….……… 35
3.1 Preliminary Phase ……….. 35
3.1.1 Problems Identification ………. 35
3.1.2 Research Objective Setting ………... 35
3.1.3 Literature Study ……… 36
3.1.4 Field Study……….……… 36
3.2 Data Collection Phase ……… 36
3.3 data Processing Phase ……… 36
3.4 Data Analysis and Interpretation Phase ………. 37
3.5 Conclusions and Recommendation Phase ……… 35
CHAPTER IV COLLECTING AND PROCESSING DATA ……… … 39
4.1 Collection Data ………..………. 39
4.2 Company Profile ………. 39
4.2.1 Visions and Company Policy ……… 41
vii
4.3 Product Identification Observation ………. 42
4.3.1 Physical Flow Battery Production Process R6 ……..….……….………... 43
4.3.2 Production Process R6 Batteries ……….…………... 44
4.4 Work Environment Conditions ……….. 46
4.5 Committee Occupational Safety and Health (P2K3L) ………... 49
4.6 Personal Protective Equipment (PPE) ………... 50
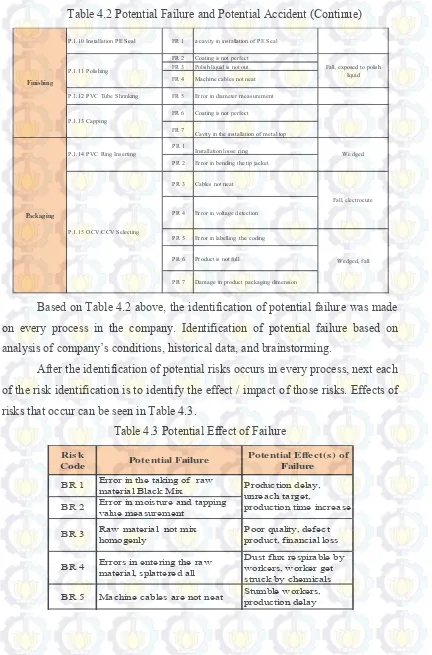
4.7 Risk Identification ………..……… 52
4.8 Nordic Body Map ………..……… 60
4.9 Standardize Nordic Questionnaire ………..………... 61
4.10 Occupational Accidents ………... 62
4.11 Handling of Occupational Accidents ………...……… 64
4.12 Risk Assessment ………..……… 65
4.13 Nordic Body Map ……… 70
4.14 Quick Exposure Checklist ……….………….. 72
4.15 Occupational Accidents ………... 75
4.16 Occupational Accidents Statistics ……… 77
4.17 Standard Procedure of Handling Accident Mapping ………... 79
4.18 Root Cause Analysis ……… 80
4.19 Improvements Recommendation ………. 82
4.19.1 Risk Control ………. 83
4.19.2 Safety Signs ………. 83
CHAPTER V ANALYSIS AND INTEPRETATION ………….………. 85
5.1 Analysis of Environmental Condition Work ………. 85
5.2 Analysis of P2K3L ………. 86
viii
5.3.1 High Risk Category ………... 93
5.3.2 Medium Risk Category ……….. 95
5.3.3 Low Risk Category ……….….……… 96
5.4 Analysis of Occupational Sick ………... 96
5.5 Analysis of Working Posture ………. 97
5.6 Analysis Occupational Accidents ………..………...98
5.7 Analysis of Occupational Accidents in Handling Process ………... 98
5.8 Analysis of Root Cause Analysis ………... 99
5.9 Analysis of Improvements Recommendations ……….. 99
CHAPTER VI CONCLUSION AND RECOMMENDATION………101
6.1 Conclusion ……….101
6.2 Recommendation ………... 102
BIBLIOGRAPHY ……….103
iii
PREFACE
Praise prayed to God for any overflow of grace, and guidance so authors can complete the bachelor thesis with the title "Analysis Safety Process and Implementation of Occupational Health and Safety Management System in PT. International Chemical Industry". This research was conducted as a requirement for completed undergraduate studies (S-1) and earned Bachelor of Industrial Engineering, Institut Teknologi Sepuluh Nopember. During the implementation and execution of the bachelor thesis, the author received a lot of guidance, direction, assistance, and motivations from various parties. Therefore, the authors would like express appreciation and gratitude deeply to the parties as follows:
1. The best Mom ever, Rosmimik, M.Si. Thank you for everything, for your patient, support, and your trust if I can graduate. You're the best mom, everything I do, I do it for you. And also to my father, Papa Ando, Marindo Palar for your support and pray.
2. My beloved sister and brother, Natasha Amor and Amor Ghozi. Finally, your brother graduate. Thanks cyinn.
3. Prof. Dr. Budi Santosa as head of the Department of ITS Industrial Engineering.
4. Mr. Ir. Sritomo Wignjosoebroto, M.Sc., as supervisor. Big thanks for the guidance, direction, and feedback in complete the research
5. Mr. Yudha Andrian as Co-Supervisor and Cordinator of Thesis for his information and kindness.
iv
7. Isma Nur Sabrina, Nadia Aulia, Chariza Dinda, Wahyu Rosita, Syamsina Addani, Itqan Archia, Syahidan Hidaya, Arga Zanuar Sang Putra, Dhina Yuskartika, Maria Ulfa who always gave support, love, sorrow, joy until today. Forever friends. 8. Companion in arms, Rizqi Mardhi Farisi, finally we can finish
this thesis. Thanks for help and team work.
9. All friends in Ergonomic and Work System Design Laboratory for all advice and help.
10.The whole class of Industrial Engineering, 2008. The best family, thanks for all passion 08IE ups and downs, experiences, stories, memories, and ideals that have been given. We are the best.
11.The entire faculty and department staff of Industrial Engineering ITS and the lessons learned during the author studied at Industrial Engineering ITS.
12.Everyone who has helped me during the process of writing this research.
Twenty years ago, Ronald Reagan said that admitting a mistake is not a weakness, but it is strength. Therefore, I ask for an apology if this research is still imperfect. In the end, I can only hope that this research can be useful in the future.
vii
LIST OF FIGURE
Figure 1.1 Data Recap of Work Accidents ……….. 4
Figure 2.1 Process mapping Symbols ………... 22
Figure 2.2 Nordic Body Map ………... 23
Figure 2.3 A1 (Normal Back/Almost Neutral)………. 26
Figure 2.4 A2 (Moderate Back/Moderately Flexed or Twisted) ... 27
Figure 2.5 A3 (Back too Bent/Excessively flexed or Twisted) ………... 27
Figure 2.6 E1 (Wrist always straight/Almost straight) ……… 28
Figure 2.7 E2 (Wrist bend/Deviant or Devianted/Bent) ………. 29
Figure 3.1 Research Methodology Flowchart……….. 37
Figure 3.1 Research Methodology Flowchart ………. 38
Figure 4.1 ABC Battery ……….. 40
Figure 4.2 Physical Flow Battery Production Process R6 ……….. 43
Figure 4.3 Production Process PT International Chemical Industry ……….. 46
Figure 4.4 Raw Material Storage Place ………... 47
Figure 4.5 Wet Floor ……… 48
Figure 4.6 Organization Structure of P2K3L ……….. 50
viii
Figure Error! No text of specified style in document.4.8 Graphs Occupational
Accidents Year 2009-2012 ………. 64
Figure 4.9 Occupational accident handling of process ……….... 64
Figure 4.10 Software QEC display for observer ………... 72
Figure 4.11 Software QEC display for worker ………..……….. 73
Figure 4.12 Display QEC result ……….………. 73
Figure 4.13 Based on type of accident ………. 76
Figure 4.14 Based on caused of accident ……… 77
Figure 4.15 Stakeholders involved to handling of accident ………. 79
Figure 5.1 Histogram RPN score in black mix and electrolyte liquid station ……. 89
Figure 5.2 Histogram RPN score in assembling station ………... 89
Figure 5.3 Histogram RPN score in finishing station ……….. 90
ix
List of Table
Table 1.1 Data Statistic of Workplace Accident in Indonesia ………. 1
Table 2.1 Potential Consequences ………... 9
Table 2.2 Likelihood ………... 10
Table 2.3 Estimation and Presentation ………... 10
Table 2.4 Hazard Map ……….. 10
Table 2.5 Hazard Risk Category ……….. 11
Table 2.6 Type of Accident according to Jamsostek ……….. 14
Table 2.7 Range of Severity ……… 19
Table 2.8 Range of Occurrence ……….. 19
Table 2.9 Range of Detection………... 20
Table 2.10 Level of exhaustion ………..………. 24
Table 2.11 Pain Complaints time ……… 24
Table 2.12 Consequences of Occupational……….. 24
Table 2.13 Total Lost Work Time Due to Pain……… 25
Table 2.14 Preliminary Action Level QEC……….. 30
Table 4.1 Personal Protective Equipment ………. . 51
x
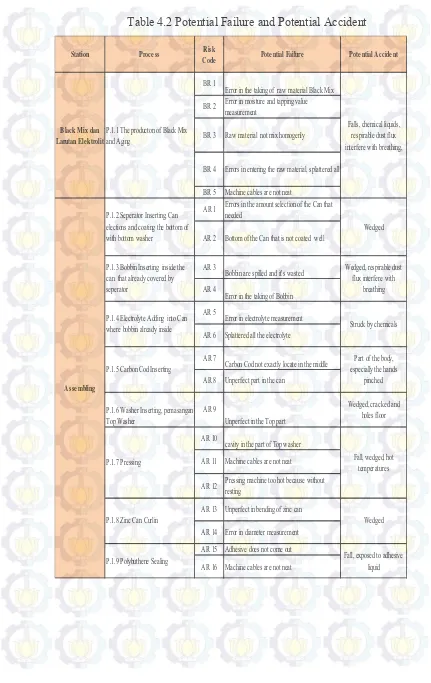
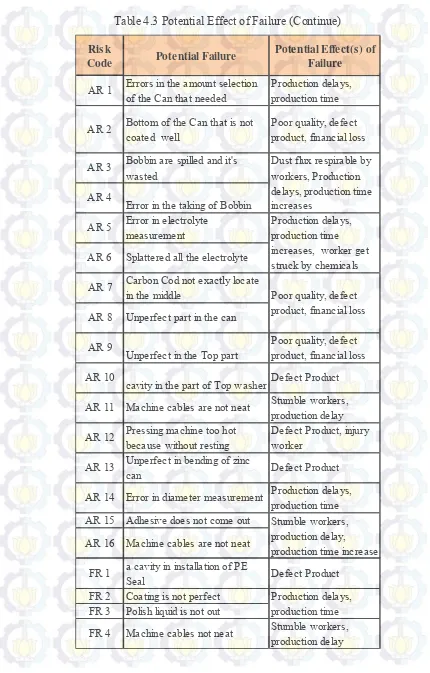
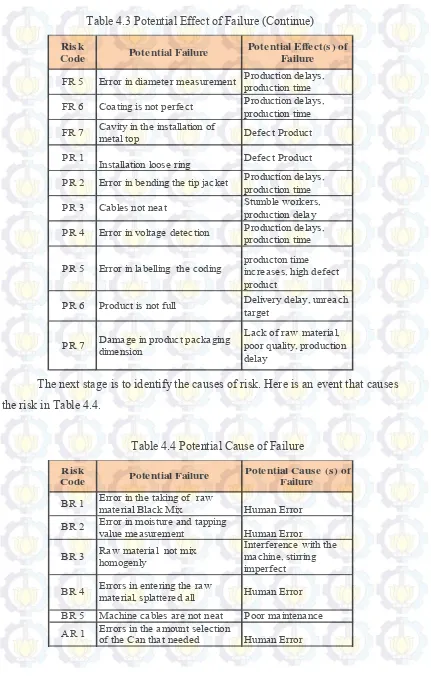
Table 4.3 Potential Effect of Failure ……… 54
Table 4.4 Potential Cause of Failure ……… 56
Table 4.5 Current Control ……… 58
Table 4.6 Recap questionnaire of NBM ……….. 60
Table 4.7 Time of Complain Pain ……… 61
Table 4.8 Consequences due to Pain ……….... 62
Table 4.9 Work time lost ………. 62
Table 4.10 Occupational Accident Year 2009-2012 ……….... 63
Table 4.11 Risk Assessment ……… 66
Table 4.12 RPN Scoring ……….. 68
Table 4.13 Recap NBM Questionnaire ……….... 70
Table 4.14 Recap Standardize Nordic Questionnaire ……… … 71
Table 4.15 QEC Total Score for Operator………... 74
Table 4.16 QEC Total Score for Non-Operator……….. 74
Table 4.17 QEC Score for Operator……… 75
Table 4.18 QEC Score for Non-Operator……… 75
Table 4.19 Grouping of Accidents in Total working Day Lost……… 76
Table 4.20 Recap Level of Frequency……… 78
xi
Table 4.22 Advantages and Disadvantage……… 80
Table 4.23 Root Cause Analysis Accident………... 81
Table 4.24 Standard PPE………... 83
Table 4.25 Recommendation Safety Sign………. 84
Table 5.1 Potential Accidents ………...87
1
1
CHAPTER I
2
INTRODUCTION
1.1Background
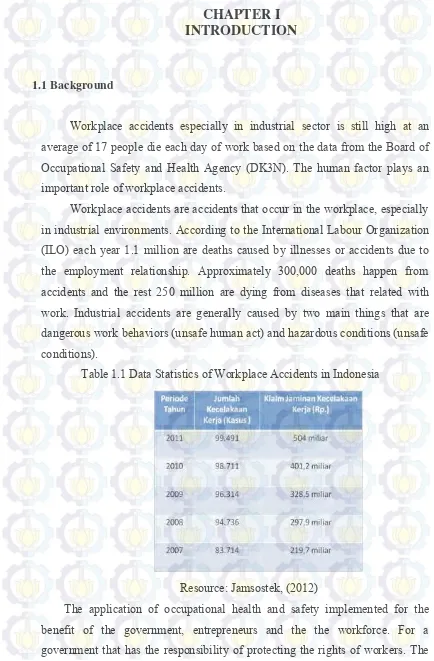
Workplace accidents especially in industrial sector is still high at an average of 17 people die each day of work based on the data from the Board of Occupational Safety and Health Agency (DK3N). The human factor plays an important role of workplace accidents.
Workplace accidents are accidents that occur in the workplace, especially in industrial environments. According to the International Labour Organization (ILO) each year 1.1 million are deaths caused by illnesses or accidents due to the employment relationship. Approximately 300,000 deaths happen from accidents and the rest 250 million are dying from diseases that related with work. Industrial accidents are generally caused by two main things that are dangerous work behaviors (unsafe human act) and hazardous conditions (unsafe conditions).
Table 1.1 Data Statistics of Workplace Accidents in Indonesia
Resource: Jamsostek, (2012)
2
good and right application of occupational safety and health can suppress or reduce the number of accidents. One of the workers rights is to work under safe conditions. Accordance with the law issued by the government that is, UU No. 1 of 1970 on Work Safety. Whereas for entrepreneurs and the workforce, implementation of occupational health and safety plays an important role in improving labor productivity that will determine the success of a production in an industry. If there any accidents happen in an industrial production process, it can disturb the other processes that can lead to decrease productivity. In chapter 2 of Permennaker no.05/men/1996, goals and objectives SMK3 application is to create a system of occupational safety and health (K3) in the workplace by involving elements of management, labor, and working conditions are integrated in order to prevent and reduce accidents and occupational diseases and the creation of a safe, efficient, and productive.
Activities in providing protection to eliminate or reduce the occurrence of occupational accidents is essentially composed of two aspects, that is the cost factor and the habits of the workforce itself (Hammer, 1981). In the prevention of work accidents in the work environment needs to be done several feasibility studies first, then supplies personal protective equipment (PPE) for the worker and others. This is related to the cost problem.
Effort to cope the accident only with considers the unsafe actions of workers will not give out the root of the problem that caused the accident (Reason, 1990). Because it needs to be investigated to determine root causes, not only can be seen from one part only. So that, today there is a shift in workplace safety and security measures, from measurements only look toward the accident rate measurements which focus on safety culture (Cooper, 2000). Culture of safety and job security plays a very important in shaping employees' attitudes about safety and job security, in particular by identifying and analyzing the factors that influence the occupational safety and health culture.
3
the name of PT. Everbright in 1959, then in 1968 also established factories in Jakarta under the name. International Chemical Industry. With the increasing demand for the products, PT. International Chemical Industry set up a factory in Surabaya in 1982.
Battery products of PT. International Chemical Industry not only sold in the local market, but also exported to overseas, such as: Europe (Russia), Asia (China, Japan), America (Canada) and Australia. In addition, PT. International Chemical Industry is also believed by national security institutions through a series of very stringent quality tests to supply Alkaline battery in the military since 2001. The sale of battery products of PT International Chemical Industry every year can reach up to about 100 million units per year.
Batteries is still widely used by humans. Raw materials of dry batteries contain harmful elements, such as: Lead (Pb), Cadmium (Cd), manganese (MnO2), carbon powder and NH4Cl. The materials are hazardous material that can cause negative effects, that is can damage the environment and is also dangerous to humans, especially the workers in the company itself. In addition to the production process also uses machines or heavy equipment. Good handling process safety can prevent accidents.
4
Figure 1.1 Data Recap of Work Accidents
This research was conducted to see the potential hazards or accidents that may occur in the company and what are the factors that can lead to accidents to workers and how to prevent it.
1.2Research Question
Problems that will be solved by this research is "How to identify and determine whether the process on the PT International Chemical Industry can be the potential occurrence of a hazard by using Failure Mode and Effect Analysis (FMEA). Then identify the pain experienced by workers with the method of Nordic Body Map (NBM) and Quick Exposure Checklist (QEC), then the factors that can lead to accidents in the production process by using the method of Root Cause Analysis in order to formulate solutions for precautions.
1.3Research Objectives
Related with background and problem formulation above, the study aims to:
1. To determine the potential occurrence of a hazard on the company. 2. To make analysis and evaluation of the factors that can be cause
accidents in the production process.
0 1 2 3 4 5
2009 2010 2011 2012
Amount
Year
5
3. To provide solutions precautions to control work accident based on the results of the study.
1.4Scope of Research
The scope of this research include limitations and assumptions of the research.
1.4.1 Limitation
These are the limitations of the research,
1. Research is only done on the production department.
2. The research was conducted only on work accidents caused by human error in the workplace.
1.4.2 Assumption
These are the assumption of the research:
1. Workplace accidents referred in this research include work accidents itself and the pain of working.
2. No change in the organizational structure at the time of the research.
1.5Benefit of Research
Benefits that can be gained through this the research, among others: • Benefits for student:
1. To get better understanding in the application of Failure Mode and Effect Analysis method (FMEA), Nordic Body Map (NBM), Quick Exposure Checklist (QEC) and Root Cause Analysis (RCA) on the real problems in the company.
2. To provide improvement solutions in accordance with the conditions of the company.
• Benefits for company:
6
2. Getting a recommendation to achieve system management of ocuppational health and safety implementation in accordance with the company.
1.6Systematics of Writing
The research writing system is divided into 6 chapters that consist of:
1. Chapter I contains the basic concept that the preparation of the final project consisted of background the research, the formulation of the problem, the purpose of writing, the benefits of writing and the scope of research.
2. Chapter II contains a literature review that is used as a reference in the literature akhir.Tinjauan assignments consist of a literature review of work safety, occupational accidents, risk, Failure Mode and Effect Analysis (FMEA), Nordic Body Map (NBM), Quick Exposure Checklist (QEC) and Root Cause Analysis (RCA).
3. Chapter III contains the steps to conduct research so as to find solutions for existing problems to get a conclusion.
4. Chapter IV contains the collection and processing of data about health and safety at the plant, the accident occurred as well as the manufacture of root cause analysis.
5. Chapter V contains the analysis of the results obtained from the previous chapter (Chapter IV).
7
CHAPTER II
LITERATURE REVIEW
This chapter contains the literature used in writing a research report. Spoken literature includes books, journals and previous research.
2.1 Occupational Health and Safety
In improved productivity, health and safety factors have an important role to increase production due to ensuring the welfare of human resources. Health and safety can not be separated from each other, where health will not be performing well when the action and safety activities did not take place. Otherwise safety activities are not going well, when human resources are not healthy mentally and physically, for example, affected by stress and job dissatisfaction, and chronic health disorders or incidental (Gani 1992).
Health and safety are interrelated one another. A broader term and more camouflaged is the term health which refers on physical condition, mental, and stability of emotions in general. Individuals who healthy is the that is free from disease, injury as well as the problem mental and emotion which could disturb human activity normal in general. Health and safety not only for the workers who deal directly with the the machine.
8
Participation of all managers in the organization in the implementation of accident prevention is needed (Hammer, 1981).
2.2 Occupational Safety
Occupational safety is safety that aimed at machines, working tools, materials and processing process, foundation of work and environment as well as ways do the job (Suma'mur, 1981).
Occupational safety is one of the main factors that is often touted by those industries in recent years. Awareness of the importance of safety based on the circumstances in which an investment that has been made, which are generally of great value in a factory / plant, can be lost or damaged due to negligence in the operation or negligence in the existing safety procedures that can also harm the workers.
2.2.1 Hazard Risk in Workplace
Safety relates to the acute effects of a hazard that occurred, while health is the effect of a chronic hazard (Ashfal, 1999). Hazard is defined as a condition of working that could potentially cause injury to personnel, damage to equipment or building structures, loss of material, or a reduced ability to perform specified functions. Hazards in the workplace can be categorized as follows:
Physical hazards
Includes noise, lighting, temperature, radiation Chemical hazards
Includes hazardous materials and toxic Biological Hazards
Includes bacteria, viruses, fungi, etc. Mechanical hazards
9
Includes harm caused due to certain positions (lifting, pushing, sitting, etc.), narrow space, poor lighting, etc.
Psychosocial Hazards
Includes shift work, long hours, job sharing Danger of behavior
Include lack of expertise, poor adherence to SOPs, etc. Environmental hazards
Covering a dark environment, not flat surfaces, moist, wet, etc. 2.2.2 Risk Analysis
According to the Standards Australia New Zealand (A / NZS) 4360: 2004, the risk is the chance occurrence of an uncertain event that can be affect the achievement of objectives. Meanwhile, according to Bowden et. Al. (2001) risk is the probability of an event that resulted in losses when the incident occurred during a certain period. According Laksmiwati (2008), the process of risk analysis carried out in several stages that can be described as below:
Save system of work
Identify the occupational safety and health systems in the company. Hazard identification
Identify the situation or condition of any possible danger the risk of harm.
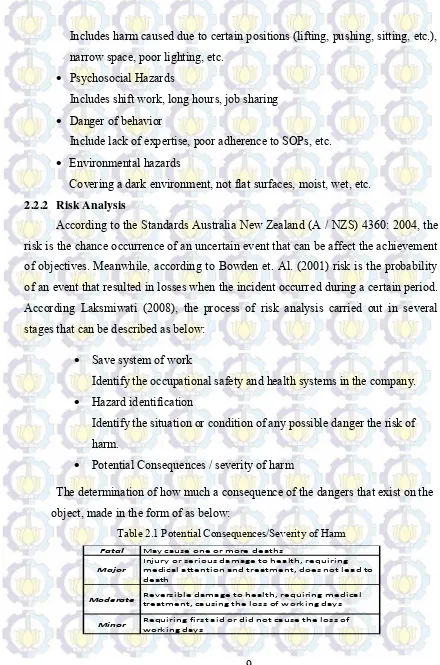
Potential Consequences / severity of harm
The determination of how much a consequence of the dangers that exist on the object, made in the form of as below:
Table 2.1 Potential Consequences/Severity of Harm
Fatal
Requiring first aid or did not cause the loss of working days
Minor
Injury or serious damage to health, requiring medical attention and treatment, does not lead to death
Major
Reversible damage to health, requiring medical treatment, causing the loss of working days
Moderate
10 Likelihood/chance of events actually occuring
Identify the likelihood of an event that are at risk due to hazards that exist, described in the table below :
Table 2.2 Likelihood/chance of events actually occurring
Estimation and presentation
After the identification process, then plotting consequences, likelihood, and hazard maps in order to get the value of a risk assessment code (RAC) as below:
Table 2.3 Estimation and Presentation
Table 2.4 Hazard Map
Score RAC:
1 : Extreme/Imminent danger 4 : Low/minor danger 2 : High/serious danger 5 : Very low/negligible 3 : Medium/moderate danger
Unlikely Highly Unlikely
Very Likely Occurs in most situations, ≥ 16 times /
month or almost every day
Often occurs at a given time, 5 ≤ x ≤ 15
Medium Medium Low Very Low
11
Table 2.5 Hazard Risk Category
2.3 Occupational Health
According to the WHO / ILO (1995), Occupational health aims to improve and maintain the health of the physical, mental and social as high for workers in all types of jobs, prevention of health problems workers caused by working conditions, protection for workers in the work of risk due to factors that are detrimental to health, and the placement and maintenance workers in a working environment adapted to the physiological and psychological conditions. In summary an adjustment to the work of human beings and every human being to a job or position.
Occupational health is defined as a specialization in health sciences / medicine and its practice, so that the community health workers obtain the highest degree, whether physical or mental or social efforts towards preventive and curative diseases or health problems caused by factors employment and working conditions as well as against common diseases (Sumakmur, 1981).
Occupational health requirements in terms of work environment include water, air, waste, lighting, noise, vibration, radiation, disease vectors, health requirements location, space and buildings, toilets and installation (Minister of Health of Indonesia Number 1405/MENKES/SK/XI/2002) .
No
2 High/serious danger Threaten
4 Low/minor danger Moderate
5
Category
Extreme/imminet danger
Medium/moderate danger
1
3
Threaten
Moderate
No need to be considered
12 2.4 Occupational Accidents
Occupational Accidents is an undesirable event that are harmful to humans, damaging property or loss to process. Understanding near miss, in terms of safety referred to the incident, "near-miss" or "near-accident" is an occurrence or unwanted event where the circumstances are a little different will cause harm to humans, damaging property or losses to the process (Direktorat Sarana Prasarana ITB 2009).
According to Suma'mur (1989) the term occupational accidents include all accidents that cause by work and all occupational diseases. An accident caused by an external event that suddenly and unexpectedly, while an occupational disease is caused by the bad influence of time such as by vibration or noise.
Based on the ILO (1998) work accidents arising from or during work can resulted fatal work accidents and accidents that are not fatal. According Rahardjo and Sunarsiah (2008), work accidents can be categorized as: (1) Accidents in the workplace, where the workforce perform the work according to the daily duties. (2) outside the workplace accident, which happened on the way to go or from home to work and vice versa. (3) Occupational diseases, arising from an employment relationship and is seen as a work accidents.
According Safitri (1998) work accidents occurred because of the technological factors, management, and humane. Technology factor is technology and management that used to do production activities within the company. Human factors that is behaviors or poor work habits, and management factors such as procedures related to K3 and poor oversight, including allowing the state less safe.
2.4.1 Classification of Occupational Accidents
13
1. Classification by type of accident, for example, fell, hit by falling objects, pinched by items, the influence of high temperature, electric shock and contact with hazardous materials or radiation
2. Classification by cause
a. Engine: power generation, with the exception of electric motors, the machine dealers, machines for working metal
b. Conveyance or lifting equipment: lifting the machine and equipment, transportation equipment on rails, other wheeled conveyances, except railroad
c. Other equipment: refrigeration installation electrical installations, including electric motors, except electric hand tools, ladders, etc.. d. The materials, substances and radiation: explosives, dust, gases,
liquids and chemicals, with the exception of explosives, radiation, etc.. e. Work environment: outside the building, inside the building, below
ground
f. Other causes that do not include these groups: animals, etc.
3. Classification according to the nature of the injury or disorder, for example broken bones, bruises, amputations, burns and suffocation
4. Classification according to the location of abnormalities or lesions in the body, such as head, neck, materials, members of the top, bottom members, and general disorders
Based on this classification, essentially an accident caused by two groups (Suma'mur, 1981) that is:
1. Based on unsafe human acts 2. Based on unsafe condition
14
Table 2.6 Type of Accident according to Jamsostek
C Tipe Ke ce lakaan
C1 Hit (generally indicate contact or contact with these sharp objects or hard objects resulting in scratched, cut, punctured, etc.)
C2 Beaten (usually due to a fall, glide, float, move, etc.)
C3 Caught in, under, and between objects (pinched, bitten, buried, sinks, etc.)
C4 Fall from the same height C5 Fall from the different height C6 Slip
C7 Exposure (generally related to temperature, air pressure, vibration, radiation, noise, light, etc.)
C8
Inhalation, absorption (showing the entry of hazardous materials or substances into the body, either through breathing or skin and generally cause asphyxiation, poisoning,
suffocation, etc.) C9 Touched electricity C10 etcetera (etc.)
2.4.2 Occupational Accidents Statistics
Many factors that cause occupational accidents. Classification of work accidents is very useful in the investigation of working accidents. In addition it is also a lot of work accidents statistics useful to conduct analysis on the prevention or avoidance so that accidents do not happen again.
The frequency of work accidents is frequency rate of accidents is that often occur or will occur (Permatasari, 2011). To determine the amount or frequency of accidents for every million man-hours using this formula below:
F =many accidents × 1.000.000
number of man − hours
Meanwhile, to measure the severity of an accident can be calculated using the formula:
15
2.5 The Occupational Health and Safety Management
Management Systems Occupational Health and Safety is part of the organization's management system used to develop and implement occupational safety and health policy and manage risks (OHSAS 18001, 2007).
Management Systems Occupational Health and Safety is part of the overall management system which includes organizational structure, planning, responsibility, implementation, procedures, processes and resources needed for application development, achievement, assessment, and maintenance of occupational safety and health policies in order to control the risks associated with work activities in order to create a workplace that is safe, efficient, and productive this all associated with the business organization (Permatasari, 2011). The application of management systems occupational health and safety in the work environment is set in the Regulation of the Minister of Manpower No.PER.05/MEN/1996. The application of management systems occupational health and safety carried out by the board, entrepreneurs, and the entire workforce in one unit. The application of management systems occupational health and safety the company's also reiterated in Pasal 87 UU. NO 13 of 2003 on Employment, which reads: every company should implement safety and health management system shall be integrated into the company's management system. In the Minister of Labour was also mentioned that the company's employees, who has more than 100 employees are required to implement management systems occupational health and safety. The purpose of that is management systems occupational health and safety (Suardi, 2007):
1. As a tool to achieve the health workforce as much as possible, both laborers, farmers, fishermen, or free workers
16
Accordance with annex-1 Permenaker No.05/MEN/1996 there are 5 principles in applying management systems occupational health and safety is as follows:
Principle 1: Commitment and Policy
Companies should define occupational safety and health policies and ensure commitment to SMK3
Principle 2: Planning
Companies should plan to achieve policies, aims and objectives occupational safety and health
Principle 3: Application of
So that the effective implementation of management systems occupational health and safety then companies need to develop the capabilities and support mechanisms necessary to achieve the policies, goals, and objectives occupational safety and health
Principle 4: Measurement and Evaluation
Companies must measure, monitor, and evaluate the performance of the company as well as the occupational safety and health in preventive and corrective actions
Principle 5: A review by The Management and Improvement
Companies need to routinely review and continuously improve management systems occupational health and safety, with the goal of improving the performance of occupational safety and health
Successes in the Permenaker 50/MEN/1996 in a company can be measured as below (Suardi, 2007):
a. For the application of 0-59% and the rate of application of regulation violation (nonconformance) subject to legal action
17
c. For the application of 85-100% level of achievement awarded gold flag certificate
2.6 FMEA (Failure Mode and Effect Analysis)
FMEA (failure mode and effect analysis) adalah a structured procedure to identify and prevent as much as possible modes of failure (failure mode). FMEA is used to identify the sources and root causes of quality problems. A failure mode is what is included in a design defect or failure, a condition beyond the limits established specifications, or changes in the the product that causes the disruption of the function of the the product.
There are two the use of FMEA that are in the design (Design FMEA) and the process (Process FMEA). Design FMEA will help eliminate the failures associated with the design, such as power failure improper, incompatible materials, and others. FMEA process will eliminate failures caused by changes in process variables, such conditions beyond the limits specified as improper size, texture and color that does not match, the thickness of which is not right, and others. This research using the method of Process FMEA.
According to Roger D. Leitch, the definition of failure modes and effect analysis is an analysis technique that when done right and the right time will give you a great value in helping the process of decision-making for engineer during the design and development. The analysis called analysis of "bottom up", as examined at the beginning of the production process and considering the failure rate of the system is the result of a whole different kind of failure.
2.6.1 Purposes of Failure Modes and Effect Analysis
There are several purposes of this method, among others:
18
2. Predict and evaluate the impact from failures on the functionality of existing systems.
3. Indicate priorities for improving a process or sub-system through the list of improved processes or sub-systems that must be repaired.
4. Identify and establish corrective actions can be taken to prevent or reduce the chances of failure or potential impact on the system.
5. Documenting the process as a whole
2.6.2 The Basic Step of FMEA
There is a fundamental step in the process FMEA is carried out by a team of design for six sigma (DFSS) is:
1. Building a process limits that the process is limited by the structure.
2. Build processes that describe the mapping from FMEA complete production process and the interface level in the hierarchical structure of the process and scope.
3. Looking at the structure of the process at all levels of hierarchy in which each design parameter is defined.
4. Identification of potential failure in each process. 5. Learn the cause of the failure from its influence.
2.6.3 Determine Severity, Occurrence,Detection and RPN
To determine the priority from a failure of the FMEA form should define in advance of Severity, Occurrence, Detection, and the end result is a Risk Priority Number.
Severity
19
Table 2.7 Range of Severity
Rating Criteria
1 Negligible severitythink that this result will have an impact on product performance. End (bad influences can be ignored). We do not need to users probably will not fix this defect.
2-3 Mild severityusers will not feel any changes in performance. Repairs can be done (minor bad influences). The impact caused only mild. End during regular maintenance.
4-6 Moderate severitydecrease in performance, but still within tolerable limits. Recovery was (moderate bad effect). End users will experience a not expensive and can be completed in a short time.
7-8 High severityconsequences will not be accepted, is outside the tolerance limits. Repairs (the high bad influence). End users will feel the negative are carried out very expensive.
9-10 Potential safety problem (potential safety problems). Very dangerous
consequences and affect the safety of the user. Contrary to the the law (Source: Gaspersz, 2002)
Occurrence
Occurrence is the possibility that the cause will occur and result in the form of failures during the product usage. By estimating the occurrence probability on a scale of 1 to 10.
Table 2.8 Range of Occurrence
Rating Criteria
1 The probability of single disorder mode < 0,001 from the overall probability of interference during operation
2-3 The probability of single disorder mode> 0,001 tetapi < 0,01 from the overall probability of interference during operation
4-6 The probability of single disorder mode > 0,01 tetapi < 0,10 dari probabilitas keseluruhan terjadinya gangguan selama masa pengoperasian
7-9 The probability of single disorder mode > 0,10 tetapi < 0,20 from the overall probability of interference during operation
10 The probability of single disorder model > 0,20 from the overall probability of interference during operation
(Source: Vincentz, 1992) Detection
20
Table 2.9 Range of Detection
Rating Criteria
1 The method of prevention is very effective . There is no chance that the cause may appear. 2
The possible causes occur is very low. 3
4
Possible causes occur is moderate. Prevention methods allow cause it occur sometimes.
5 6
7 Possible causes occur is still high. Prevention methods are less effective, cause still repeated.
8
9 Possible causes occur very high. Prevention methods are not effective, the cause is always recurs back.
10
(Source: Gaspersz, 2002)
Risk Priority Number
RPN is a mathematical the product from the seriousness of the effects (Severity), the possibility of a cause will lead to failure-related effects (Occurrence), and the ability to detect failures before they occur on the customer (Detection). RPN can be shown by the following equation:
RPN = S * O * D
This number is used to identify a serious risk, as clues to the corrective action.
2.7 Process Mapping
21 1. Block diagram
2. The American National Standart Insitute (ANSI) stadart flowcharting 3. Functional flowchart
4. Geographic flowchart
Process mapping is a flowchart that illustrates the work flow of such activities, information, and materials in a process. Process mapping in the research using functional flowchart. Functional flowchart identifies how the functions from the department affecting vertical horizontal process flow within an organization (Harrington, 1991). Excellence using mapping process is as below (The CPS Incorporate RCPO):
1. Describes the flow of materials, information and documents 2. Show that there is a role in a variety of tasks based process 3. Shows the decisions made throughout the process chain
4. Shows the relationship between the interests of actors in the process and dependencies between processes
22
Figure 2.1 Process Mapping Symbols
Description:
Process : denotes an action performed by a computer Start or end : declare the beginning or ending of a process
Decision : indicate a certain condition that would result in two possible answers yes or no
Arrow : stated course of a process flow
Document : print the output in the form of documents System activity : declare a particular activity
On-page Connector : declare the connection from the process to the same page
Off-page Connector : declare the connection from the process to the different pages
23 2.8 Nordic Body Map (NBM )
By using Nordic body map (NBM), it can be estimated the type and level of skeletal muscle complaints perceived by workers (Tarwaka; Bakri. S; Sudiajeng. L, 2004). There are 27 body segments representing the whole body will be selected by the respondent on which parts have complaints.
Figure 2.2 Nordic Body Map
(Source: Tirtayasa et al, 2003 in Devi, 2011 and Corlett, 1992 in Tarwaka et al, 2004)
To know the pains, suffered a long illness, the consequences of illness, and the amount of time lost can be determined by using the Standardize nordic questionnaire (Kaewbooncho et al, 1998 in Devi, 2011) such as in the table below::
1 Sakit pada leher 2 Sakit pada bahu kiri 3 Sakit pada bahu kanan 4 Sakit pada lengan atas kiri 5 Sakit pada punggung 6 Sakit pada lengan atas kanan 7 Sakit pada pinggang 8 Sakit pada pinggul 9 Sakit pada pantat 10 Sakit pada siku kiri 11 Sakit pada siku kanan 12 Sakit pada lengan bawah kiri 13 Sakit pada lengan bawah kanan 14 Sakit pada pergelangan tangan kiri 15 Sakit pada pergelangan tangan kanan 16 Sakit pada tangan kiri
17 Sakit pada tangan kanan 18 Sakit pada paha kiri 19 Sakit pada paha kanan 20 Sakit pada lutut kiri 21 Sakit pada lutut kanan 22 Sakit pada betis kiri 23 Sakit pada betis kanan 24 Sakit pada pergelangan kaki kiri 25 Sakit pada pergelangan kaki kanan 26 Sakit pada kaki kiri
27 Sakit pada kaki kanan
24
Table 2.10 Level of exhaustion
1 2 3 4 5
1 Pain in the neck 2 Pain in the left shoulder 3 Pain in the right shoulder … …
27 Pain in the right feet
No. Location Level of Fatigue
Description:
1 : Not very pain 4 : Pain 2 : No pain 5 : Very pain 3 : A little pain
Table 2.11 Pain Complaints time
1 2 3 4 5
1 Pain in the neck 2 Pain in the left shoulder 3 Pain in the right shoulder … …
27 Pain in the right feet
Pain Complaints time
Table 2.12 Consequences of Occupational
No. Location
1 2 3 4 5
1 Pain in the neck 2 Pain in the left shoulder 3 Pain in the right shoulder … …
27 Pain in the right feet
Consequences of Illness
Description:
1 : not Influential
2 : There was reduction in work activities comfort 3 : Reduce the types of work activities
25 5 : Must replace workers
Table 2.13 Total Lost Work Time Due to Pain
No. Location
1 2 3 4 5
1 Pain in the neck 2 Pain in the left shoulder 3 Pain in the right shoulder … …
27 Pain in the right feet
Total Lost Work Time Due to Pain
Description:
1 : 0 days 4 : 11-15 days 2 : 1-5 days 5 : > 15 days 3 : 6-10 days
2.9 Quick Exposure Checklist (QEC)
Quick Exposure Checklist (QEC) is a method used to evaluate body postures and movements that include the back, shoulders, arms, and neck. QEC method provides a four-level to evaluate body posture (David et al, 2007 in Devi, 2011). Advantages of QEC method compared with other methods that is (Guangyan Li and Buckle, 2005 at the Devi, 2011):
1. Includes several major risk factors of work related musculoskeletal disorders (WMSDs)
2. Consider the needs of the user and can be used by people who have not experienced
3. Consider the interaction of a combination of multiple risk factors of workplace
4. Has good sensitivity and usability 5. Easy to learn and easy to use
26
1. Stage 1: Development of methods for recording work postures
Parts of the body will be divided into segments which form seven groups A-G. This is done to ensure that all posture is recorded, so that any restriction by back or neck posture which may affect the posture of the upper body can be included in the assessment.
Group A: assessment for back posture (A1-A3)
Assessment for back posture should be made when the backs suffered heavy loads, such as bowing.
A1 : back is considered normal or almost neutral when the movement of people working with the angle of flexion / extension, turning your back or bowing is less than 200, as shown in Figure A1.
Figure 2.3 A1 (Normal Back/Almost Neutral)
A2 : Backs are considered moderate or moderately flexed or twisted when the movement of people working with the angle of flexion / extension, twist or bowing your back more than 200 but less than 600, as shown in Figure A2.
27
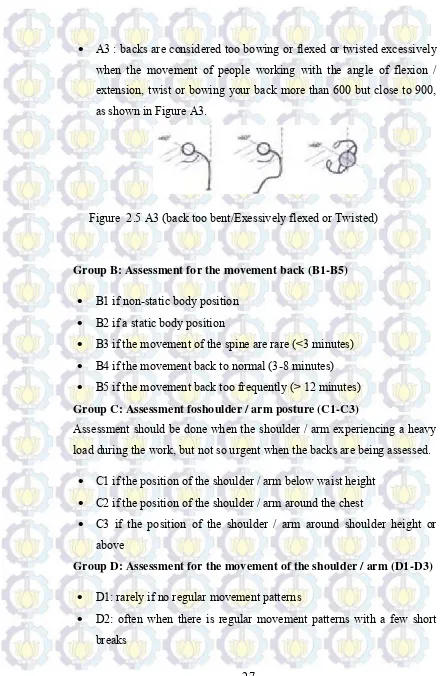
A3 : backs are considered too bowing or flexed or twisted excessively when the movement of people working with the angle of flexion / extension, twist or bowing your back more than 600 but close to 900, as shown in Figure A3.
Figure 2.5 A3 (back too bent/Exessively flexed or Twisted)
Group B: Assessment for the movement back (B1-B5) B1 if non-static body position
B2 if a static body position
B3 if the movement of the spine are rare (<3 minutes) B4 if the movement back to normal (3-8 minutes) B5 if the movement back too frequently (> 12 minutes) Group C: Assessment foshoulder / arm posture (C1-C3)
Assessment should be done when the shoulder / arm experiencing a heavy load during the work, but not so urgent when the backs are being assessed.
C1 if the position of the shoulder / arm below waist height C2 if the position of the shoulder / arm around the chest
C3 if the position of the shoulder / arm around shoulder height or above
Group D: Assessment for the movement of the shoulder / arm (D1-D3) D1: rarely if no regular movement patterns
28
D3: very often when there is continuous movement patterns during working
Group E: Assessment for hand / wrist posture (E1-E2)
Assessment carried out during a bad job positions including flexion / extension, ulnar deviation / radial, and rotation of the forearm through the wrist.
E1 : The wrist is considered too straight / almost straight when the limited movement of less than 150 normal posture as in the Figure E1.
Figure 2.6 E1 (Wrist always straight/Almost Straight)
E2 : Considered wrist bends / deviant or deviated / bent when the movement of more than 150 normal posture as in picture E2.
Figure 2.7 E2 (Wrists bent / Deviant atau Deviated/bent)
29
A hand movement of the hand / wrist and arm, including the movement of the finger. Every movement is calculated each time the same pattern and repeated over a period such as one minute.
F1 if the movement of the hand <10 minutes
F2 if the movement of the hand between 11-20 times per minute F3 if the movement of the hands> 20 times per minute
Group G: Assessment for neck posture (G1-G3) G1 if the position of the neck is not bent G2 if sometimes down the neck position
G3 if the position of the neck is often looked down
Assessment of workers in the same job
After the assessment, workers were asked to answer further questions as indicated on the second page of the tool QEC and accompanied by explanations when needed.
Calculation of the total assessment score
Of the total assessment score can be obtained with a combination of ratings from observers (A-G) and workers (a-e). Make sure that the combination of scores had been determined before summing.
2. Stage 2: Development of a scoring system for grouping parts of the body
From the grouping determined posture A-G group scores for each posture. Then the scores are included in the assessment scores (exposure score) to obtain a total score
3. Stage 3: Development of a scale that measures the level of risk levels and provides guidance needs action
30
the activity so immediate repair method / job movement in the body segments that are harmful to reduce the occurrence of accidents or injuries.
Table 2.14 Preliminary Action Level QEC
QEC Action Scale
≤ 19.2 Acceptable 2-3
19.3-24 Investigate further 4-5
24.1-33.6 Investigate further and change soon 6-7
≥ 33.6 Investigate and change immediately 7+
Back
QEC Action Scale
≤ 20 Acceptable 2-3
20.1-25 Investigate further 4-5
25.1-35 Investigate further and change soon 6-7
≥ 35 Investigate and change immediately 7+
Shoulder/Arm
QEC Action Scale
≤ 18.4 Acceptable 2-3
18.5-23 Investigate further 4-5
23.1-32.2 Investigate further and change soon 6-7
≥ 35 Investigate and change immediately 7+
Hand/Wrist
QEC Action Scale
≤ 7.2 Acceptable 2-3
7.3-9 Investigate further 4-5
9.18-12.6 Investigate further and change soon 6-7
≥ 12.6 Investigate and change immediately 7+
Neck
QEC Action Scale
≤ 64.8 Acceptable 2-3
64.9-81 Investigate further 4-5
81.1-113.6 Investigate further and change soon 6-7
≥ 113.4 Investigate and change immediately 7+
Total
31 2.10 Root Cause Analysis (RCA)
To prevent the occurrence of accidents is not enough to just pay attention to unsafe occurrence that could lead to accidents (Reason, 1990), but also should do a search for the cause of the accident. So by knowing the factors that can lead to accidents, to minimize the occurrence of accidents. The method can be used to determine the causes and consequences of these accidents is the Root Cause Analysis (RCA).
RCA is a method used to solve a problem which aims to identify the root cause of a problem or an event can occur. Elements on RCA consists of a variety of reasons. In the final task Permatasari (2011) argued that the elements in the RCA are as follows:
a. Materials, ie raw material defects, wrong type of workers and the lack of raw materials
b. Machinery or equipment, for example, the wrong tool, lack of maintenance, lack of equipment or tool placement, and equipment damaged
c. Environment, for example workplace untidy, poorly maintained workplace, and layout
d. Management, for example, the lack of management involvement, lack of attention to the task, and the task is dangerous not maintained properly
e. Methods, for example the lack of a procedure, lack of communication, and practice in the field is not in accordance with the procedures
f. Management system, for example, lack of training, lack of employee involvement, and lack of education on the dangers
In the final project, Ikasari (2012) states that in conducting the RCA there are 4 steps that must be done. Here are the steps in conducting RCA:
32
At this stage, a complete data collection so that can know the causes and the root cause of the problem
2. Causal factors charting
This diagram is intended to describe a structure for investigators in organizing and analyzing information gathered.
3. Identify the root causes of
At this step will be to identify the cause of all causes (causal factors) so that it can be seen why the causal factors may occur. Diagrams used in conducting the identification using the Root Cause Map.
4. Recommendation and implementation
The final step is to make recommendations from each root cause.
2.11 Review of Previous Research
This research was supported by several previous research. Reviews conducted relating to safety and accident using Root Cause Analysis method and other methods.
1. Hanum, L (2007), Measurement Level Implementation and Risk Analysis Occupational Safety and Health in PT.DOK Shipping.
This research will measure how high the level of implementation of occupational safety and health in PT.Dok and analyzing occupational hazards that may occur and then hazard ranking carried by using a risk assessment. Subsequently determined how preventive and corrective actions to reduce the risk of hazard to workplace accidents.
33
In this research work system improvements with two approaches, namely workload and human error. Calculation of physical workload with QEC method.
3. Permatasari (2011) Identification of Causes Occupational Accidents Using Root Cause Analysis on Construction Project Mall Ciputra Surabaya ".
In this research to identify the causes of accidents on construction projects. The research was conducted based on the company's risk assessment. Researchers using Root Cause Analysis with Event Tree approach used to identify risks and provide risk prevention measures.
34
35 CHAPTER III
RESEARCH METHODOLOGY
Scientific research requires a framework or methodology of the research study before implementation. This research method provides systematic research steps used in conducting the research. These stages are used as a frame of reference for the research process running in a systematic, structured and purposeful, and guiding research to achieve predetermined objectives.
3.1 Preliminary Phase
At the preliminary phase will be divided into several phases in conducting research. Preliminary phase consists of identifying the problem, goal setting research, literature studies, and field studies.
3.1.1 Problems Identification
At this phase the identification of the problems that occurred in the research place as an object of observation. An observed object that is under investigation in this case was on PT. International Chemical Industry. The issues rise regarding the ergonomic assessment and identify the causes of workplace accidents.
3.1.2 Research Objective Setting
36 3.1.3 Literature Study
Literature studies used to support the research on occupational safety and health (K3), Failure Mode and Effect Analysis (FMEA), Nordic Body Map (NBM), Quick Exposure Checklist (QEC), Root Cause Analysis, and process mapping. Literatures used are taken from text books, journals, the internet and the final project.
3.1.4 Field Study
The field study was conducted to determine the existing condition related to the research company. Field of study will obtain information about the employment situation in enterprises and data necessary to carry out the research. Field studies had conducted by interview, observation of observed objects, and through questionnaires.
3.2 Data Collection Phase
At this phase of data collection will be done relating to problems under study. The data retrieved are divided into two parameters, namely primary data and secondary data. Primary data obtained by conducting interviews and questionnaires to employees, parts management, and stakeholders associated with the incidence of work accidents. Interview foremost to the safety engineering as a person who knows how to apply health and safety measures and what to do when accidents happen. While the secondary data obtained from historical data. Secondary data needed include risks that occur in the work environment.
3.3 Data Processing phase
37 3.4 Data Analysis and Interpretation Phase
At this phase about the analysis and data processing problems has been done. From this analysis are expected to know the things that need to be fixed and given special attention by the company so that recommendations for improvements that can be implemented given appropriate.
3.5 Conclusions and Recommendations Phase
At this phase contains the conclusion of research conducted as well as helpful suggestions for further research. Flowchart
START
- K3 - SMK3
- Failure Mode and Effect Analysis - Process Mapping
- Nordic Body Map - Quick Exposure Checklist
- Root Cause Analysis
Literatures Study
- General description of the Company
- Direct observation of the processes that occur in the production section - Interviews with safety engineer and the stakeholders in the company
Field Study
Preparation Phase Problem Definition
Objective Setting Research
38
DATA PROCESSING PHASE
1. Analysis of working conditions 2.Analysis of the causes of workplace accidents
3. Risk Analysis 4. Analysis of Occupational Sick
DATA ANALYSIS AND INTERPRETATION
COCNCLUSION AND RECOMMENDATION
FINISH
DATA COLLECTION AND PROCESSING PHASE DATA COLLECTION
ANALYSIS AND INTERPRETATION OF DATA PHASE
CONCLUSIONS AND RECOMMENDATIONS PHASE 1.Identify occupational pains experienced by workers
Nordic Body Map (NBM)
Data Primer: 1. Interview 2. Questionnaire
Secondary Data: 1. Occupational Accidents Data
1. Identify the problem that causes of accidents based on questionnaires
Root Cause Analysis
1. Identify occupational illness suffered by workers based on questionnaire QEC
Quick Exposure Checklist (QEC)
1. Identify and define the potential hazard in the production process
Failure Mode and Effect Analysis
39
4
CHAPTER IV
5
DATA COLLECTING AND PROCESSING
In this chapter IV, will be collecting data and also data processing from PT. International Chemical Industry.
4.1 Data Collecting
On data collection, there are two types of data: primary data and secondary data. Primary data obtained directly using questionnaires or interviews, and secondary data was obtained from the data supporting historical data from company.
4.2 Company Profile
PT. Hari Terang Industry is manufacturing companies in the country which produce dry battery brands ABC with international quality standards, located at Jln. Industry Rungkut II/12 Surabaya. The company is a development from previous two battery factories, which are in Medan and Jakarta.
It is starting from the construction of the first ABC battery plant in Medan in 1959 by Chandra Djojonegoro and Chu Sok Sam with the name of PT. Everbright Battery Factory. In 1968, it under the name PT. International Chemical Industrial. To fulfill the needs of ABC battery products domestic market and abroad which is increasing, then built a factory in Surabaya with the name of PT. Hari Terang Industry (d / h PT. Hari Terang Industrial Co.., Ltd.) which has been operating since 1982.
40
Standard 86-1/86-2 (1993), C.181-1986 ANSI, JIS C.8501-1993, SNI 04-2051-1990.77.
Since the 1980s ABC batteries have mastered 70% of the domestic market. One of the strengths of this battery is a powerful distribution as held by PT. Artha Boga Shining (ABC) and had 72 points in the distribution network throughout Indonesia. ABC battery is also exported to more than 50 countries using 70 different brands, except for Australia and some African nations that use ABC brand and Alkaline. Exports are able to contribute up to 40% from total revenue.
PT. International Chemical Industry Plant 1 produces carbon-zinc batteries and battery alakaline. The products of PT. International Chemical Industry Plant 1 ABC branded or customer orders. PT. International Chemical Industry Plant 2 produces 3 types of carbon-zinc batteries, the green battery type R20 ABC, ABC Blue Batteries and ABC blue Battery R6. The products are marketed under ABC brands including such as:
ABC Rechargeable Battery ABC Alkaline
ABC heavy Duty 9 Volt (battery box)
ABC Super Power / Super Extra Heavy Duty (Black) ABC New Special / Extra Heavy Duty (Red)
ABC Super Electric / Heavy Duty (Gold) for export market ABC Standard (blue)
ABC Standard (green) ABC Standard (yellow)
41
4.2.1 Visions and Company Policy
Company Visions is: 'Being a manufacturer of dry batteries with the international quality standard with environmentally friendly process that is managed effectively and efficiently so as to increase the competitiveness of local and global market.
While the Quality Policy and the Environment: PT International Chemical Industry and PT. Hari Terang Industry is a national private company that manufactures dry battery ABC brand of high quality and famous brands in accordance with customer demand, committed:
1. Implement the Quality Management System according to Standard ISO 9001:2000 and Environmental Management System according to ISO 14001:2004 standards effectively and efficiently;
2. Perform continuous improvement through quality objectives and measurable environmental programs in every department;
3. Give satisfaction to customers and other stakeholders both in terms of quality, price, delivery, and service;
4. Comply with legislation and other requirements relevant to aspects of the company's activities;
5. Preventing environmental pollution from the aspect of its activities, products or services related to the company;
6. Make savings of resources that include labor efficiency, electricity, water, and fuel oil.
Visions and policies are documented, communicated to all personnel and other related parties, and open to the public (Managing Director, October 2005).
4.2.2 Mission and Objectives of the Company
Mission PT. Hari Terang Industry in general is directing the actions to achieve the delivery of services and benefits to the community. The objectives are: