P-ISSN 1979-0201, e-ISSN 2549-6212 Available from:http://jurnal.unpad.ac.id/pjd/article/view/16232
DOI: https://doi.org/10.24198/pjd.vol30no1.16232 Submission: Dec 2017 Publishing: Mar 2018
The healthy eating plate and periodontal health knowledge
in undergraduate students of faculty of dentistry Universitas
Padjadjaran
Janti Rusjanti*, Salma Kamila Solihati*, Cucu Zubaedah**
*Department of Periodontics Faculty of Dentistry Universitas Padjadjaran, Indonesia **Department of Community Dentistry Faculty of Dentistry Universitas Padjadjaran, Indonesia
ABSTRACT
Introduction: Periodontal disease is a multifactorial disease that attacks periodontal tissue caused by
bacterial plaque and calculus, and also nutritional deiciency. Applying a healthy dietary habit will be able to prevent the occurrence of periodontal disease. The purpose of this study was to discovered description of the Healthy Eating Plate habit and periodontal health knowledge in undergraduate students of Faculty of Dentistry Universitas Padjadjaran. Method: This research was quantitative with two questionnaire instruments; the irst contained the food variety and the proportion consumed by respondents, and the second contained questions regarding the periodontal health. The samples were as much as 137 undergraduate students of Faculty of Dentistry Universitas Padjadjaran batch 2015, taken with an accidental random sampling technique. Results: The nutritional proportion of all respondents were as follows: at breakfast, 27.5% of carbohydrate, 25.1% of protein, 24.3% of vegetables, and 23.4% of fruits; at lunch, 29.1% of protein, 27.1% of carbohydrates, 19.8% of vegetables, and 24.4% of fruits; at dinner, 27% of protein, 23% of carbohydrate, 20.9% of vegetables, and 20.1% of fruits. The level of periodontal knowledge was 68.94%. Conclusion: The respondent’s dietary habit was close enough to the indicators of the Healthy Eating Plate, with a moderate level of periodontal health knowledge.
Keywords: Healthy eating plate, periodontal disease, healthy eating pattern
INTRODUCTION
Periodontal disease is a disease associated with periodontal tissues such as gingiva, cementum, periodontal ligament, and alveolar bone. There are two kinds of periodontal diseases: gingivitis
and periodontitis.1 Gingivitis is an inlammation
of the gingiva caused by plaque accumulation in the supragingival and subgingival. When the gingivitis is left untreated, it will develop a periodontitis.2 Periodontitis is an inlammatory
condition in the periodontal tissues which can
lead to progressive destruction of the periodontal ligament and alveolar bone through the formation of periodontal pockets, recessions, or both.3
Periodontal disease is a dental and oral
health problem with a quite high prevalence. At least 50% of the human population may devel
-op a form of periodontal disease.3 In Indonesia,
the prevalence of periodontal disease is 96.58%.4
The Indonesian Dental Association (PDGI) states that the prevalence of gingivitis worldwide is 75-90% with moderate category reaching 75%, while
the prevalence of chronic periodontitis in adults
around the world is 30- 35%.5
The inlammatory process of the gums and periodontal tissues is directly afected by the bac
-terial plaque in the supragingival and subgingival margin areas. While indirectly it is caused by some factors, such as smoking habits, systemic disease
conditions, and periodontal tissue resistance to
infection which depends on the nutritional status.6
The knowledge in maintaining a healthy diet is necessary for the society. Knowledge is the result of “knowing”, and it happens after people have sensed certain objects. The knowledge of Indonesian people in maintaining the diet remains low. As many as 93.5% of the population over ten years consumes fewer vegetables and fruits, and the consumption of high-sugar, high-salt, and high-fat of foods and beverages in both urban and rural communities are high.7 One way for people
to practice a healthy diet is providing education regarding healthy eating guidelines to eat a balanced diet.8 Healthy eating plates (HEP) was
released by the Harvard School of Public Health
in 2011. Evidently, implementing a healthy diet can prevent periodontal disease. A study showed individuals who keep their diet healthy are less likely to have periodontal disease than those who don’t.9 As the students who study in the dental
university, they are expected to have known HEP and understand more about periodontal health. The study was to observe the level of knowledge on
HEP diet and periodontal health in dental students of Faculty of Dentistry Universitas Padjadjaran
(Unpad).
METHODS
Jatinangor campus. Population in the research was dental students class of 2015. The sampling technique was done by accidental random two questionnaires which have been tested for validity and reliability. The questions were
about the variety of food and the proportion of
meals consumed by the respondents, as well as periodontal health knowledge.
Assessment of knowledge was done by providing questionnaires regarding the knowledge of HEP diet and gingival health. The evaluation of gingival health knowledge was done by using the Guttman scale which allowed the subject to give a irm answer, true or false, with a true representing a value of 1 and false is 0.(Sugiyono, 2012). The data were calculated according to the Binomial Distribution formula.
The data were then presented in the frequency distribution table with the evaluation of each domain grouped into three categories: good, moderate, and poor with details as follows (Arikunto, 2013) : good for the percentage of the right answers ranged between 76% - 100% of the total questions; moderate for the percentage of the right answers ranged between 56%-75% of the total questions; poor for the percentage of the right answers ranged between 40%-55% of the total questions.
Measurement of knowledge on HEP diet was done by asking the respondents to ill in the questionnaire forms. The questions were mainly about the types of food which recommended and good for the body, foods that should be avoided to maintain health, and the exercise frequency. The assessment was done by using the Guttman scale. The measurement scale used was the ordinal scale with the value of 1 for the right answer, and 0 for the wrong answer or abstain. The data were grouped into two categories, the corresponds and not corresponds to HEP diet, which will describe the knowledge of the subjects on the dietary programme. The research has been approved
The research instruments should be standardised according to the validity and reliability test criteria. These tests are the evaluation which indicates the reliability and consistency of a measuring instrument over time. The goal is to sort the valid and invalid data. Only the valid one will be used and analysed in this study.
Validity test is required for the knowledge
instrument survey in the form of dichotomy score,
which is 0 and 1. We used the Biserial Correlation formula to test the validity of the data.
The reliability coeicient calculation technique used in this research was the reliability coeicient of Kuder-Richardson (KR-20). The method describes the variation of answers from true or false statements scored 1 or 0 (Guilford and Benjamin, 1978). The reliability test is calculated using the Kuder–Richardson Formula 20. All data were analysed descriptively, and presented in the form of table and graph.
RESULTS
The knowledge of HEP dietary program and
periodontal health in dental students of Faculty of
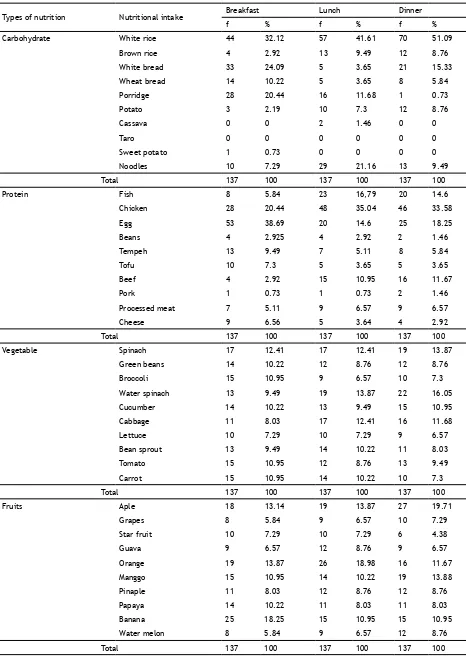
Dentistry Unpad were presented in Table 1-4. Table 1 informed the daily carbohydrate, protein, vegetable, and fruit intakes. The most
popular carbohydrates consumed by the students
during breakfast were white rice (32.12%), white bread (20.09%), and porridge (20.44%). The percentage of carbohydrates consumed during lunch was white rice with 41.61%, noodles 21.16%, and porridge 11.68%, while during dinner white rice was still the highest consumed with a percentage of 51.09%, white bread 15.33%, and noodles 9.49%.
The most consumed proteins at breakfast were egg (38.69%), followed by chicken (20.44%), and tempeh (9.49%), while at lunch the highest consumed proteins were chicken (35.04%), egg (14.6%), and beef (10.95%). At dinner, the most consumed proteins were chicken (33.58%), egg (18.25%), and last one was ish (14.6%).
All 137 respondents consumed spinach the most during breakfast with the percentage of 12.41%, followed by broccoli, tomato, and carrot
with the same percentage of (10.95%), and green beans and cucumber with the percentage of 10.22%. At lunch, the most consumed vegetables water spinach (13.87%), cabbage and spinach (12.41%), followed by bean sprout and carrot (10.22%). Meanwhile at dinner, the most consumed vegetables were water spinach (16.05%), spinach (13.87%), and cabbage (11.68%).
In the morning, the subject consumed top three fruits, which were banana (18.25%), orange (13.87%), and apple (13.14%). During lunch, orange was the most consumed fruit (18.98%), followed by apple (13.87%), and banana (10.95%). While at dinner subject consumed more apple with a percentage of 19.71%, followed by mango (13.88%), and orange (11.67%).
Table 2 presented the nutritional proportion
in breakfast, lunch, and dinner taken by all
respondents. The percentage of the subject who chose to have more carbohydrates was as much as 12.04%, and the percentage of the subject chose to have a same proportion of proteins was 11.31%. The percentage of subject chose to eat less proportion of vegetables at breakfast was 10.95%, and the percentage of the subject chose to have least fruits was 10.77%.
The subject’s lunch proportion in a plate showed the percentage of respondents chose more carbohydrates were 12.77%, the same proportion of proteins was 13.69%, the fewer vegetables was 9.31%, and the least fruits was 3.10%.
The dinner proportion on one plate showed more proportion of carbohydrates were 10.77%;
the subjects chose proteins in the same amount
were 12.59%, the subjects chose less amount of vegetables were 9.85% and chose fruits in the least amount were 9.49%.
There were 61 out of 137 subjects grouped in a moderate category regarding the knowledge in periodontal health, or as much as 44.5% (Table 8).
Types of nutrition Nutritional intake Breakfast Lunch Dinner
f % f % f %
Carbohydrate White rice 44 32.12 57 41.61 70 51.09
Brown rice 4 2.92 13 9.49 12 8.76
White bread 33 24.09 5 3.65 21 15.33
Wheat bread 14 10.22 5 3.65 8 5.84
Porridge 28 20.44 16 11.68 1 0.73
Potato 3 2.19 10 7.3 12 8.76
Cassava 0 0 2 1.46 0 0
Taro 0 0 0 0 0 0
Sweet potato 1 0.73 0 0 0 0
Noodles 10 7.29 29 21.16 13 9.49
Total 137 100 137 100 137 100
Protein Fish 8 5.84 23 16,79 20 14.6
Chicken 28 20.44 48 35.04 46 33.58
Egg 53 38.69 20 14.6 25 18.25
Beans 4 2.925 4 2.92 2 1.46
Tempeh 13 9.49 7 5.11 8 5.84
Tofu 10 7.3 5 3.65 5 3.65
Beef 4 2.92 15 10.95 16 11.67
Pork 1 0.73 1 0.73 2 1.46
Processed meat 7 5.11 9 6.57 9 6.57
Cheese 9 6.56 5 3.64 4 2.92
Total 137 100 137 100 137 100
Vegetable Spinach 17 12.41 17 12.41 19 13.87
Green beans 14 10.22 12 8.76 12 8.76
Broccoli 15 10.95 9 6.57 10 7.3
Water spinach 13 9.49 19 13.87 22 16.05
Cucumber 14 10.22 13 9.49 15 10.95
Cabbage 11 8.03 17 12.41 16 11.68
Lettuce 10 7.29 10 7.29 9 6.57
Bean sprout 13 9.49 14 10.22 11 8.03
Tomato 15 10.95 12 8.76 13 9.49
Carrot 15 10.95 14 10.22 10 7.3
Total 137 100 137 100 137 100
Fruits Aple 18 13.14 19 13.87 27 19.71
Grapes 8 5.84 9 6.57 10 7.29
Star fruit 10 7.29 10 7.29 6 4.38
Guava 9 6.57 12 8.76 9 6.57
Orange 19 13.87 26 18.98 16 11.67
Manggo 15 10.95 14 10.22 19 13.88
Pinaple 11 8.03 12 8.76 12 8.76
Papaya 14 10.22 11 8.03 11 8.03
Banana 25 18.25 15 10.95 15 10.95
Water melon 8 5.84 9 6.57 12 8.76
Total 100 100 100
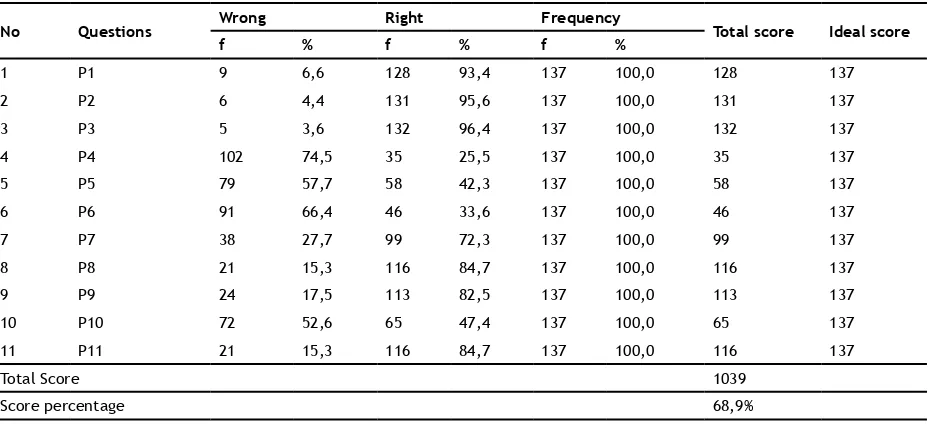
No Periodontal health knowledge Frequency Percentage
1 Poor 32 23,4
2 Moderate 61 44,5
3 Good 44 32,1
Total 137 100,0
No Questions Wrong Right Frequency Total score Ideal score
f % f % f %
1 P1 9 6,6 128 93,4 137 100,0 128 137
2 P2 6 4,4 131 95,6 137 100,0 131 137
3 P3 5 3,6 132 96,4 137 100,0 132 137
4 P4 102 74,5 35 25,5 137 100,0 35 137
5 P5 79 57,7 58 42,3 137 100,0 58 137
6 P6 91 66,4 46 33,6 137 100,0 46 137
7 P7 38 27,7 99 72,3 137 100,0 99 137
8 P8 21 15,3 116 84,7 137 100,0 116 137
9 P9 24 17,5 113 82,5 137 100,0 113 137
10 P10 72 52,6 65 47,4 137 100,0 65 137
11 P11 21 15,3 116 84,7 137 100,0 116 137
Total Score 1039
Score percentage 68,9%
Eating plate Nutritional proportion Carbohydrates Proteins Vegetables Fruits
f % f % f % f %
Breakfast More amount 66 12.04 29 5.29 18 3.28 23 4.20
Same amount 37 6.75 62 11.31 26 4.74 17 3.10
Less amount 14 2.55 28 5.11 60 10.95 38 6.93
Least amount 20 3.65 18 3.28 33 6.02 59 10.77
Total 137 25.00 137 25.00 137 25.00 137 25.00
Lunch More amount 70 12.77 32 5.84 21 3.83 21 3.83
Same amount 31 5.66 75 13.69 37 6.75 15 2.74
Less amount 16 2.92 20 3.65 51 9.31 38 6.93
Least amount 20 3.65 10Br 1.82 28 5.11 63 11.50
Total 137 25.00 137 25.00 137 25.00 137 25.00
Dinner More amount 59 10.77 29 5.29 20 3.65 31 5.66
Same amount 25 4.56 69 12.59 32 5.84 21 3.83
Less amount 26 4.74 23 4.20 54 9.85 33 6.02
Least amount 27 4.93 16 2.92 31 5.66 52 9.49
Total 137 25.00 137 25.00 137 25.00 137 25.00
Final total 548 100.00
x
34.25
x = Total f (137) ÷ 4
Table 2. Breakfast, lunch, and dinner nutritional proportion
Table 3. Periodontal health knowledge category
DISCUSSION
Rice was the most consumed carbohydrates per day. It is diferent from HEP dietary programme recommendation which suggests whole grains, oats, and brown rice for daily consumptions.10
Indonesia has three diferent kinds of rice: red, white, and black rice, with white rice as the widely consumed one. Brown rice contains a lot of ibre and fatty acids which helps to lower the low-density lipoprotein (LDL) cholesterol, also reduce the risk of heart disease and stroke.11
The most consumed types of proteins per day were eggs, chicken, ish, and tempeh. The above results were in accordance with the HEP diet. The programme recommends to eat ish,
chicken, beans, and red meat, and to avoid
processed meat.10 Fortunately, the processed meat
consumption was considered in a low range (5-6%). The daily consumption of vegetables and fruits were almost even and varied, which also in line with HEP indicators. Vegetables and fruits are a source of vitamins and minerals. It contains antioxidants which prevent free radicals. Unfortunately, only by eating one type of fruit and vegetables alone is not enough to supply the nutritional needs per day.12
The ideal food proportion in a dish recommended by HEP diet is 25% carbohydrates (whole grains), 25% protein, 30% vegetables, and 20% fruits.10 The results showed the meals
proportion at breakfast showed the proportion of carbohydrates, protein, vegetables, and fruits were 27.5% (66 respondents), 29.1% (62 respondents), 19.8% (60 respondents), and fruits 24.4% (59 respondents), consecutively. Similarly, the food proportion at lunch was 27.1% carbohydrates (70 respondents), 29.1% proteins (75 respondents), 19.8% vegetables (51 respondents), and 24.4% fruits (63 respondents). Slightly diferent from breakfast and lunch, the meal proportion at dinner was 25.6% carbohydrates (59 respondents), 29.9% protein (69 respondents), 23.4% vegetables (54 respondents), and 22.5% fruits (52 respondents). The data showed that the food proportion was similar to the indicator of HEP. However, the proportions of proteins were higher, the vegetables and fruits were lower, especially during lunch and dinner.
to metabolise and excrete excess nitrogen. Thus, it will cause acidosis, dehydration, diarrhoea, increase in blood ammonia, and blood urea.12
Lack of fruit and vegetable risks in raising the cholesterol in the blood. It will also cause vitamin C, folate, and zinc deiciency which will increase the permeability of gingival sulcus, and lead to periodontal disease with a severe gum recession, particularly in patients with vitamin C deiciency.13
The percentage of total respondents answering all 11 questions regarding the periodontal health was 68.9%. It considers as moderate according to Guttman scale. The lowest score was coming from the bleeding gum question. Only 35 out of 137 subjects answered correctly. Bleeding gums occurs when there is inlammation caused by bacterial plaque. Plaque is a soft deposit attached to the surface of the tooth, illings, or prosthesis, and can be removed by mechanical cleanings, such as brushing.3 Almost all of the subject was
able to answer the aetiology of bleeding gums. Bleeding gums, plaque, and calculus is the most recognisable clinical signs of gingivitis. Bacterial invasion of the gums will spread and developed over time resulting in an endotoxin-triggered inlammation.3 It will then lead to bleeding of the
gums, especially on brushing and probing, or it can also occur spontaneously.
CONCLUSION
It can be concluded that dental students in
Faculty of Dentistry Unpad batch 2015 knowledge of HEP diet nearly approaching the indicators recommended by the programme however low in vegetable and fruit. Nevertheless, the periodontal health knowledge was considered as moderate. The reason behind this was because the HEP diet is similar to the Balanced Nutrition Pattern known in Indonesia. Factors which not inline with HEP programme was the lunch and dinner were more in protein but lack in vegetables and fruits. On the other hand, the knowledge of the dental students regarding the periodontal health was moderately good.
pantai Kecamatan Bacukiki Barat Kota Pare-Pare) [minor thesis]. Makassar: Unhas; 2013. 2. Petersen PE, Ogawa H. Strengthening the
prevention of periodontal disease: The WHO approach. J Periodontol. 2005 Dec;76(12):2187-93. DOI: 10.1902/jop.2005.76.12.2187
3. Carranza FA. Clinical diagnosis. In: Newman MG, Takei HH, Carranza FA. Carranza’s Clinical Periodontology. 10th ed. Philadelphia: Saunders-Elsevier; 2006.
4. Tampubolon NS. Dampak karies gigi dan penyakit periodontal terhadap kualitas hidup. Dentika Dent J. 2006;6(1).
5. Khan S, Saub R, Vaithilingam RD, Saii SH, Vethakkan SR, Baharuddin NA. Prevalence of
chronic periodontitis in an obese population:
A preliminary study. BMC Oral Health. 2015;15(114):1-7. DOI: 10.1186/s12903-015-0098-3.
6. Rosaiah K, Aruna K, Nandini TN. Nutritional requirements of the periodontal patient. Indian J Stomatol. 2011;2(3):175-78.
7. National Institute of Health Research and Development (NIHRD). Indonesia Basic Health Research (RISKESDAS) 2012-2013. Jakarta: Ministry of Health of the Republic of Indonesia; 2013.
8. Macdiarmid JI, Loe J, Kyle J, and McNeill G. “It was an education in portion size”. Experience of eating a healthy diet and barriers to long term dietary change. Appetite. 2013 Dec;71:411–9. DOI: 10.1016/j.appet.2013.09.012.
9. Al-Zahrani MS, Bissada NF, Borawskit EA. Obesity and periodontal disease in young, middle-age, and older adults. J Periodontol. 2003 May;74(5):610-5. DOI: 10.1902/ jop.2003.74.5.610.
10. Harvard School of Public Health [homepage on internet]. Boston, MA: The Nutrition Source,
Department of Nutrition, Harvard School
of Public Health. 2011 Healthy Eating Plate & Healthy Eating Pyramid [cited 2016 May] [about 6 screens]. Available from: https:// www.hsph.harvard.edu/nutritionsource/ healthy-eating-plate/.
11. Fibriyanti YW. Kajian kualitas kimia dan biologi beras merah (Oryza nivara) dalam beberapa pewadahan selama penyimpanan [minor thesis]. Surakarta: Universitas Sebelas Maret; 2012.
12. Almatsier S. Prinsip dasar ilmu gizi. Jakarta: Gramedia Pustaka Utama; 2002.
13. Escott-Stump S, Mahan LK. Krause’s food & nutrition therapy. 12th ed. Philadelphia: Saunders-Elsevier; 2007. p. 532-62.
14. Arikunto S. Prosedur penelitian suatu pendekatan praktik. 4th ed. Jakarta: Rineka Cipta; 2013.
15. Guilford JP, Fruchter B. Fundamental statistics in psychology and education. New York: McGraw-Hill; 1978.