Refer to Important disclosures in the last page of this report
StockDataTarget price (Rp) Rp4,670
Prior TP (Rp) Rp4,670
Revenue +7.0%yoy, while EBITDA +3.3% yoy.
Disturbed by one-off early retirement program.
Data accounts 70% of service revenue.
Maintained Buy.
Fairly inline.
XL Axiata booked flat net income of Rp375bn, driven by revenue of
Rp22.9tn (+7.0% yoy) and EBITDA of Rp8.3tn (+3.3% yoy). Below the
operational line, interest rate reduced 14.2% yoy indicating strong effort to
deleverage, but this was negated by forex loss of Rp30bn vs gains in FY16.
Additionally, other income from tower sales dropped to Rp423bn (-75.4% yoy).
Overall, the result was inline with our expectation and consensus but on the
weaker side due to one-off cost from reorganization and structural transformation.
EBITDA margin stood at 38.2% in 3Q1717, compared to improved normalized
margin of 41.1% in 4Q17.
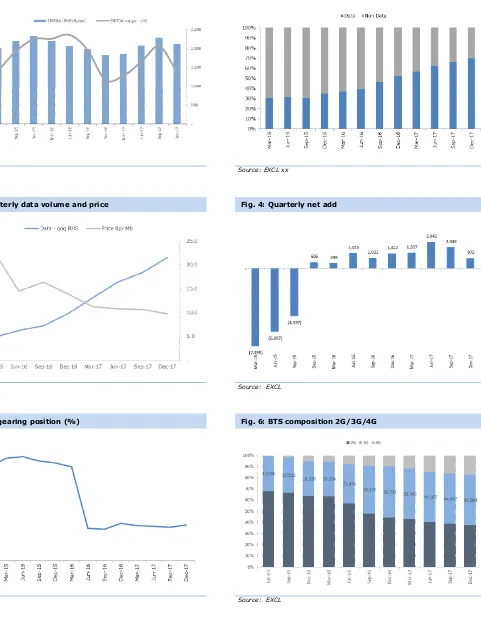
Data centric growth
. Data revenue accounts 70% of total service revenue, the
highest among the major operator. Data revenue was Rp13.1tn in FY17 (+61.0%
yoy), but non-data revenue was down -29.7% to Rp7.4tn. This rapid
transformation to data was supported by 72% smartphone penetration from XL’s
subscriber. Data volume was 387.7Pb in 4Q17, growing by +17.2% qoq, but
effective data pricing slipped -8.8% qoq to Rp9.7/Mb. Therefore, effective pricing
has not indicated any upward trend. With stiff competition, XL is forced to
distribute attractive data bonuses, thus having a negative impact to effective
pricing.
Sound operational matrix
. Total XL subscribers stood at 53.5mn subs consist of
703k postpaid and 52.8mn prepaid. XL experienced 9 consecutive quarters with
positive net add, which resulted from the dual brand strategy aiming at white
collar, blue collar and youth segment. The impact from re-registration has yet to
occur. ARPU was steady at Rp33k per month per subs, indicating good balance
between fast growth data and declining voice and SMS. XL has extended its 4G
BTS covering 360 cities with 17,000 4G BTS and 46,000 3G BTS. Capitalized and
paid capex increased by 11% yoy and 20% in FY17. XL has committed capex of
Rp7.0tn in FY18, similar with last year.
Maintain Buy
. XL posted a moderate financial result with consistent growth in
data. Capex are driven to support data growth and coverage and capacity in
ex-Java. These efforts are still yet to be reflected in the financial result. Nevertheless,
XL’s effort remain consistent with the management’s policy to grow data with high
cost discipline. We maintain our Buy call on the counter with target price of
Source: EXCL, IndoPremier Share Price Closing as of : 02-February-2018
2
Refer to Important disclosures in the last page of this report
Fig. 1: Quarterly EBITDA and margin Fig. 2: Service revenue composition data vs non date
Source: EXCL Source: EXCL xx
Fig. 3: Quarterly data volume and price Fig. 4: Quarterly net add
Source: EXCL Source: EXCL
Fig. 5: Net gearing position (%) Fig. 6: BTS composition 2G/3G/4G
3
Refer to Important disclosures in the last page of this report
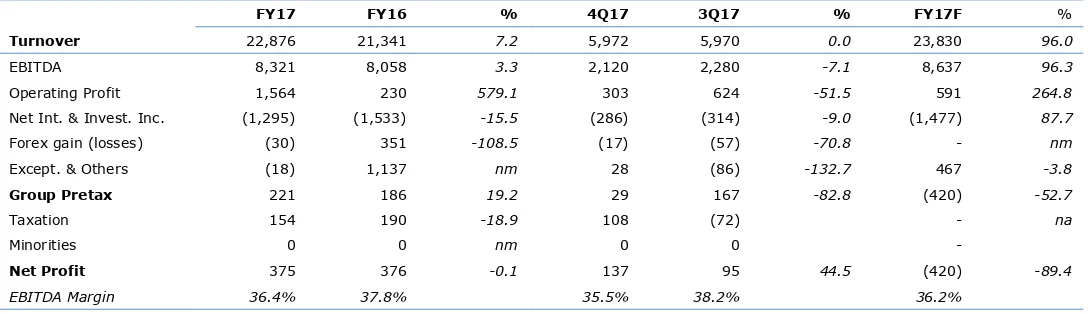
Fig 7: Financial result FY17 highlightsFY17 FY16 % 4Q17 3Q17 % FY17F %
Turnover 22,876 21,341 7.2 5,972 5,970 0.0 23,830 96.0
EBITDA 8,321 8,058 3.3 2,120 2,280 -7.1 8,637 96.3
Operating Profit 1,564 230 579.1 303 624 -51.5 591 264.8
Net Int. & Invest. Inc. (1,295) (1,533) -15.5 (286) (314) -9.0 (1,477) 87.7
Forex gain (losses) (30) 351 -108.5 (17) (57) -70.8 - nm
Except. & Others (18) 1,137 nm 28 (86) -132.7 467 -3.8
Group Pretax 221 186 19.2 29 167 -82.8 (420) -52.7
Taxation 154 190 -18.9 108 (72) - na
Minorities 0 0 nm 0 0 -
Net Profit 375 376 -0.1 137 95 44.5 (420) -89.4
EBITDA Margin 36.4% 37.8% 35.5% 38.2% 36.2%
4
Refer to Important disclosures in the last page of this report
Year To 31 Dec (RpBn) 2015A 2016A 2017F 2018F 2019F
Income Statement
Net Revenue 22,876 21,341 23,755 26,197 29,176
Cost of Sales 0 0 0 0 0
Gross Profit 22,876 21,341 23,755 26,197 29,176
SG&A Expenses (21,597) (21,264) (23,164) (24,670) (26,553)
Operating Profit 1,280 77 591 1,526 2,622
Cash & Equivalent 3,312 1,400 (1,564) (2,933) (7,200)
Receivable 921 663 956 1,054 1,174
Inventory 79 161 82 90 101
Other Current Assets 5,840 4,583 4,834 5,171 5,537
Total Current Assets 10,152 6,807 4,308 3,383 (388)
Fixed Assets - Net 33,427 33,183 32,957 32,798 32,752
Goodwill 6,681 6,681 6,681 6,681 6,681
Non Current Assets 8,476 8,056 7,292 7,037 6,781
Total Assets 58,844 54,896 51,407 50,067 45,995
ST Loans 0 0 0 0 0
Payable 5,283 6,503 0 6,017 6,702
Other Payables 6,175 4,002 4,791 5,125 5,531
Current Portion of LT Loans 4,290 3,973 0 0 0
Total Current Liab. 15,748 14,477 10,247 11,143 12,233
Long Term Loans 25,054 14,394 16,167 14,023 8,305
Other LT Liab. 3,950 4,816 3,952 3,516 3,080
Total Liabilities 44,753 33,687 30,367 28,682 23,618
Equity 14,092 21,209 21,040 21,385 22,378
Retained Earnings 0 0 0 0 0
Minority Interest 0 0 0 0 0
Total SHE + Minority Int. 14,092 21,209 21,040 21,385 22,378
5
Refer to Important disclosures in the last page of this report
Year to 31 Dec 2015A 2016A 2017F 2018F 2019F
Cash Flow
Net Income (Excl.Extraordinary&Min.Int) (25) 376 (420) 345 1,240
Depr. & Amortization 5,678 7,064 7,828 8,018 8,214
Changes in Working Capital 480 1,178 (867) 439 580
Others 3,285 706 1,043 1,541 1,444
Cash Flow From Operating 9,418 9,324 7,584 10,343 11,479 Capital Expenditure (4,044) (6,401) (6,837) (7,603) (7,914)
Others 723 201 (6) (157) (355)
Cash Flow From Investing (3,322) (6,200) (6,843) (7,761) (8,268)
Loans (2,360) (10,978) (2,200) (2,144) (5,718)
Equity 36 6,721 0 0 0
Dividends 0 0 0 0 0
Others (3,816) (353) (2,516) (1,463) (522)
Cash Flow From Financing (6,141) (4,610) (4,716) (3,607) (6,239)
Interest Coverage Ratio (x) 1.4 23.2 2.5 0.9 0.4
Net Gearing (%) 184.7 80.0 84.3 79.3 69.3
Head Office
PT INDO PREMIER SEKURITAS
Wisma GKBI 7/F Suite 718
Jl. Jend. Sudirman No.28
Jakarta 10210 - Indonesia
p +62.21.5793.1168
f +62.21.5793.1167
INVESTMENT RATINGS
BUY : Expected total return of 10% or more within a 12-month period
HOLD : Expected total return between -10% and 10% within a 12-month period
SELL : Expected total return of -10% or worse within a 12-month period
ANALYSTS CERTIFICATION.
The views expressed in this research report accurately reflect the analysts personal views about any and all of the subject securities or issuers; and no part of the research analyst's compensation was, is, or will be, directly or indirectly, related to the specific recommendations or views expressed in the report.
DISCLAIMERS