CHAPTER IV
RESEARCH FINDINGS AND DISCUSSIONS
In this chapter, the writer presented the data which had been collected from the research in the field of study. The data were the result of pretest of experimental and control group, the result of post test of experimental and control group, result of data analysis, and discussion.
A. Data Presentation
1. The result of Pre Test Scores of the Experimental and control class.
The pre test at the experimental group was conducted on August 05 2015 in the class X Tehnik Sepeda Motor (X TSM) Wednesday at time 06.30 – 08.45 the number of students was 37 students, and the control group was conduct on August 03 2015 in the class X Tehnik Kendaraan Ringan (X TKR ) Monday at time 11.00 – 12.30 the number of students was 40 students. The Prêtest of the experimental and control group were presented in table
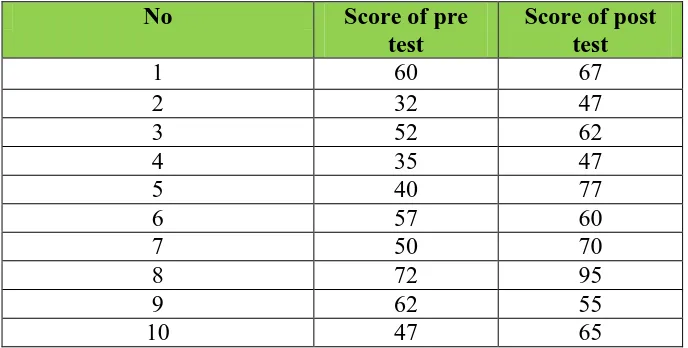
1. The Result of Pre Test Score of the Experiment Class
The pre-test and post test of the experiment class were presented in the following table.
11 67 70
In addition, the result of post test score in experiment class could be know that the highest score 95 and the lower score was 47. The mean was 67.3 the standard deviation was 12.009 and the standard error was 2.001.
2. The Result of Pre-Test and Post Test Score of Control Class
The pre test scores of the control group were presented in the following table.
29 45 45
Based on the data above, it can be seen that the students’ highest score at pre test control
class was 65 and the student’s lowest score was 22. And also, it can be seen that the mean was 42.6, the standard deviation was 11.426 and the standard error was 1.829.
In addition, the result of post test score in control class could be know that the highest score 70 and the lower score was 22. The mean was 43.6 the standard deviation was 11.693 and the standard error was 1.872.
B. The Result of Data Analysis
a. Calculate T-test using Manual Calculation
The writer chose the significance level on 5%, it means the significance level of refusal of null hypothesis on 5%. The writer decided the significance level at 5% due to the hypothesis type stated on non-directional (two-tailed test). It means that the hypothesis can’t direct the prediction
the answer of hypothesis, “Ha” can be (>) or (<). The answer of hypothesis could not be
predicted whether on more than or less than.
To test the hypothesis of the study, the writer used t-test statistical calculation. Firstly, the writer calculated the standard deviation and the error of X1 and X2 at the previous data presentation. In could be seen on this following table:
Table 4.3 the Standard Deviation and Standard Error of X1 and X2
Variable The Standard Deviation The Standard Error
X1 12.009 2.001
X2 11.693 1.872
X1 = Experimental Class
X2 = Control Class
The table showed the result of the standard deviation calculation of X1 was 12.009 and the result of the standard error mean calculation was 2.001. The result of the standard deviation calculation of X2 was 11.693 and the result of the standard error mean calculation was 1.872.
The next step, the writer calculated the standard error of the differences mean between X1 and X2 as follows:
Standard error of mean of score difference between Variable I and Variable II :
SEM1– SEM2 =√ SEM12 + SEM22
= √ 4.004001 + 3.504384
= √7.508383=2.74014324= 2.74
to=
M 1 – M 2 SEm 1− SEm 2
to =
67.3−43.6 2,.74
= 23.7
2.74= 8.649
Which the criteria:
If t-test (t-observed) ≥ t-table, Ha is accepted and Ho is rejected
If t-test (t-observed) < t-table, Ha is rejected and Ho is accepted
Then, the writer interpreted the result of t-test; previously, the writer accounted the degree of freedom (df) with the formula:
Df = (N1+N2) - 2 = 37+ 40 – 2 = 75
5% to 1%
1.99 <8.649> 2.64
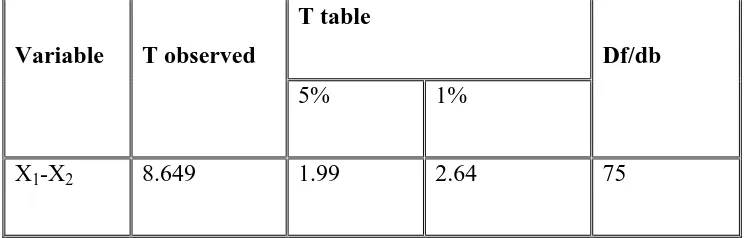
Table 4.4 Calculation the Result of T-Test
Variable T observed
T table
Df/db
5% 1%
X1-X2 8.649 1.99 2.64 75
Where:
X1 = Experimental Class
X2 = Control Class
T observe = the calculated Value
T table = the distribution of t value
Df/db = Degree of freedom
Based on the result of hypothesis test calculation, it was found that the value of tobserved was greater than the value of table at 1% and 5% significance level or1.99< 8.649>2.64. It means Ha was accepted and Ho was rejected.
pictures gave significant effect on the students’ vocabulary score of the tenth grade students at SMKN 1 Palangka Raya.
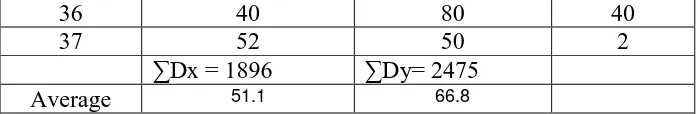
36 40 80 40
37 52 50 2
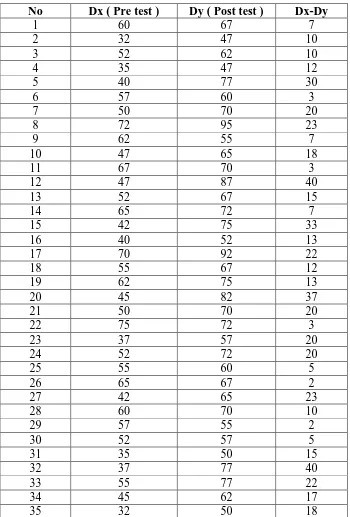
∑Dx = 1896 ∑Dy= 2475
Average 51.1 66.8
34 35 60 25
Based on the table above it can be seen that there was significant difference of mean score of pre test and post test at Experiment class where pre test mean score was 51.1 and post test mean score was 66.1.while based on the mean score at control class of pre test score, it was 42.2 and post test was 43.3. reasons why teaching vocabulary using animation pictures could increase students’ interest in teaching learning process.1 The first reason is about the advantage of animation pictures in learning process, such as: the skill and ability improvement; the interactive animation takes less time to teach students complex things and makes them enjoy more to learn difficult things. the students will more motivated and learner will get more skill, which is the main reason to make
1Rasha rasheed awad, The Effect Of Using Animation In Teaching English Vocabulary For 3 rd
them more motivated. From the data above, it is shown that teaching vocabulary by using animation as the media of learning process gave significant effects in improving students’ English vocabulary. The students more interested to receive vocabulary using animation pictures.
So, the research of improving students’ English vocabulary by using animation pictures as media
is balanced with the theory in chapter II : page 25. The theory supported the use of animation pictures as media in learning process and suitable with the condition of the tenth grade students.
The result of data analysis showed that The Effect of using Animation Pictures in Teaching English Vocabulary to the Tenth Graders of SMKN 1 Palangka Raya. It based on the means score between Pre-test and Post-test. The mean score of Posttest reached higher score than the mean score of Pretest (X= 67.3< Y=43.6). It indicated that the students’ scores increased after conducting treatment. In other words, teaching vocabulary by using animation pictures. Meanwhile, after the data was calculated using the ttest formula using manual calculation showed that the tobserved was 8.649. By comparing the tobserved with the ttable, it was found that the tobserved was higher than ttable at 5% level significance or tobserved =8.649>ttable=1.99.