SYNTHESIS AND CHARACTERIZATION OF ALUMINA PRECURSORS
DERIVED FROM ALUMINUM METAL THROUGH ELECTROCHEMICAL METHOD
Eva Marlina Ginting
*and Nurdin Bukit
Department of Physics, Faculty of Mathematics and Natural Sciences ,University State of Medan, Jl. Williem Iskandar Psr V, Medan 20221, Indonesia
Received January 23, 2015; Accepted April 13, 2015
ABSTRACT
This study investigated the use of the electrochemical method to prepare alumina (-Al2O3) from aluminum
metal. The-Al2O3precursor was calcined at 110 °C for six hours and then characterized using Fourier Transform
Infrared (FTIR) spectroscopy, Particle Size Analysis (PSA), X-Ray Diffraction spectroscopy (XRD), and Scanning
Electron Microscopy (SEM). To study transformation of the precursor into α-Al2O3, three samples were sintered at
400, 800, and 1200 °C, respectively and they were characterized. The most interesting result obtained was the
transition of AlOOH and β-Al(OH)3 into γ-Al2O3 at low temperatures (400 to 800 °C), followed by transformation of γ-Al2O3into -Al2O3 at high temperature (1200 °C). The overall results obtained demonstrated that electrochemical method is a potential alternative for production of α-Al2O3, which can be achieved in practically pure phase at
sintering temperature at 1200 °C.
Keywords:alumina; electrochemical; sintering; structure; microstructure
ABSTRAK
Dalam penelitian ini telah disintesis alumina dari logam aluminium dengan metode elektrokimia. Sampel alumina dikalsinasi pada suhu 110 °C selama 6 jam, dan selanjutnya dikarakterisasi dengan menggunakan FTIR,
PSA, XRD dan SEM. Untuk mempelajari transformasi α-Al2O3, tiga sampel disintering masing-masing pada suhu
400, 800 dan 1200 °C dan dikarakterisasi. Hasil yang diperoleh menunjukkan bahwa AlOOH and β-Al(OH)3 mengalami transformasi menjadi γ-Al2O3 pada suhu sintering 400 dan 800°C, diikuti transformasi γ-Al2O3 menjadi α-Al2O3 pada suhu sintering 1200 °C. Hasil yang diperoleh secara keseluruhan menunjukkan bahwa metode elektrokimia salah satu alternatif yang berpotensi untuk mensintesis α-Al2O3 murni yang dapat diperoleh pada suhu
sintering 1200 °C.
Kata Kunci:alumina; elektrokimia; sintering, struktur; struktur mikro
INTRODUCTION
Al2O3 (Alumina) is an important ceramic oxide
material with immerse potential for use in an extensive range of engineering products. It is a hard oxide material that possesses excellent resistance to high temperature as well chemical attack. Transition Al2O3 can be
produced from heat treatment of aluminum hydroxides and aluminum salts. The aluminum hydroxides can exist in four well defined forms: the monohydrate AlOOH, as boehmite, diaspore, and the trihydrate Al(OH)3 as
gibbsite and bayerite [1], which at high temperature, all of them will transform into-Al2O3[2]. Basically, alumina
refers to corundum, which has several phases such as γ-Al2O3, β-Al2O3, and α-Al2O3. However, α-Al2O3 phase
is the most thermodynamically stable phase.
Alumina is an interesting material because of its various advantageous properties, such as high hardness, insulation capacity, and transparency [3], low
thermal expansion and conductivity [4-5], as well as high melting point and thermal shock resistance [6]. For these reasons, alumina has been widely applied in advanced structural and functional ceramics, wear resistance applications, composite materials [7], insulator [8], surface protective coating [9], fire retardant [10], catalyst [11-12], membrane [13-14], protective material for abrasion and erosion environments [15-17] and armor systems [18].
to form γ and β-Al2O3, without α- Al2O3 [29]. It has also
been reported that the formation of alumina is strongly influenced by the types of precursors used. For example, crystalline alumina was formed from ammonium aluminum (NH4Al(SO4)2 at temperature of 1050 °C [30],
and at around 900 °C using Al(NO3)3.9H2O (aluminum
nitrate nonahydrate) [31]. The total conversion of alumina phase was obtained above temperature of 1200 °C using aluminum oxyhydroxide [27].
Preparation of alumina from aluminum salts in principle involves the hydrolysis of the salt to produce Al3+ ions which react further with OH- ions to produce Al(OH)3. In this respect, the electrochemical method
proposed in this current study is based on the fact that aluminum metal can be electrochemically oxidized to produce Al3+ ions. In aqueous system, electrochemical process involves simultaneous anodic oxidation of Al metal and cathodic reduction of water to produce H2 gas
and OH- ions, according to the following mechanisms. Anodic reaction: 2 Al 2 Al3+ 6 e (1) Cathodic reaction: 6 H O + 6 e2 3H + 6 OH2 (2) The total reaction according to the above electrochemical reactions can be presented as:
2 3 2
2 Al + 6H O 2 Al(OH) + 3H (3) In reality, the formation of Al(OH)3 is the result of
the reaction between Al3+and OH- ions produced during the electrolysis process. The Al(OH)3 can be converted
into alumina by heating, as indicated by the following reaction:
3 2 3 2
2 Al(OH) Al O + 3H O (4)
It is generally accepted that the electrochemical process obeys Faraday’s law, in which the quantity of the product is linearly proportional to the magnitude of the electric current applied, which in turns is proportional to the electrochemical potential used. In the contexts of this study, it means that the potentials applied will determine the quantity of Al3+ ions produced. In this study, an electrochemical method was applied to produce aluminum ions since aluminum metal is known as a reactive electrode, and could be electrochemically oxidized to produce Al+3 ions with relatively low potentials (standard potential of 1.66 V). In aqueous solution, Al+3ions produced by electrochemical oxidation of aluminum metal will react with OH- ions to produce various Al(III) species depending on the pH, the prominent species in acid condition being Al(OH)3
[32-33], The present study was conducted with the aim of exploring the feasibility of using electrochemical method to produce alumina from aluminum metal as an alternative to commonly used aluminum salts and alkoxides. The precursor produced was then subjected to thermal treatment to investigate the phase conversion of alumina as a function of sintering temperatures based
microstructure of the samples. The functionality change of as a function of thermal treatment was investigated by FTIR spectroscopy, the structure was characterized by XRD and the microstructure was studied using SEM.
EXPERIMENTAL SECTION
Materials
Nitric acid used are reagent grade chemical obtained from Merck. Four aluminum rods were used two as anodes and two cathodes, respectively.
Instrumentation
The equipments used were Nabertherm electrical furnace, magnetic stirrer, and a microbalance Mettler Instrument AG, CH-8806 Greifensee-Zurich, a Perkin Elmer FTIR Spectrometer, an automated Shimadzu XD-610 X-ray diffractometer, a Philips-XL SEM and Particle Size Analyzer MicroTec plus Analysette 22, FRITSCH
Procedure
Electrochemical process
Electrochemical process for preparation of alumina precursor was carried out using an electrochemical unit which consists of a home-made glass container, equipped with a cover having four drilled holes for assembling the electrodes. Four aluminum rods were used as electrodes, two as cathode and two as anode. The electrodes were inserted vertically, through the holes on the cover, into the cell at a distance of 2 cm from each other. The electrodes were set at 3 cm above the bottom of the cell. The cell was then connected to a variable voltage supply to allow the conduct of experiments at specific potential value. To commence the experiment, an aliquot of 500 mL of distilled water was acidified to pH of 4 using 10% HNO3solution and was poured into the
Fig 1. Typical example of the electrochemical process, (a) formation of alumina precursor in electrochemical cell, (b) wet alumina precursor, and (c) dried alumina precursor
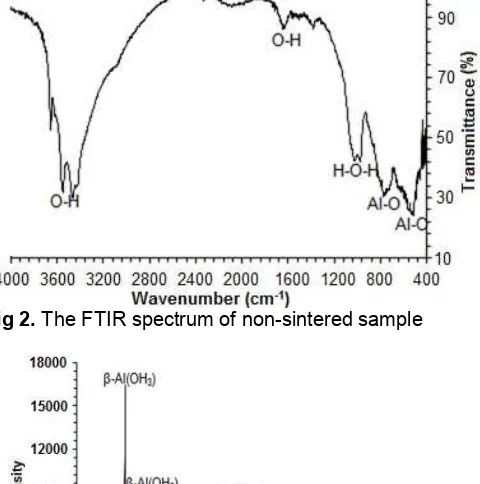
Fig 2.The FTIR spectrum of non-sintered sample
Fig 3. The x-ray diffraction pattern of the non-sintered sample
Characterization
A Perkin Elmer FTIR was used for the investigation of functional groups of the alumina. The sample was mixed with KBr of spectroscopy grade, and scanned in the spectral range of 4000–400 cm-1. XRD patterns were recorded to analyze the effect of temperature on the alumina structure. The samples were examined using an automated Shimadzu XD-610 X-ray diffractometer at the Agency of Nuclear Energy National (BATAN), Serpong-Indonesia. The operating conditions used were CuKα
radiation (λ = 0.15418), produced at 40 kV and 30 mA, with a 0.15° receiving slit. Patterns were recorded over goniometric (2) ranges from 5–100° with a step size of 0.02, counting time 1s/step, and using post-diffraction graphite monochromator with a NaI detector. The diffraction data were analyzed using JADE software after subtracting background and stripping the CuKα2 pattern [34]. Microstructural analysis was conducted using SEM Philips-XL, on polished and thermally-etched samples. The particle size distribution of the sample was measured using Particle Size Analyzer (PSA) MicroTec plus Analysette 22, FRITSCH.
RESULT AND DISCUSSION
Electrochemical Process
Typical example of the electrochemical process and the alumina precursor obtained are presented in Fig. 1.
As can be seen in Fig. 1a, the formation of alumina precursor is very evident, indicated by the formation of floating flock on top of the electrochemical chamber. During the course of the time, it was found that some of the flock finally sank and deposited on the bottom of the chamber. The formation of flock indicated that the electrochemical process took place as expected. To optimize the separation of the alumina precursor, the sample was centrifuged and the solid (gel) was collected as in Fig. 1b. After calcination, dry solid was obtained and crushed into powder as shown in Fig. 1c for characterization.
Characterization of Non-Sintered Sample
Fig 4.Particle size distribution and surface morphology of the non-sintered sample
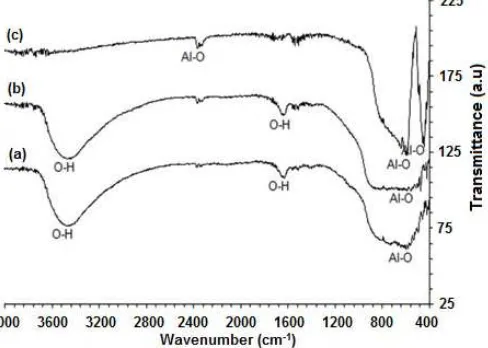
Fig 5.FTIR spectra of the samples at sintered different temperatures (a) 400, (b) 800 and (c) 1200 °C
bending vibration of the H-OH. The presence of peaks associated with O-H bond is most likely due to the presence of Al(OH)3and trapped water. The broad peak
at 1132 cm-1 is most likely due to vibration of Al-OH bond, and the bands at 420 and 610 cm-1 can be assigned to γ-Al-O-Al, as suggested in previous investigations [37-38]. The existence of the functional groups mentioned above confirm that the sample is primarily aluminum hydroxide species as expected, based on the electrochemical reactions.
The non-sintered sample was further characterized using XRD to investigate the crystallographic structure of the sample and ascertain whether the sample was amorphous or crystalline phase. The XRD pattern of the sample is shown in Fig. 3.
The phases were identified with the PDF diffraction lines using search-match method [39]. As can be seen,
the diffraction pattern indicates the presence of two phases in the sample. The first phase is bayerite/ β-Al(OH)3 which is indicated by the most intense peak
at 2θ =18.80° (PDF-12-0457), the second phase of is boehmite/AlOOH with the most intense peak at 2θ = 14.28° (PDF-21-1307). The presence of alumina in the hydrate form as seen by the XRD is in accordance with the functionality of the sample revealed by the FTIR analysis; therefore the two characterization techniques confirm the formation of aluminum hydroxides. For evaluation of the particle size distribution and surface morphology, the sample was characterized using PSA and SEM techniques, and the results obtained are shown in Fig. 4.
As can be seen, in term of the particle size, the sample composed of two groups, in which the first has a particle size in the range of 10–70 μm with the population of 58.5%, and the second has the particle size in the range of 0.7–3.0 μm, with the population of 41.5%. The existence of two particle size groups in the sample is in agreement with the surface morphology of the sample as seen by SEM. As can be seen, the surface of the sample is characterized by the existence of clusters of different shapes and sizes. These different shapes and sizes can be attributed to the different aluminum hydroxide species as demonstrated by the results of phase identification using XRD technique, previously described.
Phase Developments Studies
The most obvious change in the functionality of the samples compared to that of the non-sintered sample (Fig. 2) is the reduction of the intensity of the band assigned to O-H bond, presumably due to evaporation of trapped water and the release of water from Al(OH)3
molecules. As a consequence, the intensity of absorption band at around 468 cm-1, assigned to Al-O vibration, increased and accompanied by the emergence of new band at around 723 cm-1 assigned to Al-O-Al, which is in agreement with the decreased intensity of the peaks assigned to O-H bond, while the emergence of peak attributed to Al-O-Al is an indication of conversion of Al(OH)3into aluminum oxides. The results for sintered
samples also display gradual disappearance of the absorption peaks at 3476 cm-1 up to sintering temperature of 800 °C and practically disappeared at temperature of 1200 °C, implying that complete removal of water was achieved at temperature of 1200 °C, which also suggest that complete transformation of Al(OH)3
phase into oxide phase has been achieved at this temperature. Conversion of Al(OH)3 into oxides is in
agreement with stepwise strengthening of the band associated with Al-O-Al at 723 cm-1. The FTIR analyses revealed very evidently the changes in the functionality of the samples. To gain information regarding the relation between the functionality change and phase development, the samples were furthered characterized using XRD. The X-ray patterns of the samples are presented in Fig. 6a-c.
The phases were identified with the PDF diffraction lines using search-match method, showing the presence of γ-Al2O3 (PDF-10-0425) with the most
intense peak at 2θ = 67.2°, and α-Al2O3(PDF-46-1212)
with the most intense peak at 2θ = 35.2°. For the sample sintered at temperature of 400 °C (Fig. 6a) the presence of γ-Al2O3 clearly detected, together with
small amount of AlOOH, which suggests that at this temperature aluminum hydroxides exist mainly in non-crystalline state. The sample sintered at temperature of 800 °C (Fig. 6b) is marked by disappearance of peak associated with AlOOH, while the intensities of the peak
Fig 6. The X-ray diffraction patterns of the sintered samples at different temperatures (a) 400, (b) 800 and (c) 1200
compared to those observed in the sample sintered at 400 °C (Fig. 6a). This implies that decomposition of Al(OH)3with the release of OH species was achieved at
800 °C, which suggest that dehydration and desorption of surface hydroxyl groups lead to the formation of γ-Al2O3 has been achieved at this temperature. In
previous studies [29], it was concluded that the presence of γ-Al2O3 is most likely a result of aluminum hydroxide
crystallization at temperature range of 750–900 °C [27]. In the present study, it was also found that thermal treatment lead to gradual conversion of AlOOH, β-Al(OH)3 and γ-Al2O3 into α-Al2O3, in which the
treatment of the sample at 1200 °C was found to lead to sharp increase in the amounts of α-Al2O3, and practical
disappearance of the other phases (Fig. 6c). This finding confirms that complete crystallization γ-Al2O3 into
α-Al2O3, as has also been suggested by others [27].
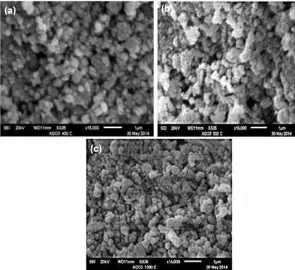
As previously described, the results of PSA and SEM analyzes for the non-sintered sample indicates the existence of particle with different size. For comparison, the morphology of the sintered samples was characterized using SEM. The images were shown in Fig. 7a-c.
The microstructure of the sample sintered at 400 °C (Fig. 7 a) does not show any major difference to that of the sample treated at 800 °C (Fig. 7 b). Both samples are marked by initiated coalescence of aluminum hydroxide spheres which are still amorphous. This feature suggest that at 400 and 800 °C, part of the amorphous aluminum hydroxides phase started to change and allowed for particles rearrangement of Al2O3, before the formation of α-Al2O3 takes place, that
appears to form at 1200 °C as observed in the XRD results (Fig. 6c). The formation α-Al2O3 can be seen
more clearly by inspecting the SEM micrograph of the sample treated at 1200 °C (Fig. 7c), which displays relatively very uniform surface with small grain sizes, and covered the entire surface. Increasing sintering temperature was found to intensifying the formation of alumina as indicated by XRD result (Fig. 6c).
CONCLUSION
The present study has demonstrated that electrochemical method is a potential alternative method for production of alumina precursor, composed of two groups of particle as seen by the PSA technique. Sintering treatments suggested that gradual conversion of the precursor took place through transformation of AlOOH, β-Al(OH)3 and γ-Al2O3, into final phase of
α-Al2O3 at 1200 °C, marked by relatively homogeneous
surface morphology with relatively small particle size as seen by SEM technique. This phase transformation is supported by the change in the functionality of the
composition as seen by XRD technique.
ACKNOWLEDGEMENT
The authors thank the University State of Medan for financial support and access to laboratory facilities and Agency of Nuclear Energy National (BATAN) Serpong, Indonesia.
REFERENCES
1. Tijburg, I.I.M., De Bruin, H., Elberse, P.A., and Geus, J.W., 1991, J. Mater. Sci., 26(21), 5945–5949.
2. Wefers, K., and Misra, C., 1987, Oxides and Hydoxides of Aluminum, Alcoa Laboratories, Aluminum Company of America, Pittsburgh, 47. 3. Hart, L.D., 1990,Alumina Chemicals: Science and
Technology Handbook, 1st ed. Wiley-American Ceramic Society, Columbus Ohio, USA.
4. Touloukian, Y.S., Kirby, R.K., Taylor, R.E., and Lee, T.Y.R., 1984,Thermal Expansion Nonmetallic Solids(Thermophysical Properties of Matter), New York: IFI/Plenum, 176–177.
5. Dorre, E., and Hubner, H., 1984, Alumina-Processing and Application, Berlin: Springer-Verlag, 1–267
6. Morrell, R., 1987, Handbook of Properties of Technical and Engineering Ceramic Society, Part 2, Data Reviews, Sect. I. High-Alumina Ceramics, London, 255.
7. Lach, R., Haberko, K., Bućko, M.M., Szumera, M., and Grabowski, G., 2011, J. Eur. Ceram. Soc. 31(10), 1889–1895.
8. Michizono, S., Saito, Y., Suharyanto, Yamano, Y., and Kobayashi, S., 2007,Vacuum, 81(6), 762–765. 9. Keyvani, A., Saremi, M., and Sohi, M.H., 2010, J.
Alloys Compd., 506(1), 103–108.
10. Laachachi, A., Ferriol, M., Cochez, M., Cuesta, J.M.L., and Ruch, D., 2009,Polym. Degrad. Stab., 94(9), 1373–1378.
11. Lukić, I., Krstić, J., Jovanović, D., and Skala, D., 2009,Bioresour. Technol., 100(20), 4690–4696. 12. Ganesh, I., Torres, P.M.C., and Ferreira, J.M.F.,
2009,Ceram. Int., 35(3), 1173–1180.
13. Keizer, K., Uhlhorn, R.J.R., van Vuren, R.J., and Burggraaf, A.J., 1988, Membr. Sci., 39(3), 285–300.
14. Lin, Y.S., and Burggraaf, A.J., 1991,J. Am. Ceram. Soc., 74(1), 219–224.
15. Herth, G.R., Johnson, T.D, Parry M.T., and Wall, D.J., 1990,Br. Ceram. Trans., 89(1), 17–21. 16. Medvedovski, E., 2000, Interceram, 49(2),
17. Medvedovski, E., 2001,Wear, 249, 821–828.
18. Medvedovski, E., 2002, Am. Ceram. Soc. Bull., 81(3), 27–32.
19. Reid, C.B., Forrester, J.S., Goodshaw, H.J., Kisi, E.H., and Suaning, G.J., 2008, Ceram. Int., 34(6), 1551–1556.
20. Mirjalili, F., Hasmaliza, M., and Abdullah, L.C., 2010,
Ceram. Int., 36(4), 1253–1257.
21. Kavitha, R., and Jayaram, V., 2006, Surf. Coat. Technol., 201(6), 2491–2499.
22. Trinh, D.H., Ottosson, M., Collin, M., Reineck, I., Hultman, L., and Högberg, H., 2008, Thin Solid Films, 516(15), 4977–4982.
23. Qu, L., He, C., Yang, Y., He, Y., and Liu, Z., 2005,
Mater. Lett., 59(29-30), 4034–4037.
24. Yatsui K., Yukawa, T., Grigoriu, C., Hirai, M., and Jiang, W., 2000,J. Nanopart. Res., 2(1), 75–83. 25. Zhou, Y., Phillips, R.J., and Switzer, J.A., 1995, J.
Am. Ceram. Soc., 78(4), 981–986.
26. Zhou, Y., and Switzer, J.A., 1996,J. Alloys Compd., 237(1-2), 1–5.
27. Narayanan, T.S.N.S., and Seshadri, S.K., 2000, J. Mater. Sci. Lett., 19(19), 1715–1718.
28. Liang, L.J., Jin, H., Jun, W.K., and Qin, Z.X., 2010,
Adv. Mater. Res., 105-106, 805–807.
29. Urretavizcaya, G., Cavalieri, A.L., López, J.M.P., Sobrados, I., and Sanz, J., 1998,J. Mater. Synth. Process., 6(1), 1–7.
30. Cava, S., Tebcherani, S.M., Souza, I.A., Pianaro, S.A., Paskocimas, C.A, Longo, E., and Varela, J.A., 2007, Mater. Chem. Phys., 103(2-3), 394–399.
31. Bustanafruz, F., Tafreshi, M.J., and Fazli, M, 2013,
J. Nanostruct., 2(4), 463–468.
32. Swaddle, T.W., 2001, Coord. Chem. Rev., 219-221, 665–686.
33. Holt, P.K., Barton, G.W., Wark, M., and Mitchell, C.A., 2002,Colloids Surf., A, 211(2-3), 233–248. 34. JADE, 1997,Program XRD Pattern Processing PC,
Materials Data Inc. (MDI), Livermore, CA.
35. Adam, F., and Chua, J.H., 2004, J. Colloid Interface Sci., 280(1), 55–61.
36. Chandradass, J., and Kim, K.H., 2009, Mater. Manuf. Process., 24, 541–454.
37. Colomban, Ph., 1989, J. Mater. Sci., 24, 3002–3006.
38. Ue, M., Mizutani, F., Takeuchi, S., and Sato, N., 1997,J. Electrochem. Soc., 144(11), 3743–3748. 39. Powder Diffraction File (Type PDF-2), 1997,