2015
International Proiles
of Health Care Systems
JANUAR
Y 2016
EDITED BY
Elias Mossialos and Martin Wenzl
London School of Economics and Political Science
Robin Osborn and Dana Sarnak
Th e Co m m o n w e a lT h Fu n d is a private foundation that promotes a high performance health
care system providing better access, improved quality, and greater efficiency. The Fund’s work focuses particularly on society’s most vulnerable, including low-income people, the uninsured, minority Americans, young children, and elderly adults.
Australia, Canada, China, Denmark, England, France, Germany, India, Israel, Italy,
Japan, The Netherlands, New Zealand, Norway, Singapore, Sweden, Switzerland,
and the United States
EDITED BY
Elias Mossialos and Martin Wenzl
London School of Economics and Political Science
Robin Osborn and Dana Sarnak
The Commonwealth Fund
JANUARY 2016
Abstract: This publication presents overviews of the health care systems of Australia, Canada, China, Denmark, England, France, Germany, India, Israel, Italy, Japan, the Netherlands, New Zealand, Norway, Singapore, Sweden, Switzerland, and the United States. Each overview covers health insurance, public and private financing, health system organization and governance, health care quality and coordination, disparities, efficiency and integration, use of information technology and evidence-based practice, cost containment, and recent reforms and innovations. In addition, summary tables provide data on a number of key health system characteristics and performance indicators, including overall health care spending, hospital spending and utilization, health care access, patient safety, care coordination, chronic care management, disease prevention, capacity for quality improvement, and public views.
2015 International Proiles
of Health Care Systems
To learn more about new publications when they become available, visit the Fund’s website and
Table 1. Health Care System Financing and Coverage in 18 Countries . . 6
Table 2. Selected Health System Indicators for 17 Countries . . . . 7
Table 3. Selected Health System Performance Indicators for 11 Countries . . . . .8
Table 4. Provider Organization and Payment in 18 Countries . . . 9
The Australian Health Care System, 2015 . . . .11
The Canadian Health Care System, 2015 . . . 21
The Chinese Health Care System, 2015 . . . 31
The Danish Health Care System, 2015 . . . 39
The English Health Care System, 2015. . . .49
The French Health Care System, 2015 . . . 59
The German Health Care System, 2015 . . . 69
The Indian Health Care System, 2015 . . . 77
The Israeli
Health Care System, 2015 . . . 87
The Italian Health Care System, 2015 . . . .97
The Japanese Health Care System, 2015 . . . 107
The Dutch Health Care System, 2015. . . . 115
The New Zealand Health Care System, 2015. . . . 123
The Norwegian Health Care System, 2015 . . . .133
The Singaporean Health Care System, 2015 . . . 143
The Swedish Health Care System, 2015 . . . 153
The Swiss Health Care System, 2015 . . . 161
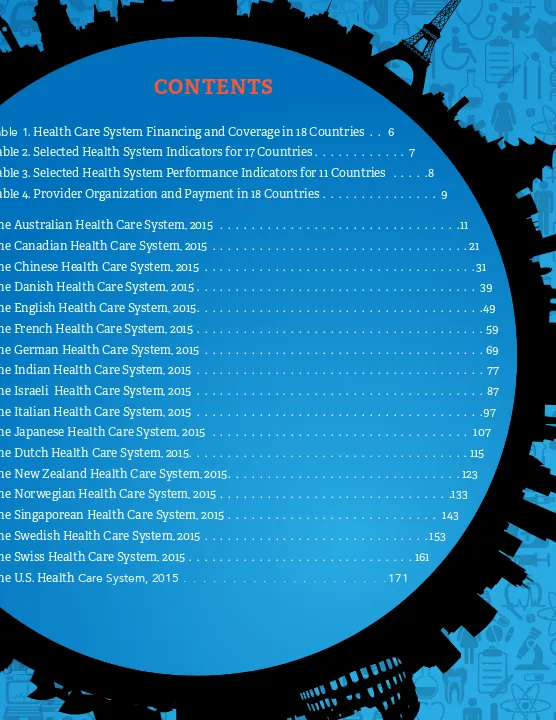
[image:5.612.45.601.60.780.2]Table 1. Health Care System Financing and Coverage in 18 Countries
HEALTH SYSTEM AND PUBLIC/PRIVATE INSURANCE ROLE BENEFIT DESIGN
Government role Public system financing
Private insurance role (core benefits; cost-sharing; noncovered benefits; private facilities or amenities;
substitute for public insurance) Caps on cost-sharing Exemptions and low-income protection Australia Regionally administered, joint (national & state) public hospital funding;
universal public medical insurance program (Medicare) General tax revenue; earmarked income tax ~47.3% buy complementary (e.g., private hospital and dental care, optometry) and supplementary coverage (increased choice, faster access for nonemergency services, rebates for selected services)
Caps for pharmaceutical OOP expenditure only, dependent on income and total OOP expendi-ture in the same year
Low-income and older people: Lower cost-sharing; lower pharmaceutical OOP cap and lower OOP maxi-mum for 80% Medicare services rebatea
Canada Regionally administered universal public insurance program that plans
and funds (mainly private) provision Provincial/federal general tax revenue ~67% buy complementary coverage for noncovered benefits (e.g., private rooms in hospitals, drugs, dental care, optometry) No There is no cost-sharing for publicly covered services; protection for low-income people from cost of prescrip-tion drugs varies by region
China Supervision by health authorities (Health and Family Planning Commis-sions) at the national, provincial and local levels; some direct provision through public ownership of hospitals
There are three main publicly financed health insurance types with local-area risk-pooling: urban employer-based (mainly payroll taxes, for formally employed urban resi-dents), urban resident basic (mainly government funded, for urban nonemployed residents), and rural cooperative medical scheme (government-funded, for rural residents)
Complementary to cover cost-sharing and gaps, as well as better health care quality and/or higher reimbursements. No data on coverage, but growth has been rapid.
No Government subsidies to low-income families for insur-ance contributions and OOP; emergency assistinsur-ance by local governments for specific diseases and unpaid emergency department or other expenses
Denmark National health care system. Regulation, central planning, and funding
by national government; provision by regional and municipal authorities. Earmarked income tax ~39% have complementary coverage (cost-sharing, noncovered benefits such as physiotherapy), ~26% have supplementary cover-age (access to private providers)
No. Decreasing copayments with higher OOP
drug spending. Drug OOP cap for chronically ill (DKK3,775 [USD498]); financial assistance for low income and terminally illa
England National health service (NHS) General tax revenue (includes employment-related
insurance contributions) ~11% buy supplementary coverage for more rapid and convenient access (including to elective treatment in private hospitals) No general cap, but OOP payments almost exclusively apply to prescription drugs and medical appliances only. For drugs, prepayment certificate with GBP29.10 [USD41.10] per three months or GBP104 [USD147] per year ceiling for those need-ing a large number of prescription drugs.a
Drug cost-sharing exemption for low-income, older people, children, pregnant women and new mothers, and some disabled/chronically ill; financial assistance with transport costs available to people with low income; vision tests free for young people, older people, and low-income people
France Statutory health insurance system, with all SHI insurers incorporated into
a single national exchange Employer/employee earmarked income and payroll tax; general tax revenue, earmarked taxes ~95% buy or receive government vouchers for complementary coverage (mainly cost-sharing, some noncovered benefits); limited supplementary insurance
No. EUR50 [USD60] cap on deductibles for
consultations and servicesa Exemption for low income, chronically ill and disabled, and children
Germany Statutory health insurance (SHI) system, with 124 competing SHI insurers (“sickness funds” in a national exchange); high income can opt out for private coverage
Employer/employee earmarked payroll tax; general
tax revenue ~11% opt out from statutory insurance and buy substitutive coverage. Some complementary (minor benefit exclusions from statutory scheme, copayments) and supplementary coverage (improved amenities).
Yes. 2% of household income; 1% of income for
chronically ill. Children and adolescents <18 years of age are exempt
India Children and adolescents <18 years of age are exempt General tax revenue Limited role (<5% of total expenditure) providing substitutive
coverage for the upper class urban population No. Significant reliance on OOP payments (>70% of total health expenditure). Various government-financed health insurance schemes for poor and vulnerable population groups to improve access to hospitalization and reduce out-of-pocket payments
Israel National Health Insurance (NHI) system with four competing, nonprofit
health plans. Government distributes the NHI budget among the health plans primarily through capitation.
Earmarked income-related tax and general government
revenues Complementary (for benefits such as dental care, drugs, or long-term care) and supplementary coverage (for quicker access and
superior service) provided by two types of voluntary insurance: VHI offered by statutory health plans (HP-VHI) (~87% of adult population coverage); commercial VHI (C-VHI) (~53% coverage); C-VHI tend to be more comprehensive and more expensive.
Not overall. Caps on OOP for drugs (chronically
ill only) and specialist visits (at household level). Quarterly OOP caps for drugs for the chronically ill and age-, income-, and health status-related discounts; copayment exemptions for Holocaust survivors; age-, income-, disability-, and health status-related exemptions on copayments for specialist consultations; reduced health tax (3% instead of 5%) for people with low incomes
Italy National health care system. Funding and definition of minimum benefit package by national government; planning, regulation and provision by regional governments.
National earmarked corporate and value-added taxes;
general tax revenue and regional tax revenue ~15% buy complementary (services excluded from statutory benefits) or supplementary coverage (more amenities in hospitals, wider provider choice)
No. Max EUR46.15 [USD61] copayment per outpatient specialist consultation or diagnostic procedure; limited copayment (regional rates) on drugs.a
Exemptions for low-income older people/children, pregnant women, chronic conditions/disabilities,
rare diseases
Japan Statutory health insurance system, with >3,400 noncompeting public,
quasi-public, and employer-based insurers. National government sets provider fees, subsidizes local governments, insurers, and providers and supervises insurers and providers.
General tax revenue; insurance contributions Majority of population have coverage for cash benefits in case of sickness, usually together with life insurance. Limited role of complementary and supplementary insurance offered separately from life insurance.
Yes. Coinsurance reduced to, e.g., 1% after JPY80,100 [USD761] monthly cap, depending on enrollee age and income. Annual cap of total OOP payments at between JPY340,000 [USD3,230] and JPY1.26M [USD11,970] per household, depending on income and ages of household members.a
Low-income monthly OOP ceiling: JPY35,400 [USD336]; reduced cost-sharing for young children, older people, those with chronic conditions, mental illness and disabilities. Tax-funded health services for those on
social assistance a
Netherlands Statutory health insurance system, with universally-mandated private insurance (national exchange); government regulates and subsidizes
insurance
Earmarked payroll tax; community-rated insurance
premiums; general tax revenue Private plans provide statutory benefits; 84% buy complementary coverage for benefits excluded from statutory package such as dental care, alternative medicine, physiotherapy, eyeglasses, contraceptives and copayments
No, but annual deductible of EUR375 [USD455]
covers most cost-sharinga GP care and children exempt from cost-sharing; premium subsidies for low-income
New Zealand National health care system. Responsibility for planning, purchasing, and
provision devolved to geographically defined District Health Boards. General tax revenue ~33% buy complementary coverage (for cost-sharing, specialist fees, and elective surgery in private hospitals) and supplementary coverage for faster access to nonurgent treatment
No. Reduced fees after 12 doctor visits per year/patient and no drug copayments after 20 prescriptions per year/family.
No primary care consultation charges for children under age 13; subsidies for low-income, some chronic condi-tion and high-need groups, Maori and Pacific Islanders
Norway National health care system. Some direct funding and provision roles
for national government and some responsibilities devolved to Regional Health Care Authorities and municipalities.
General tax revenue, national and municipal taxes ~8% holds supplementary VHI, mainly bought by employers for providing employees quicker access to publicly covered elective services and choice among private providers.
Yes. Overall annual cost sharing ceiling is
NOK2,105 [USD223].a Exemptions for children < 16 yrs. somatic, <18yrs psychiatric, pregnant women, for some communicable
diseases (including STDs), those with work-related injuries; low-income groups receive free essential drugs and nursing care
Singapore Government subsidies at public health care institutions and some providers;
Medisave: mandatory medical savings program for routine expenses; MediShield: catastrophic health insurance; Medifund: government endow-ment fund to subsidize health care for low-income and those with large bills. Government regulation of private insurance, central planning and financing of infrastructure and some direct provision through public hospitals and clinics.
General tax revenue Medisave-approved Integrated Shield Plans (private insurance
plans) supplement MediShield coverage to provide catastrophic health coverage for additional ward classes. Other types of private insurance are also available, including private insurance provided by employers.
No Subsidized care for low-income population, with income-
and asset-based means-test to target subsidies. Medifund as safety net to pay for low-income and people with no means to pay for their health care bills.
Sweden National health care system. Regulation, supervision, and some funding by national government; responsibility for most financing and purchasing/ provision devolved to county councils.
Mainly general tax revenue raised by county councils;
some national tax revenue ~10% of all employed individuals ages 15–74 get supplementary coverage from employers for quicker access to a specialists and
elective treatment
Yes. SEK1,100 [USD123] for health services and
SEK 2,200 [USD246] for drugs.a Some cost-sharing exemptions for children, adolescents,
pregnant women, and elderly.
Switzerland Statutory health insurance system, with universally mandated private
insurance (regional exchanges); some federal legislation, with cantonal (state) government responsible for provider supervision, capacity plan-ning, and financing through subsidies
Community-rated insurance premiums; general tax
revenue Private plans provide universal core benefits; some people buy complementary (services not covered by statutory insurance) and supplementary (improved amenities and access); no coverage
data available
Yes. CHF700 [USD511] maximum after
deductible a Some copayment exemptions and CHF350 [USD255] cap for <19-year-olds; income-related premium
assis-tance (28% receive); maternity care fully covereda
United States Medicare: age 65 and older, some disabled; Medicaid: some
low-income; for those without employer coverage, state-level insurance exchanges with income-based subsidies; insurance coverage mandated, with some exemptions (10.4% of adults uninsured)
Medicare: payroll tax, premiums, federal tax revenue;
Medicaid: federal, state tax revenue Primary private voluntary insurance covers ~66% of population (employer-based and individual); supplementary for Medicare Yes for most private insurance plans: $6,600 yearly limit for individuals; $13,200 for families as of 2015
Yes for most private insurance plans: $6,600 yearly limit for individuals; $13,200 for families as of 2015
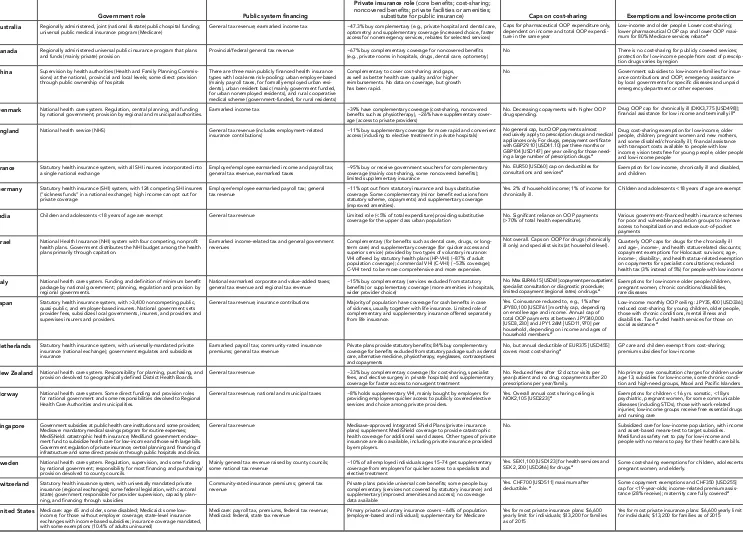
Table 2. Selected Health Care System Indicators for 17 Countries
Australia Canada Chinao Denmark France Germany Israel Italy Japan Netherlands ZealandNew Norway Singapore Sweden Switzerland KingdomUnited United States
Population,
2013 Total population (millions) 23 132 35 317 1,360 720 5 615 63 790 80.646 8.057 60 233 127 296 16.804 4 472 5.080 5 312
g 9 600 8.089 64 107 316 129
Percentage of population over
age 65 14 4% 15 2% 9 7% 17.8% 17 7% 21 1% 10 7% 21 0% 25 1% 16.8% 14 2% 15 6% 10 0%g 19 0% 17 3% 17 1% 14 1% Spending,
2013 (unless
otherwise noted)
Percentage of GDP spent on
health care 9 4%a 10 7% 5 4% 11 1% 11 6% 11 2% 7 4%b n/a 10 2% 11 1%e 11 0% 9 4% 4 7%g 11 5% 11 1%e 8.8% 17 1% Health care spending per capitad $4,115a $4,569 $636 $4,847 $4,361 $4,920 $2,232b n/a $3,713 $5,131e $3,855 $6,170 $2,881h $5,153 $6,325e $3,364 $9,086
Average annual growth rate of real health care spending per
capita, 2009–13 2 42%
l 0 22% 15 41% –0.17% 1 35% 1 95% 2 61%m n/a 3.83% 1 73%e 0.82% 1 40% n/a 6 95%e 2 54%e –0.88% 1 24%
Out-of-pocket health care
spending per capitad $771a $623 $216 $625 $277 $649 $627 $666 $503a $270 $420 $855 n/a $726 $1,630 $321 $1,074
Hospital spending per capitad $1,645a $1,338 $392 $2,070 $1,600 $1,423 $772b n/a 1,673a $1,849 n/a $2,285a n/a $1,907 $2,289 n/a $2,964
Spending on pharmaceuticals
per capitad $590a $761 $263r $288 $622 $678 287b $572 $756a $397 n/a $437 n/a $496 $696 n/a $1,034
Physicians,
2013 (unless
otherwise noted)
Number of practicing physicians
per 1,000 population 3 39 2.48a 2 04 3 62a 3 10 4 05 3 43 3 90 2 29a n/a 2.81 4 31 1 9g,c 4 01a 4 04 2 77 2 56 Average annual number of
physician visits per capita 7 1 7 7a 5 4 4 6 6 4 9 9 n/a 6.8 12 9a 6 2 3 7a 4 2 n/a 2 9 3 9a n/a 4 0c Hospital spending, utilization, and capacity, 2013 (unless otherwise noted)
Number of acute care hospital
beds per 1,000 population 3.36a 1.71a 4.55 2.47 3.35 5.34 1.90 2.75b 7.92 3.32a 2.59 2.29 2.0i,b 1.94 2.91 2.28 2.48a
Hospital spending per
discharged $9,529a $15,916a $2,033 $11,471c $9,622 $5,641 $4,797b n/a $14,408b 14,980a n/a $11,361c n/a n/a $13,437a n/a $20,991c
Hospital discharges per 1,000
population 173a 83a 140 172c 166 252 159 124 111b 119a 146 175c n/a 163c 166a 129 125c
Average length of stay for
curative care (days) 4.8a 7.6a 8.9 n/a 5.7a 7.7 4.3 6.8 17.2 6.4a 5.3 5.5 n/a 5.6a 5.9 5.9 5.4b
Medical technology, 2013 (unless otherwise noted)
Magnetic resonance imaging (MRI) machines per million
population 13 4 8.8 3 2
p n/a 9 4 n/a 3 1 24 6a 46 9b 11 5 11 2 n/a 8.3j,c n/a n/a 6 1 35 5
MRI exams per 1,000 population 27 6 52.8 42 7p 60 3 90 9 n/a 30 5 n/a n/a 50 0b n/a n/a n/a n/a n/a n/a 106 9
IT, 2015 Physicians’ use of EMRs
(% of primary care physicians)f 92% 73% n/a n/a 75% 84% n/a n/a n/a 98% 100% 99% n/a 99% 54% 98% 84%
Health risk factors, 2013
(unless
otherwise noted)
Percentage of adults who report
being daily smokers 12.8% 14 9% 28.1%q 17% 24 1%a 20 9% 16 2% 21 1% 19 3% 18.5% 15 5% 15 0% 13 3%k 10 7% 20 4%a 20 0%a 13 7% Obesity (BMI>30) prevalence 28.3%b 25.8% 11 9%q 14 2%n 14 5%a,n 23 6% 15 7%n 10 3%n 3 7% 11 1%n 30 6% 10 0%a,n 10.8%k,c 11 7%n 10 3%a,n 24 9% 35 3%a
Source: OECD Health Data 2015 (November) unless otherwise noted. a 2012.
b 2011. c 2010.
d Adjusted for differences in the cost of living.
e Current spending only, and excludes spending on capital formation of health care providers. f Commonwealth 2015 Survey of Primary Care Physicians.
g Source: World Bank, 2014.
h Source: World Bank, 2014; 2005 purchasing power parity (PPP) adjustment. i Source: World Bank, 2014; may include chronic care beds as well as acute care beds. j Source: World Health Organization, 2014.
k Source: Singapore Health Promotion Board, 2014. l 2009–12.
m 2009–11.
n Self-reported as opposed to measured data.
o China indicators are from China Health and Family Planning Statistical Yearbook 2014 unless otherwise noted.
p Calculated by using data from China Health and Family Planning Statistical Yearbook and Gu, X., D. He, X. Hu et al., Forecast analysis of MRI allocation in China. China Health Resources 2013, 16(1):41–43.
q National Health and Family Planning Commission of China, 2015. Report on Nutrition and Non-communicable Disease Status of Chinese Residents 2015.
The Commonwealth Fund
[image:8.792.31.768.51.424.2]8
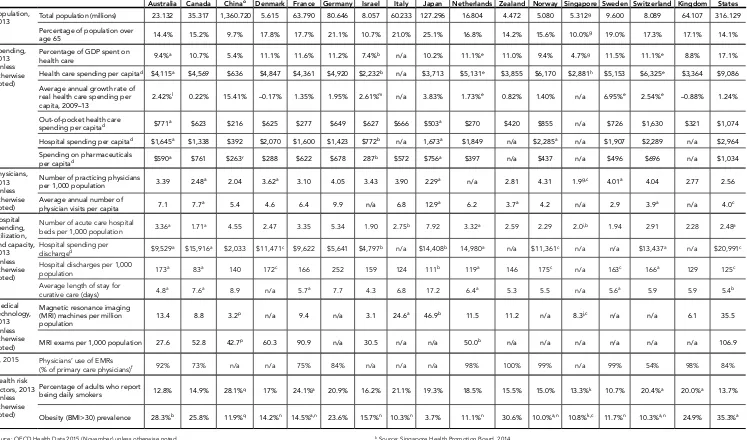
Table 3. Selected Health System Performance Indicators for 11 Countries
Australia Canada France Germany Netherlands New
Zealand Norway Sweden Switzerland
United Kingdom
United States Adults’ access to
care, 2013 Able to get same-day/next-day appointment when sick 58% 41% 57% 76% 63% 72% 52% 58% n/a 52% 48%
Very/somewhat easy getting care after hours 46% 38% 36% 56% 56% 54% 58% 35% 49% 69% 39%
Waited 2 months or more for specialist appointmenta 18% 29% 18% 10% 3% 19% 26% 17% 3% 7% 6%
Waited 4 months or more for elective surgeryb 10% 18% 4% 3% 1% 15% 22% 6% 4% n/a 7%
Experienced access barrier because of cost in past yearc 16% 13% 18% 15% 22% 21% 10% 6% 13% 4% 37%
Safety problems among sicker
adults, 2014o,p Health professional did not review their prescriptions in past year 16% 16% 47% 19% 37% 23% 37% 48% 27% 21% 14%
Care coordination and transitions
among older
adults, 2014o
Experienced a coordination problem in past 2 yearsd 21% 32% 7% 41% 21% 20% 37% 24% 29% 24% 35%
Experienced gaps in hospital discharge planning in past 2 yearse 41% 44% 54% 56% 59% n/a 70% 67% 56% 38% 28%
Chronic care management among older
adults, 2014n,o
Had a treatment plan they could carry out in daily life 80% 76% 62% 30% 41% 64% 53% 41% 47% 73% 83%
Between visits, has health care professional they can contact to ask
questions or to get advice 65% 67% 53% 43% 83% 75% 55% 75% 58% 71% 84%
Primary care
practices receive performance feedback, 2015
Routinely receives and reviews clinical outcomes data 35% 23% 43% 44% 88% 65% 32% 79% 9% 86% 52%
Routinely receives and reviews patient satisfaction and experience data 46% 17% 3% 25% 61% 60% 9% 88% 15% 88% 63%
Routinely receives data comparing performance to other practices 13% 17% 49% 29% 42% 61% 4% 55% 37% 71% 37%
OECD health care
quality indicatorsi Diabetes lower extremity amputation rates per 100,000 population, 2013 4 5 7 4 7 5 9 2 4 7
k 5 9j 5 7 4 1 3 1j 3 1 n/a
Breast cancer five-year survival rate, 2008–2013 (or nearest period) 88%q n/a 86.2% 85.8%r 85.3% 86.0% 89.8%r 89.4% n/a 81.1% 88.9%q
Mortality after admission for acute myocardial infarction
per 100 admissions over age 45, 2013g 4 1m 6 7 7 2 8.7 7 6m,k 6 6 6 7 4 5m 7 7 7 6 5 5
Avoidable deaths,
2013 Mortality amenable to health careh (deaths per 100,000 population) 68k 78k 64k 88 72 89k 69 72 n/a 86 115l Prevention, 2013i
Percentage of children with measles immunization 94% 95% 89% 97% 96% 92% 93% 97% 93% 95% 91%
Percentage of population over age 65 with inluenza immunization n/a 64% 52% 58.6% j 69% 69% 21% 46% 46%l 76% 67%j
Public views of health system,
2013
Works well, minor changes needed 48% 42% 40% 42% 51% 47% 46% 44% 54% 63% 25%
Fundamental changes needed 43% 50% 49% 48% 44% 45% 42% 46% 40% 33% 48%
Needs to be completely rebuilt 9% 8% 11% 10% 5% 8% 12% 10% 7% 4% 27%
Sources (unless noted otherwise): 2013, 2014, and 2015 Commonwealth Fund International Health Policy Surveys. a Base: Saw or needed to see a specialist in past two years.
b Base: Needed elective surgery in past two years.
c Did not ill/skipped prescription, did not visit doctor with medical problem, and/or did not get recommended care. d Test results/medical records not available at time of appointment and/or doctors ordered medical test that had already been done; received conlicting information from different doctors; and/or specialist lacked medical history or regular doctor was not
informed about specialist care.
e When discharged from the hospital: you did not receive written information about what to do when you returned home and symptoms to watch for; hospital did not make sure you had arrangements for follow-up care; someone did not discuss with you the purpose of taking each medication; and/or you did not know who to contact if you had a question about your condi -tion or treatment. Base: hospitalized overnight in the past two years.
f Base: Has a regular doctor or place of care.
g In-hospital case-fatality rates within 30 days of admission.
h Source: WHO Mortality iles (number of deaths by age group) and populations (except Human Mortality Database for CAN, UK, and US). List of amenable causes: Nolte E, McKee M. Variations in amenable mortality—Trends in 16 high-income nations. Health Policy. 2011 Sep.
i Source: OECD Health Data 2015. j 2012.
k 2011. l 2010.
m Admissions resulting in a transfer are included. n Who had at least one chronic condition. o Age 65 or older.
p Who are taking four or more prescription medications regularly. q 2006–11.
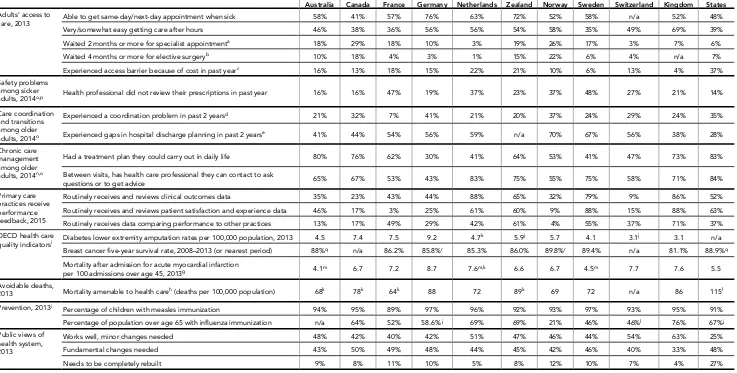
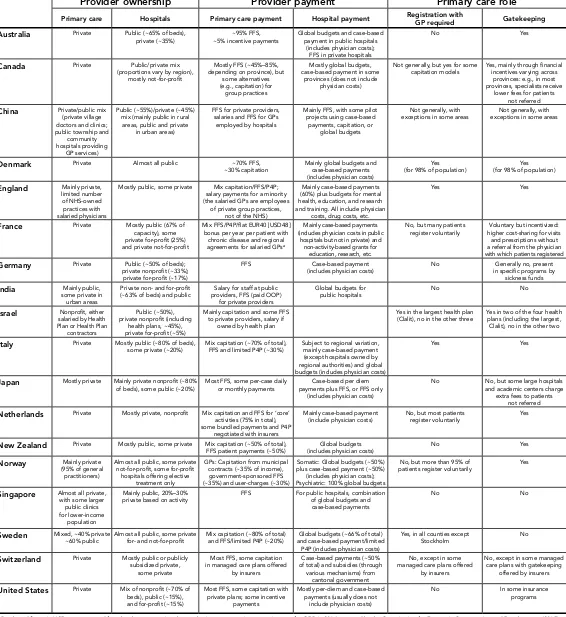
Table 4. Provider Organization and Payment in 18 Countries
Provider ownership Provider payment Primary care role
Primary care Hospitals Primary care payment Hospital payment Registration with GP required Gatekeeping
Australia Private Public (~65% of beds),
private (~35%) ~5% incentive payments~95% FFS, Global budgets and case-based payment in public hospitals (includes physician costs);
FFS in private hospitals
No Yes
Canada Private Public/private mix (proportions vary by region),
mostly not-for-profit
Mostly FFS (~45%–85%, depending on province), but
some alternatives
(e.g., capitation) for group practices
Mostly global budgets, case-based payment in some
provinces (does not include physician costs)
Not generally, but yes for some
capitation models Yes, mainly through financial incentives varying across provinces: e.g., in most provinces, specialists receive
lower fees for patients not referred
China Private/public mix
(private village doctors and clinics; public township and
community
hospitals providing GP services)
Public (~55%)/private (~45%) mix (mainly public in rural
areas, public and private in urban areas)
FFS for private providers, salaries and FFS for GPs
employed by hospitals
Mainly FFS, with some pilot projects using case-based
payments, capitation, or global budgets
Not generally, with
exceptions in some areas exceptions in some areasNot generally, with
Denmark Private Almost all public ~70% FFS,
~30% capitation Mainly global budgets and case-based payments (includes physician costs)
Yes
(for 98% of population) (for 98% of population)Yes
England Mainly private,
limited number
of NHS-owned practices with salaried physicians
Mostly public, some private Mix capitation/FFS/P4P; salary payments for a minority (the salaried GPs are employees
of private group practices, not of the NHS)
Mainly case-based payments (60%) plus budgets for mental health, education, and research and training. All include physician
costs, drug costs, etc.
Yes Yes
France Private Mostly public (67% of capacity), some private for-profit (25%) and private not-for-profit
Mix FFS/P4P/lat EUR40 [USD48] bonus per year per patient with
chronic disease and regional agreements for salaried GPsa
Mainly case-based payments (includes physician costs in public
hospitals but not in private) and non-activity-based grants for
education, research, etc.
No, but many patients
register voluntarily higher cost-sharing for visits Voluntary but incentivized: and prescriptions without a referral from the physician with which patients registered
Germany Private Public (~50% of beds);
private nonprofit (~33%); private for-profit (~17%)
FFS Case-based payment
(includes physician costs) No in specific programs by Generally no, present sickness funds
India Mainly public,
some private in
urban areas
Private non- and for-profit
(~63% of beds) and public providers, FFS (paid OOP) Salary for staff at public for private providers
Global budgets for
public hospitals No No
Israel Nonprofit, either
salaried by Health Plan or Health Plan
contractors
Public (~50%), private nonprofit (including
health plans, ~45%), private for-profit (~5%)
Mainly capitation and some FFS to private providers, salary if
owned by health plan
Yes in the largest health plan
(Clalit), no in the other three Yes in two of the four health plans (including the largest, Clalit), no in the other two
Italy Private Mostly public (~80% of beds),
some private (~20%) Mix capitation (~70% of total), FFS and limited P4P (~30%) Subject to regional variation, mainly case-based payment (except hospitals owned by regional authorities) and global budgets (includes physician costs)
Yes Yes
Japan Mostly private Mainly private nonprofit (~80%
of beds), some public (~20%) Most FFS, some per-case daily or monthly payments payments plus FFS, or FFS only Case-based per diem (includes physician costs)
No No, but some large hospitals and academic centers charge
extra fees to patients not referred
Netherlands Private Mostly private, nonprofit Mix capitation and FFS for ‘core’ activities (75% in total), some bundled payments and P4P
negotiated with insurers
Mainly case-based payment
(include physician costs) No, but most patients register voluntarily Yes
New Zealand Private Mostly public, some private Mix capitation (~50% of total),
FFS patient payments (~50%) (includes physician costs)Global budgets No Yes
Norway Mainly private
(95% of general practitioners)
Almost all public, some private not-for-profit, some for-profit
hospitals offering elective
treatment only
GPs: Capitation from municipal contracts (~35% of income), government-sponsored FFS (~35%) and user-charges (~30%)
Somatic: Global budgets (~50%) plus case-based payment (~50%)
(includes physician costs); Psychiatric: 100% global budgets
No, but more than 95% of
patients register voluntarily Yes
Singapore Almost all private,
with some larger public clinics for lower-income
population
Mainly public, 20%–30%
private based on activity FFS For public hospitals, combination of global budgets and case-based payments
No No
Sweden Mixed, ~40% private
~60% public Almost all public, some private for- and not-for-profit Mix capitation (~80% of total) and FFS/limited P4P (~20%) and case-based payment/limited Global budgets (~66% of total) P4P (includes physician costs)
Yes, in all counties except
Stockholm No
Switzerland Private Mostly public or publicly
subsidized private, some private
Most FFS, some capitation in managed care plans offered
by insurers
Case-based payments (~50% of total) and subsidies (through
various mechanisms) from cantonal government
No, except in some managed care plans offered
by insurers
No, except in some managed care plans with gatekeeping
offered by insurers
United States Private Mix of nonprofit (~70% of beds), public (~15%), and for-profit (~15%)
Most FFS, some capitation with private plans; some incentive
payments
Mostly per-diem and case-based payments (usually does not
include physician costs)
No In some insurance
programs
a Bracketed figure in USD was converted from local currency using the purchasing power parity conversion rate for GDP in 2014 reported by the Organisation for Economic Co-operation and Development (2015).
What is the role of government?
Three levels of government are collectively responsible for providing universal health care: federal; state and territory; and local. The federal government mainly provides funding and indirect support to the states and health professions, subsidizing primary care providers through the Medicare Benefits Scheme (MBS) and the Pharmaceutical Benefits Scheme (PBS) and providing funds for state services. It has only a limited role in direct service delivery.
States have the majority responsibility for public hospitals, ambulance services, public dental care, community health services, and mental health care. They contribute their own funding in addition to that provided by federal government. Local governments play a role in the delivery of community health and preventive health programs, such as immunization and regulation of food standards (Department of the Prime Minister and Cabinet, 2015).
Who is covered and how is insurance financed?
Publicly financed health insurance: Total health expenditure in 2013–2014 represented 9.8 percent of gross domestic product (GDP), an increase of 3.1 percent from 2012–2013. Two thirds of this expenditure (67.8%) came from 2012–2013 (Australian Institute of Health and Welfare [AIHW], 2015).
The federal government funds Medicare, a universal public health insurance program providing free or subsidized access to care for Australian citizens, residents with a permanent visa, and New Zealand citizens following their enrollment in the program and confirmation of identity (AIHW, 2014). Restricted access is provided to citizens of certain other countries through formal agreements (Department of Human Services [DHS], 2015). Other visitors to Australia do not have access to Medicare. Government funding is raised an estimated AUD10.3 billion (USD6.7 billion) in 2013–2014 (The Commonwealth of Australia, 2013). (In July 2014, the levy was expanded to raise funds for disability care.)
Private health insurance: Private health insurance (PHI) is readily available and offers more choice of providers (particularly in hospitals), faster access for nonemergency services, and rebates for selected services.
Government policies encourage enrollment in PHI through a tax rebate and, above a certain income, a penalty payment for not having PHI (the Medicare Levy surcharge) (PHIO, 2015). The Lifetime Health Coverage program provides a lower premium for life if participants sign up before age 31. There is a 2 percent increase in the base premium for every year after age 30 for people who do not sign up. Consequently, take-up is highest for this age group but rapidly drops off as age increases, with a trend to opt out at age 50 and up.
Nearly half of the Australian population (47%) had private hospital coverage and nearly 56 percent had general treatment coverage in 2015 (Private Health Insurance Administration Council, 2015).
Insurers are a mix of for-profit and nonprofit providers. In 2013–2014, private health insurance expenditures represented 8.3 percent of all health spending (AIHW, 2015).
Private health insurance can include coverage for hospital, general treatment, or ambulance services. When accessing hospital services, patients can opt to be treated as a public patient (with full fee coverage) or as a private patient (with 75% fee coverage). For private patients, insurance covers the MBS fee. If a provider charges above the MBS fee, the consumer will bear the gap cost unless they have gap coverage. The patient
The Australian Health Care System, 2015
The Commonwealth Fund
12
may also be charged for costs such as hospital accommodation, surgery fees (implants and theater fees), and
diagnostic tests.
General coverage provides insurance for dental, physiotherapy, chiropractic, podiatry, home nursing, and optometry services. Coverage may be capped by dollar amount or number of services.
Private health insurance coverage varies by socioeconomic status. PHI covers just one-third of the most disadvantaged 20 percent of the population, a proportion that rises to more than 79 percent for the most advantaged population quintile. This disparity is due in part to the Medicare Levy surcharge applied to higher-income earners (Australian Bureau of Statistics [ABS], 2013).
What is covered?
Services: The federal government defines Medicare benefits, which include hospital care, medical services,
and pharmaceuticals, to name a few. States provide further funding and are responsible for the delivery of free public hospital services, including subsidies and incentive payments in the areas of prevention, chronic disease
management, and mental health care. The MBS provides for limited optometry and children’s dental care.
Pharmaceutical subsidies are provided through the PBS. Pharmaceuticals need to be approved for cost-effectiveness by the independent Pharmaceutical Benefits Advisory Committee (PBAC) to be listed. War veterans, the widowed, and their dependents may be eligible for the Repatriation PBS (DHS, 2015).
Nearly half (49%) of federal support for mental health is for payments to people with a disability; remaining
support goes to payments to states, payments and allowances for caregivers, and subsidies provided through
the MBS and PBS (National Mental Health Commission, 2014). State governments are responsible for specialist
and acute mental care services.
Home care for the elderly and hospice care coverage are described below in the section “How is the delivery system organized and financed?”
Cost-sharing and out-of-pocket spending: Out-of-pocket payments accounted for 18 percent of total health expenditures in 2013–2014. The largest share (38%) was for medications, followed by dental care (20%), medical services (e.g., referred and unreferred private health insurance), medical aids and equipment, and other health practitioner services (AIHW, 2015).
There are no deductibles or out-of-pocket costs for public patients receiving public hospital services. General
practitioner (GP) visits are subsidized at 100 percent of the MBS fee, and specialist visits at 85 percent. GPs and specialists can choose whether to charge above the MBS fee. About 83 percent of GP visits were provided without charge to the patient in 2014–2015. Patients who were charged paid an average of AUD31 (USD20) (DH, 2015).
Out-of-pocket pharmaceutical expenditures are capped. In 2015 the maximum cost per prescription for low-income earners was set at AUD6.10 (USD3.97) with an annual cap of AUD366 (USD238). For the general population, the cap per prescription is AUD37.70 (USD24.55) per prescription, which reverts to the low-income rate cap if they incur more than AUD1,454 (USD947) in out-of-pocket expenditure within a year.1
Consumers pay
the full price of medicines not listed on the PBS. Pharmaceuticals provided to inpatients in public hospitals are
generally free.
Safety nets: Beginning in January 2016, a new Medicare Safety Net will replace the previous Original Medicare Safety Net, the Extended Medicare Safety Net, and the Greatest Permissible Gap arrangements. Medicare will reimburse 80 percent of out-of-pocket costs (up to a cap of 150 percent of the MBS fee) for the remainder of the calendar year once annual thresholds are met: AUD400 (USD260) for concessional patients (including
1
Please note that, throughout this profile, all figures in USD were converted from AUD at a rate of about AUD1.54 per USD, the purchasing power parity conversion rate for GDP in 2014 reported by OECD (2015) for Australia.
AUSTRALIA
low-income adults, children under 16, and certain veterans); AUD700 (USD456) for parents of school children and singles; and AUD1,000 (USD651) for all other families.
How is the delivery system organized and financed?
Primary care: In 2013, there were 25,702 GPs, and a slightly higher number of specialists (27,279) (AIHW, 2015a). GPs are typically self-employed, with about four per practice on average (DH, 2015, and DHS, 2015). In 2012 those in nonmanagerial positions earned an average of AUD2,862 (USD1,864) per week. The schedule of service fees is set by the federal health minister through the MBS.
Registration with a GP is not required, and patients choose their primary care doctor. GPs operate as
gatekeepers, in that a referral to a specialist is needed for a patient to receive the MBS subsidy for specialist services. The fee-for-service MBS model accounts for the majority of federal expenditures on GPs, while the Practice Incentives Program (PIP) accounts for 5.5 percent (ANAO, 2010).
State community health centers usually employ a multidisciplinary provider team. The federal government
provides financial incentives for the accreditation of GPs, multidisciplinary care approaches, and care
coordination through PIP and through funding of GP Super Clinics and Primary Health Networks (PHNs). PHNs (which replace Medicare Locals) are being implemented in 2015–2016 to support more efficient, effective, and
coordinated primary care.
The number of nurses working in primary care has been increasing, from 8,649 registered or enrolled nurses primarily working in a general practice setting in 2011 to 11,370 in 2014. Their role has been expanding with the support of the PIP practice nurse payment. Beyond this, nurses are funded through practice earnings.
Nurses in general practice settings provide chronic disease management and care coordination, preventive
health education, and oversight of patient follow-up and reminder systems (Health Workforce Australia [HWA], 2015).
Outpatient specialist care: Specialists delivering outpatient care are either self-employed in a solo private
practice (6,745 specialists in 2013) or employed in a group practice (5,257) (HWA, 2015). Patients are able to choose which specialist they see, but must be referred by their GP to receive MBS subsidies. Specialists are paid on a fee-for-service basis. They receive a subsidy through the MBS of 85 percent of the schedule fee and set their patients’ out-of-pocket fees independently. Many specialists split their time between private and public
practice.
Administrative mechanisms for direct patient payments to providers: Many practices have the technology
to process claims electronically so that reimbursements from public and private payers are instantaneous, and
patients pay only their copayment (if the provider charges above the MBS fee). If the technology is not in place, patients pay the full fee and seek reimbursement from Medicare and/or their private insurer.
After-hours care: GPs are required to ensure that after-hours care is available to patients, but are not required
to provide care directly. They must demonstrate that processes are in place for patients to obtain information about after-hours care, and that patients can contact them in an emergency. After-hours walk-in services are available, and may be provided in a primary care setting or within hospitals. As there is free access to emergency departments, these also may be utilized for after-hours primary care.
The federal government provides varying levels of practice incentives for after-hours care, depending on whether access is direct or provided indirectly through arrangements with other practitioners in the area.
Government also funds PHNs to support and coordinate after-hours services, and there is an after-hours advice
and support line.
The Commonwealth Fund
14
Public hospitals receive a majority of funding (91%) from federal and state governments, with the remainder coming from private patients and their insurers. Most of the funding (62% of the total) is for public physician salaries. Private physicians providing public services are paid on a per-session or fee-for-service basis. Private hospitals receive most of their funding from insurers (47%), federal government’s rebate on health insurance premiums (21%), and private patients (12%) (AIHW, 2014b).
Public hospitals are organized into Local Hospital Networks (LHNs), of which there were 138 in 2013–2014.
These vary in size, depending on the population they serve and the extent to which linking services and
specialties on a regional basis is beneficial. In major urban areas, a number of LHNs comprise just one hospital.
State governments fund their public hospitals largely on an activity basis using diagnosis-related groups.
Federal funding for public hospitals includes a base level of funding, with growth funding set at 45 percent of the “efficient price of services” of activities, determined by the Independent Hospital Pricing Authority (IHPA [http://www.ihpa.gov.au]). States are required to cover the remaining cost of services, providing an
incentive to keep costs at the efficient price or lower. Small rural hospitals are funded through block grants
(IHPA, 2015). Starting in July 2017, the federal government will return to block-grant funding for all hospitals.
Mental health care: Mental health services are provided in many different ways, including by GPs and
specialists, in community-based care, in hospitals (both in- and outpatient, public and private), and in residential care. GPs provide general care and may devise treatment plans of their own or refer patients to specialists. Specialist care and pharmaceuticals are subsidized through the MBS and PBS.
State governments fund and deliver acute mental health and psychiatric care in hospitals, community-based
services, and specialized residential care. Public hospital-based care is free to public patients (AIHW, 2015b).
The federal government has commissioned the National Mental Health Commission to undertake a review of all existing services (NMHC, 2015).
Long-term care and social supports: The majority of people living in their own homes with severe or profound
limitations in core activities receive informal care (92%). Thirty-eight percent receive only informal assistance and 54 percent receive a combination of informal and formal assistance. In 2009, 12 percent of Australians were informal caregivers and around 30 percent of those were the primary caregiver (carer). In 2011–2012, federal government provided AUD3.18 billion (USD2.07 billion) under the income-tested Carer Payment program, and AUD1.75 billion (USD1.14 billion) through the Carer Allowance (not income-tested, and offered as a supplement for daily care). Government also provides an annual Carer Supplement of AUD480 million (USD313 million) to help with the cost of caring. Recipients of the Carer Allowance who care for a child under the age of 16 receive an annual Child Disability Assistance Payment of AUD1,000 (USD651). There are also a number of respite programs providing further support for caregivers (AIHW, 2013).
Home care for the elderly is provided through the Commonwealth Home Support Program in all states except
Western Australia. Subsidies are income-tested and may require copayments from recipients. Services can include assistance with housework, basic care, physical activity, nursing, and allied health. The program began
in July 2015 as a consolidation of home and community care, planned respite for caregivers, day therapy, and assistance with care and housing (Department of Social Services, 2015). The Western Australian Government administers and delivers its Home and Community Care Program with funding support from
federal government.
Aged care homes may be private nonprofit or for-profit, or run by state or local governments. Federally subsidized residential aged care positions are available for those who are approved by an Aged Care Assessment Team. Hospice care is provided by states through complementary programs funded by the Commonwealth. The Australian Government supports both permanent and respite residential aged care.
Eligibility is determined through a needs assessment, and permanent care is means-tested (AIHW, 2015c).
AUSTRALIA
In 2013, the federal government, in partnership with states, implemented the pilot phase of the National Disability Insurance Scheme. The scheme provides more-flexible funding support (not means-tested), allowing
greater tailoring of services.
What are the key entities for health system governance?
Intergovernmental collaboration and decision-making at the federal level occur through the Council
of Australian Governments (COAG), with representation from the Prime Minister and first ministers of each state. The COAG focuses on the highest-priority issues, such as major funding discussions and the interchange
of roles and responsibilities between governments. The COAG Health Council is responsible for more detailed policy issues and is supported by the Australian Health Ministers Advisory Council (http://www.
coaghealthcouncil.gov.au/).
The federal Department of Health (DH) oversees national policies and programs such as the MBS and PBS. Payments through these schemes are administered by the Department of Human Services. The PBAC provides advice to the Minister for Health on the cost-effectiveness of new pharmaceuticals (but not routinely on delisting).
Several national agencies and the state governments are responsible for quality and safety of care (see below). The AIHW and the Australian Bureau of Statistics (ABS) are the major providers of health data.
Regulatory oversight is provided by a number of agencies, such as the Therapeutic Goods Administration, which oversees supply, imports, exports, manufacturing, and advertisement; the Australian Health Practitioner Regulation Agency, which ensures registration and accreditation of the workforce in partnership with National Boards; and the Australian Prudential Regulation Authority, for private health insurance. The Australian
Competition and Consumer Commission promotes competition among private health insurers. Beginning
in July 2016, the Australian eHealth Commission will take over responsibility from the National eHealth
Transition Authority for matters relating to electronic health data.
State governments operate their own departments of health, and have devolved management of hospitals
to the LHNs. The LHNs are responsible for working collaboratively with PHNs. There are patient–consumer
organizations and groups operating at the national and state level.
What are the major strategies to ensure quality of care?
The overarching strategy to ensure quality of care is captured in the National Healthcare Agreement of the
COAG (2012). The agreement sets out the common objective of Australian governments in providing health care—improving outcomes for all and the sustainability of the system—and the performance indicators and
benchmarks on which progress is assessed. It also sets out national-priority policy directions, programs, and areas for reform, such as major chronic diseases and their risk factors. Indicators and benchmarks in the agreement address issues of quality from primary to tertiary care and include disease-specific targets of high priority, as well as general benchmarks.
The Australian Commission on Safety and Quality in Health Care (ACSQH) is the main body responsible for
safety and quality improvement in health care. The ACSQH has developed service standards that have been
endorsed by health ministers (DH, Portfolio Budget Statement 2015–16). These include standards for
conducting patient surveys, which must be met by hospitals and day surgery centers for accreditation. The ABS, the national government statistical body, also undertakes an annual patient experience survey.
The Australian Council on Healthcare Standards is the (nongovernment) agency authorized to accredit provider
institutions. States license and register private hospitals and the health workforce, legislate on the operation of
public hospitals, and work collaboratively through a National Registration and Accreditation Scheme facilitating
The Commonwealth Fund
16
The Royal Australian College of General Practitioners has responsibility for accrediting GPs. The MBS includes financial incentives such as the PIP, and approximately 85 percent of GPs are accredited. To be eligible for
government subsidies, aged care services must be accredited by the government-owned Aged Care Standards and Accreditation Agency.
There are a number of disease and device registries. Government-funded registries are housed in universities and nongovernmental organizations, as well as within state governments. ACSQH has developed a national framework to support consistent registries.
The National Health Performance Authority reports on the comparable performance of LHNs, public and private hospitals, and other key health service providers. The reporting framework was agreed to by the COAG, and
includes measures of equity, effectiveness, and efficiency.
The federal government has regulatory oversight of quarantine, blood supply, pharmaceuticals, and therapeutic
goods and appliances (AIHW, 2014). In addition, there are a number of national bodies who promote quality
and safety of care through evidence-based clinical guidelines and best-practice advice. They include the
National Health and Medical Research Council and Cancer Australia.
State Health Ministers COAG Health Council
State-run aged care services Public community health services Local hospital networks Public hospitals (including outpatients) Public dental services (including hospitals) Medical and pharmaceutical benefits to patients Primary health networks Community Pharmacy Agreement with Pharmacy Guild of Australia
Australian Health Ministers Advisory Council Council of Australian Governments (COAG)
Key regulatory bodies
Aged Care Standards & Accreditation Agency Australian Health Practitioner Regulation Agency Australian Prudential Regulatory Authority (in Treasury portfolio with oversight of private health insurers) Australian Radiation Protection & Nuclear Safety Authority Food Standards Australia New Zealand Therapeutic Goods Administration
Federal Health Minister
State Premiers & Cabinets Prime Minister & Cabinet
State Parliaments Australian Parliament
Organization of the Health System in Australia
Source: L Glover, 2015
Hierarchical (may include funding)
Negotiation
AUSTRALIA
What is being done to reduce disparities?
The most prominent disparities in health outcomes are between the Aboriginal and Torres Strait Islander
population and the rest of Australia’s population; these are widely acknowledged as unacceptable. In 2008, the COAG agreed to a target date of 2031 for closing the gap in life expectancy. Its strategy goes beyond health care, seeking to address disparities in other areas such as education and housing. The Prime Minister makes an annual statement to Parliament on progress toward closing the gap.
Disparities between major urban centers and rural and remote regions and across socioeconomic groups are
also major challenges. The federal government provides incentives to encourage GPs and other health workers
to work in rural and remote areas, where it can be very difficult to attract a sufficient number of practitioners. This challenge is also addressed to an extent through the use of telemedicine. Since 1999, the Australian
Government has funded the Public Health Information Development Unit (www.publichealth.gov.au) for the
purpose of publishing small-area data showing disparities in access to health services and health outcomes on a geographic and socioeconomic basis.
What is being done to promote delivery system integration and
care coordination?
Approaches to improving integration and care coordination include the PIP, which provides a financial incentive
to providers for the development of care plans for patients with certain conditions, such as asthma, diabetes,
and mental health needs. The PHNs were established in July 2015 with the objective of improving coordinated
care, as well as the efficiency and effectiveness of care for those at risk of poor health outcomes. These networks are funded through grants from the federal government and will work directly with primary care
providers, health care specialists, and LHNs. Care also may be coordinated by Aboriginal health and community
health services.
What is the status of electronic health records?
The National eHealth Transition Authority has been working to establish interoperable infrastructure to support communication across the health care system. A national e-health program based on personally controlled
unique identifiers has commenced operation in Australia, and 2.5 million patients and nearly 8,000 providers have registered (DH, 2015a). The record supports prescription information, medical notes, referrals, and
diagnostic imaging reports. Following a review, government is taking a number of steps to increase uptake by both patients and providers, which has been poor to date, by improving usability, clinical utility, governance, and operations. In addition, an opt-out approach will be tested to replace the current opt-in approach. The new
Australian Commission for eHealth will begin oversight in July 2016, taking on the e-health roles of the Department of Health and the National eHealth Transition Authority. The current PIP eHealth Incentive, which aims to encourage GPs to participate, also will be reviewed for potential improvements.
How are costs contained?
The major drivers of cost growth are the MBS and PBS. Government regularly considers opportunities to reduce spending growth in the MBS through its annual budget process and has established an expert panel to
undertake a review of the entire schedule and report by the end of 2016.
Government influences the cost of the PBS in making determinations about what pharmaceuticals to list on the
scheme and in negotiating the price with suppliers. Government provides funds to pharmacies for dispensing
The Commonwealth Fund
18
Hospital funding is set through policy decisions by the federal government, with states required to manage funding within their budgets.
Through the 2015–2016 budget, the federal government also consolidated the back-office functions of a number of its health agencies to generate AUD106 million (USD69 million) in savings. Beyond these measures,
the major control is through the capacity constraints of the health system, such as workforce supply.
What major innovations and reforms have been introduced?
In 2015, the federal government announced a number of reforms to primary care, including implementation of the aforementioned PHNs and the MBS Review. In addition, the government has established the Primary Health
Care Advisory Group to consider innovations to funding and service delivery for people with complex and chronic illness, including mental health. Together, these three reforms seek to ensure that primary care is being
delivered efficiently and effectively and that Medicare is put on a sustainable funding trajectory. The group’s advice, which was submitted to the government at the end of 2015, will consider how to best utilize the PHNs.
The government is also reforming care for the aging. In addition to the implementation of the Commonwealth Home Support program outlined above, a new funding model is pursued whereby allocations will be made directly to consumers based on their care needs instead of directly to service providers, affording them greater
choice in providers and stimulating provider competition. This reform will take effect in February 2017.
AUSTRALIA
References
Australian Bureau of Statistics, Australian Government (2013). “Cat no: 4364.0.55.002 - Australian Health Survey: Health Service Usage and Health Related Actions, 2011–12.” ABS: Canberra.
Australian National Audit Office (2010). Audit Report No. 5 2010–11. Performance Audit: Practice Incentives Program. Canberra: ANAO.
Australian Taxation Office, Australian Government. https://www.ato.gov.au/General/New-legislation/In-detail/Direct-taxes/ Income-tax-for-individuals/Net-medical-expenses-tax-offset-phase-out/. Accessed Nov. 16, 2015.
Australia’s Institute of Health and Welfare (AIHW), Australian Government (2015). “Health Expenditure Australia 2013–14.”
Canberra: AIHW.
AIHW, Australian Government (2015a). “Medical Workforce 2013 Detailed Tables, Table 4.” Accessed Aug. 12, 2015.
Canberra: AIHW.
AIHW, Australian Government (2015b). “Mental Health Services in Australia.” https://mhsa.aihw.gov.au/home/. Accessed
Nov. 18, 2015.
AIHW, Australian Government (2015c). http://www.aihw.gov.au/aged-care/residential-and-community-2011-12/aged-care-in-australia/. Accessed Nov. 18, 2015.
AIHW, Australian Government (2014). “Australia’s Health 2014.” Canberra: AIHW.
AIHW, Australian Government (2014a). “Australia’s Hospitals 2013–14 at a glance.” Canberra: AIHW.
AIHW, Australian Government (2014b). “Hospital resources 2013–14: Australian hospital statistics.” Canberra: AIHW. AIHW, Australian Government (2013). “Australia’s Welfare.” Canberra: AIHW.
The Commonwealth of Australia (2013). “Budget Paper No. 1: Budget Strategy and Outlook 2013-14.” The Commonwealth
of Australia: Canberra. http://www.budget.gov.au/2013-14/content/bp1/download/bp1_consolidated.pdf. Accessed Dec. 9,
2015.
Department of the Prime Minister and Cabinet, Australian Government (2015). “Reform of the Federation White Paper: Roles and Responsibilities in Health. Issues Paper 3.” Canberra, DPMC.
Department of Health, Australian Government (2015). General Practice Workforce Statistics. http://www.health.gov.au/ internet/main/publishing.nsf/content/F210D973E08C0193CA257BF0001B5F1F/$File/GP%20Workforce%20Statistics%20 2013-14%20PUBLIC%20Web%20version.pdf. Accessed Aug. 12, 2015.
Department of Health, Australian Government (2015a). http://www.ehealth.gov.au/internet/ehealth/publishing.nsf/Content/ pcehr-statistics. Accessed Nov. 16, 2015.
Department of Human Services, Australian Government (2015). http://www.humanservices.gov.au/. Accessed Nov. 16, 2015. Department of Human Services, Australian Government (2015). http://medicarestatistics.humanservices.gov.au/statistics/ do.jsp?_PROGRAM=%2Fstatistics%2Fdgp_report_selector&statisticF=count&reportTypeFH=report&variableF=&drillTypeFH= on&DIVISIONS=&DGPSORT=divgp&groupF=999&schemeF=PIP&reportNameFH=piprrma&reportFormatF=by+time+period &reportPeriodF=quarter&startDateF=201310&endDateF=201312. Accessed Aug. 12, 2015.
Department of Social Services (2015). https://www.dss.gov.au/our-responsibilities/ageing-and-aged-care/aged-care-reform/ commonwealth-home-support-programme#03. Accessed Sept. 6, 2015.
Health Workforce Australia, Australian Government. http://data.hwa.gov.au/webapi/jsf/tableView/tableView.xhtml. Accessed
Sept. 6, 2015.
Independent Hospital Pricing Authority (2015). “National Efficient Price Determination 2015-16.” IHPA: Sydney.
Ley, Susan (2015). Media release by Susan Ley (Minister for Health): “Pharmaceutical Benefits Scheme to be reformed.”
Accessed Sept. 6 from: https://www.health.gov.au/internet/ministers/publishing.nsf/Content/FDA6A9682797EDD7CA257E52 001F423C/$File/SL063.pdf.
National Mental Health Commission, Australian Government (2014). “Contributing lives, thriving communities: Report of the National Review of Mental Health Programmes and Services.” NMHC: Canberra.
Private Health Insurance Administration Council, Australian Government (2015). “Statistics: Private Health Insurance Membership and Coverage, Sept. 2015.” PHIAC: Sydney.
The Canadian Health Care System, 2015
Sara Allin and David Rudoler
University of Toronto
What is the role of government?
Provinces and territories in Canada have primary responsibility for organizing and delivering health services and supervising providers. Many have established regional health authorities that plan and deliver publicly funded
services locally. Generally, those authorities are responsible for the funding and delivery of hospital, community, and long-term care, as well as mental and public health services. Nearly all health care providers are private. The federal government cofinances provincial and territorial programs, which must adhere to the five underlying
principles of the Canada Health Act—the law that sets standards for medically necessary hospital, diagnostic,
and physician services. These principles state that each provincial health care insurance plan needs to be:
1) publicly administered; 2) comprehensive in coverage; 3) universal; 4) portable across provinces; and 5) accessible (i.e., without user fees).
The federal government also regulates the safety and efficacy of medical devices, pharmaceuticals, and natural
health products; funds health research; administers a range of services for certain populations, including First Nations, Inuit, Métis, and inmates in federal penitentiaries; and administers several public health functions.
Who is covered and how is insurance financed?
Publicly financed health care: Total and public health expenditures were forecast to account for an estimated
10.9 percent and 8.0 percent of GDP, respectively, in 2015; by that measure, 70.7 percent of total health spending comes from public sources (Canadian Institute for Health Information, 2015a). The provinces and
territories administer their own universal health insurance programs, covering all provincial and territorial
residents according to their own residency requirements (Health Canada, 2013a). Temporary legal visitors, undocumented immigrants (including denied refugee claimants), those who stay in Canada beyond the duration
of a legal permit, and those who enter the country “illegally,” are not covered by any federal or provincial program, although provinces and territories provide some limited services.
The main funding sources are general provincial and territorial spending, which was forecast to constitute
93 percent of public health spending in 2015 (Canadian Institute for Health Information, 2015a). The federal
government contributes cash funding to the provinces and territories on a per capita basis through the Canada
Health Transfer, which totaled CAD34 billion (USD27 billion) in 2015–2016, accounting for an estimated
24 percent of total provincial and territorial health expenditures (Canadian Institute for Health Information, 2015a; Government of Canada, 2015a).1
Privately financed health care: Private insurance, held by about two-thirds of Canadians, covers services
excluded from public reimbursement, such as vision and dental care, prescription drugs, rehabilitation services,
home care, and private rooms in hospitals. In 2013, approximately 90 percent of premiums for private health plans were paid through group contracts with employers, unions, or other organizations (Canadian Life and Health Insurance Association, 2014). In 2015, private health insurance accounted for approximately 12 percent of total health spending (Canadian Institute for Health Information, 2015a). The majority of insurers are
for-profit.
1
The Commonwealth Fund
22
What is covered?
Services: To qualify for federal financial contributions under the Canada Health Transfer, provincial and territorial insurance plans must provide first-dollar coverage of medically necessary physician, diagnostic, and hospital
services (including inpatient prescription drugs) for all eligible residents. There is no nationally defined statutory benefits package; most public coverage decisions are made by provincial and territorial governments in
conjunction with the medical profession. Provincial and territorial governments provide varying levels of
additional benefits, such as outpatient prescription drugs, nonphysician mental health care, vision care, dental
care, home health care, and hospice care. They also provide public health and prevention services (including immunizations) as part of their public programs.
Cost-sharing and out-of-pocket spending: There is no cost-sharing for publicly insured physician, diagnostic, and hospital services. All prescription drugs provided in hospitals are covered publicly, with outpatient coverage
varying by province or territory. Physicians are not allowed to charge patients prices above the negotiated fee schedule. In 2012, out-of-pocket payments represented about 14.2 percent of total health spending (Canadian Institute for Health Information, 2015a), going mainly toward prescription drugs (21%), nonhospital institutions (mainly long-term care homes) (22%), dental care (16%), vision care (9%), and over-the-counter medications (10%) (Canadian Institute for Health Information, 2015a).
Safety net: Cost-sharing exemptions for noninsured services such as prescription drugs vary among provinces and territories, and there are no caps on out-of-pocket spending. For example, the prescription drug program
in Ontario exempts low-income seniors and social assistance recipients from all cost-sharing except a CAD2.00 (USD1.60) copayment, which is often waived by pharmacies. Low income is defined as annual household income of less than CAD16,018 (about USD12,700) for single people and less than CAD24,175 (USD19,168) for couples.
There are no caps on out-of-pocket spending. However, the federal Medical Expense Tax Credit supports tax credits for individuals whose medical expenses, for themselves or their dependents, are significant (above 3% of income). A disability tax credit and an attendant care expense deduction also provide relief to individuals (or their dependents) who have prolonged mental or physical impairments, and to those who incur expenses for care that
is needed to allow them to work.
How is the delivery system organized and financed?
Primary care: In 2014, about half of all practicing physicians (2.24 per 1,000 population) were general
practitioners, or GPs (1.14 per 1,000 population) and half were specialists (1.10 per 1,000 population) (Canadian Institute for Health Information, 2015b). Primary care physicians act largely as gatekeepers, and many provinces pay lower fees to specialists for nonreferred consultations. Most physicians are self-employed in private
practices and paid fee-for-service, although there has been a movement toward group practice and alternative
f