T H E J O U R N A L O F H U M A N R E S O U R C E S • 45 • 3
Outcomes
Janet Currie
Mark Stabile
Phongsack Manivong
Leslie L. Roos
A B S T R A C T
Research has shown a strong connection between birth weight and future outcomes. We ask how health problems after birth affect outcomes using data from public health insurance records for 50,000 children born be-tween 1979 and 1987 in the Canadian province of Manitoba. We compare children to siblings born an average of three years apart. We find that health problems in early childhood are significant predictors of young adult outcomes. Early physical health problems are linked to outcomes primarily because they predict later health. Early mental health problems have additional predictive power even conditional on future health and health at birth.
Janet Currie is a professor of economics at Columbia University. Mark Stabile is a professor of business economics and public policy at the University of Toronto, Phongsack Manivong is a data analyst at the University of Manitoba, Leslie L. Roos is a professor of community health science at the University of Manitoba. The authors are grateful to Randy Fransoo for sharing his expertise about the data and to Paul Newacheck, Louise Sequin, and participants in seminars at Brown University, the Wharton School, the NBER Labor Studies group, Peking National University, and the Chinese University of Hong Kong for helpful comments. They also thank the following people from the Manitoba Ministry of Education—Heather Hunter and Shirley McLellan; from the Ministry of Family Services and Consumer Affairs—Harvey Stevens and Jan Forster; and from the Ministry of Health—Louis Barre. Finally, the authors thank seminar par-ticipants at the Geary Institute at University College Dublin and the Claremont-McKenna Colleges, Sand-ers Korenman, and three anonymous referees for helpful comments. Funding was provided by the Part-nership for America’s Economic Success, the Social Science and Humanities Research Council of Canada (MH 2007/2008–22), and the Canadian Institute for Advanced Research and the RBC Financial group. The results and conclusions presented are those of the authors. No official endorsement by Manitoba Health, the Partnership for America’s Economic Success or other funding agencies is intended or should be inferred. The data used in this article are housed at the Manitoba Centre for Health Policy. Information on access can be obtained by contacting Leslie Roos, Manitoba Centre for Health Policy, 4th Floor, 727 McDermot Avenue, Winnipeg, MB R3E 3P5 Canada; e-mail: Leslie_Roos@cpe.umanitoba.ca. For two years after publication of this article, all codes to replicate the tables in this paper will be kept on file. [Submitted November 2008; accepted March 2009]
I. Introduction
A large literature has established that low birth-weight babies are more likely to suffer various deficits, including lower average educational attainment. But prior research has not asked how poor child healthafterbirth affects long-term outcomes? We provide a first look at this question using a unique administrative data set based on public health insurance records from the Canadian province of Manitoba. The data combines information from birth records, hospitalizations, and ambulatory physician visits with information from other provincial registers about educational outcomes and use of social assistance. The information about health and outcomes is much more complete, and in many ways more accurate, than what is typically available in survey data. And because Canada has universal public health insurance, this study sheds light on the consequences of disparities in child health in a setting that abstracts from differences in access to insurance coverage.
We follow 50,000 children and their siblings who were born in Manitoba between 1979 and 1987, until 2006, when they are young adults. We compare siblings with different childhood health problems conditional on health at birth. We are able to compare the impacts of health problems at different ages, and to examine the con-sequences of different types of health problems including asthma, major injuries, externalizing mental health conditions, and other major conditions.
Our results suggest that many physical health problems in early life are significant predictors of future adult outcomes. But this is largely because poor health in child-hood predicts poor health in young adultchild-hood. Short-term health events generally have little long-run impact. Mental health problems are a different story—we find that diagnoses of attention deficit hyperactivity disorder (ADHD) or conduct disorder at school entry are significant predictors of future outcomes whether or not future health problems occur. We conclude that poor health in childhood may be a signifi-cant source of socioeconomic disparities in adulthood.
II. Background
There is a large literature linking low birth weight to lower average scores on a variety of tests of intellectual and social development (see for example, Breslau et al. 1994; Brooks-Gunn, Klebanov, and Duncan 1996; Currie and Hyson 1999). Several recent studies use sibling comparisons to assess the relationship be-tween low birth weight and future outcomes (Conley and Bennett 2000; Johnson and Schoeni 2007; Lawlor et al. 2006; Black, Devereux, and Salvanes 2005; Royer 2005; Currie and Moretti 2007). Oreopoulos et al. (2008) examine the Manitoba data used in this study and, consistent with the other studies, find that siblings of lower birth weight have worse outcomes. They did not, however, have any data on health after birth.
In fact, very few studies have examined the effect of child health after birth on future outcomes.1 Case, Fertig, and Paxson (2005) use data from the 1958 British
birth cohort study and show that children who suffered chronic conditions as children had lower educational attainment, wages, and employment probabilities than other children.
Smith (2009) examines the long-term effects of child health using a retrospective health measure using data from the Panel Study of Income Dynamics (PSID). In 1999, the 25–47-year-old adult children of PSID respondents were asked whether their health when they were younger than 16 was excellent, very good, good, fair, or poor. In models with sibling fixed effects, Smith finds significant negative effects of poor overall health status in childhood on earnings.
Case and Paxson (2006) treat adult height as an indicator of childhood health, and show that much of the wage premium associated with adult height can be explained by children’s cognitive test scores. They interpret their results as evidence that early child health affects cognition, which in turn affects earnings.
Our study improves on this literature in several ways. First, we have a continuous measure of health that is taken from medical records and covers the child’s entire life. This is an improvement over retrospective measures, or the snapshots that are available in the British Cohort Study. Second, we are able to compare children to their own siblings, in order to control for fixed aspects of family background that may affect both health during childhood and future outcomes.
III. Data
Our main source of data is records that are routinely collected through the administration of Manitoba’s public health insurance system. These re-cords include enrollment files, physician claims, and hospital claims for every person in Manitoba. These data are matched to administrative records on educational at-tainment and social-assistance (welfare) takeup and use.
The registry contains information on 96 percent of all children born in Manitoba over the sample period and tracks 99 percent of the original sample conditional on remaining in the province until June of their 18th year.2We restrict our sample to
families with more than one child born between 1979 and 1987 (excluding 1983, as we are unable to match this cohort to educational information). We track outcomes for these children through 2006. Oreopoulos et al. (2008) show that the sibling cohort and entire cohort of Manitoba births over this period are quite similar. We also exclude children who ever have a diagnosis of mental retardation. Further details on the construction of the data set are available in the data appendix.
Because the data set includes all hospitalizations and ambulatory visits, there are a very large number of potential health measures. Birth weight, congenital anomalies,
and perinatal problems are obtained from hospital records and are used as measures of health at birth.3
In order to collapse the other available health measures in an objective and arms-length way, we use Adjusted Clinical Group (ACG) software developed by research-ers at Johns Hopkins Univresearch-ersity (The Johns Hopkins Univresearch-ersity 2003).4The software
is designed to measure morbidity by creating constellations of diagnoses. Medical providers indicate diagnoses using International Classification of Disease codes (ICD9 or ICD10 codes depending on the year). The software groups 14,000 ICD codes into 32 groups (called Aggregated Diagnostic Groups or ADGs).5Individuals
are assigned an ADG code if they have been diagnosed with any of the ICD codes in the group in either an outpatient or hospital visit over the past year.6
We use the ADG codes to construct several health measures. First, the software classifies some ADGs as major and some as minor for each age group, and we start by looking at their definition of major diagnoses for children. However, this defi-nition excludes several diagnoses that are highly prevalent among children, and which are thought to have important effects: While the Johns Hopkins definition of major conditions includes acute, unstable mental health conditions such as psychosis, it excludes “stable” mental health conditions such as ADHD and conduct disorders, two of the most common mental health conditions among children. Also excluded are asthma and major injuries.7
These are potentially significant exclusions. Using large-scale national surveys of children from both the United States and Canada, Currie and Stabile (2006, 2009) show that mental health conditions in childhood are associated with lower future test scores and schooling attainments in both countries. Externalizing disorders such as ADHD and conduct disorders were found to have the largest effects on future outcomes.8
Injuries are the leading cause of death among children over one year of age in developed countries, notwithstanding a dramatic reduction in deaths due to injuries
3. Perinatal refers to the period from birth to 22 weeks. We count only those congenital and perinatal problems that are considered “major” health conditions by the Aggregated Diagnostic Groups (ADG) system. Appendix Table 4 in the data appendix lists these conditions. Congenital problems may continue to generate diagnoses as the child ages. For example, a 10 year old may have visits related to a congenital heart defect. We treat this as a congenital problem rather than as a new health condition.
4. The ADG system has been extensively validated in the United States. (Weiner et al. 1991; Weiner, Starfield, and Lieberman 1992; Powe et al. 1998; Wiener et al. 1996). The Manitoba Center for Health Policy also has evaluated the application of the ACG software to the Manitoba administrative data (Reid et al. 1999). See the data appendix for further details.
5. Groups are created on the basis of five criterion: (1) Duration of the Condition (acute, recurrent, or chronic), (2) severity of the condition (for example, minor and stable versus major and unstable), (3) diagnostic certainty (symptoms focusing on diagnostic evaluation versus documented disease focusing on treatment), (4) etiology of the condition (infectious, injury, or other), and (5) specialty care involved (medical, surgical, obstetric, and so on.)
6. Further information about the most common ICD codes in the ADGs we use is available in the data appendix.
7. “Major injuries” are not included as a major ADG for 0–17-year-olds, but they are included for 18-year-olds. In order to construct a more consistent measure, we use the same definition of major conditions for 18-year-olds as we do for younger children. Further details are in the data appendix.
in the past 30 years (Glied 2001). Yet we have little information about the burden of morbidity caused by injuries among surviving children (Bonnie et al. 1999).
Asthma is the leading cause of school absence and pediatric hospitalizations in children, and one of the most common chronic conditions of childhood (U.S. En-vironmental Protection Agency 2006). The available evidence suggests however, that when properly managed asthma may have little impact on children’s functioning or academic achievements so it is not clear that asthma in childhood should be expected to have consistent effects on young adult outcomes (Annett et al. 2000; Gutstadt et al. 1989).
In view of these literatures, we examine the effects of asthma, major injuries, two specific stable mental health problems (ADHD and conduct disorders), as well as the number of major health conditions as classified by the ADG software. In each case the measure is constructed to cover a specific age range starting from the date of birth of the child. So, for example, we define a child as having a major injury between ages 0–3 if the child has a diagnosis of a major injury at any point between birth and their fourth birthday. We construct similar measures for the age ranges 4– 8, 9–13, and 14–18. We chose these age ranges to correspond to important stages of childhood: preschool years, early elementary school, early adolescence, and the late teen years.
Table 1 shows the means of our measures for each age range. Because the first age range is one year smaller than the others, the estimates are prorated so that they all apply to a five-year interval. The fraction of children with a medical contact for asthma ranges from 8 percent among 0–3-year-olds, to 14.4 percent among 9–13-year-olds. These numbers compare very closely with the best available evidence of asthma prevalence for the United States, which suggest that 13.1 percent of 0–17-year-old children have ever been told by a doctor that they have asthma (Bloom and Cohen 2007).
Major injuries are clearly the most common reason for seeking medical attention, with around 40 percent of children having at least one visit for a major injury over each age interval. U.S. data suggest that in 2000, 11.9 percent of children younger than 10, and 17.9 percent of children 10–19 received medical attention for an injury, which suggests that over a four- or five-year period, a rate of 40 percent is not unreasonable.
Table 1
Means of Health Variables at Various Ages
Age 0–3
Age 4–8
Age 9–13
Age 14–18 Diagnoses related to
Any major condition 0.154 0.148 0.153 0.219 ADHD/conduct disorder 0.033 0.037 0.038 0.030
Asthma 0.081 0.125 0.144 0.120
Major injury 0.412 0.412 0.386 0.404
Congenital/perinatal problem 0.156 0.016 0.012 0.013 Any of the above 0.599 0.563 0.544 0.642 Number of major diagnoses 0.208 0.228 0.216 0.335 [0.580] [0.691] [0.628] [0.806] Maximum number of major diagnoses 11 12 10 14
10.500 10.320 9.45 10.01 Number total diagnoses major and minor [5.28] [5.72] [5.76] [6.48] Number of observations (N⳱50,404)
Notes: Standard deviations of continuous variables in brackets. Sample is drawn from administrative records from the province of Manitoba and includes children born between the years 1979 and 1987 excluding 1983.
About 15 percent of children 0–13 have other major conditions. Although it is relatively common to have a medical contact for a major health problem, most individual health problems have low prevalence. For example, the 629 children who had a medical contact related to hearing loss when they were 0–3 represent only 1.2 percent of the sample. This is the main reason that we group these major health conditions together. Still, 40–50 percent of young children categorized as having a major condition have hearing or vision problems, and it would not be surprising if these problems had effects on learning.
The average number of major health conditions is a little over 0.2 for children aged 0–13 (vs. 0.335 for 14–18-year-olds), which suggests that most children with a major health condition have only one such condition. A small number of children, however, have multiple conditions, with the maximum being 10–12 for 0–13-year-olds (14 for 14–18-year-0–13-year-olds). Finally, the table shows the effects of limiting our attention to major conditions. While the average number of major conditions iden-tified is far less than one, the average child has an average of five different major
andminor conditions diagnosed over a five-year period.
Table 2
Pattern of Health Conditions Across Age Groups
Age Pattern
Major Condition
ADHD/Conduct
Disorder Asthma Major Injury
0000 52.64 89.82 71.69 17.94
0001 12.02 1.37 4.29 7.97
0010 6.28 1.67 4.70 6.47
0011 2.99 0.70 2.46 5.00
0100 6.46 1.99 4.03 7.62
0101 1.72 0.12 0.54 4.70
0110 1.54 0.50 1.95 4.47
0111 0.97 0.51 2.26 4.59
1000 7.45 2.46 3.45 8.73
1001 2.05 0.07 0.30 4.52
1010 1.15 0.12 0.35 4.31
1011 0.60 0.06 0.30 3.85
1100 1.77 0.35 1.07 5.70
1101 0.63 0.02 0.27 4.23
1110 0.79 0.10 0.79 4.32
1111 0.93 0.13 1.55 5.58
N⳱50,404
Notes: Reported numbers are percentages of children with diagnoses. Patterns reflect whether the child had a diagnostic code for a particular condition in each of the age categories 0–3, 4–8, 9–13, 14–18. For example, 0000 denotes have no diagnoses for any of the four age categories, while 0001 denotes having a diagnosis between ages 14–18 only, 1100 denotes having a diagnosis at ages 0–3 and ages 4–8, but not 9–13 and 14–18.
small numbers of children have a diagnosis related to the same condition in each period. However, 5.58 percent of sample children have a major injury in every period.
The variation in our data over time periods suggests that in each period, some children without initial health conditions develop them, and other children with health conditions recover from them. Such variation is the key if we are to be able to use the data to examine the impact of health conditions at different ages.
The outcome variables we examine are created by linking the healthcare registry information to administrative data on education, and social assistance. We use edu-cation enrollment records to determine whether a student has attained Grade 12 by age 17. This measure is available for all birth cohorts. Overall, about 70 percent of children are in grade 12 by age 17. Not attaining grade 12 by this age could indicate that a student entered school late, has been held back in a grade at least once, or has dropped out.
compre-hensive exam. The score on the test is normalized to have a mean of zero and a standard deviation of one for the entire population of students in Manitoba. Within each birth cohort, some test scores are missing and we have imputed scores for these children based on the reasons for the failure to write the test, as discussed further in the data appendix.
Students in the province can select into one of several math tracks. In each year we classify high school courses into college versus noncollege preparatory mathe-matics based on the difficulty of the course and the course material.9We calculate
that 22 percent of the sample took college-preparatory math courses.
Finally, the sample of Manitoba residents is matched to monthly social assistance records (the provincial welfare program). Residents become age-eligible to partici-pate in welfare in their own right (rather than as a dependent child) on their 18th birthday. Our youngest birth cohort only can be followed for 1.25 years after the age of 18. While the older cohorts can be tracked for longer, we define our social assistance exposure window to be a consistent 1.25 years for each cohort (or 70 weeks). Using this exposure window, 6 percent of our sample went on social assis-tance in the 70 weeks after they became eligible on their 18th birthday.
The administrative records provide limited information on the characteristics of the mother at the birth of the child, and on the number of children in the family. We control for mother’s marital status, age, child gender, child birth order, the number of children in the family, and the child’s birth year. We use 2004 as the fixed point to determine family size and the birth order of the child. This year, many years after the final birth cohort used in the analysis, 1987, was chosen in order to try to ensure that families were past the childbearing phase. Unfortunately, there is no information about the family’s income or the mother’s education.
IV. Conceptual Framework
A growing body of research suggests that adverse conditions in early childhood may have particularly negative long-term effects. Cunha and Heckman (2008, forthcoming) hypothesize that this is because health human capital is com-plementary to skills and “skill begets skill,” so that children who suffer early dis-advantages may fall behind and never catch up. On the other hand, to the extent that children are resilient and recover, one might expect more recent health condi-tions to have greater impacts on current outcomes. If both mechanisms are at work, then one might expect to find that both health insults in early childhood and recent health problems have particularly negative impacts on young adult outcomes.
This section presents a barebones model that captures these ideas and shows that early health shocks may have either larger or smaller effects than later ones, even in the simplest models:
␣ 
where Yt is a young adult outcome, Ht is contemporaneous health, Ct is contem-poraneous cognitive ability, andht andct are log health and log cognitive ability, respectively. We assume that outcomes are produced using inputs of health and cognitive ability, and that cognitive ability depends on ability last period and also on health last period. Finally, health depends on health last period, and is subject to random problems,ut. Note that in principal, cognitive ability also can be subject to random shocks, but including them would only complicate this illustrative model. Moreover, we cannot observe shocks to cognitive ability, but only shocks to health in our data.
Solving the model recursively yields an equation of the form: log
(
Y)
⳱␦Ⳮ␦ c Ⳮ␦ h Ⳮ␦uⳭ␦u Ⳮ␦ u Ⳮ␦u (4) t 1 tⳮ4 2 tⳮ4 3 t 4 tⳮ1 5 tⳮ2 6 tⳮ3where, (␦c Ⳮ␦ h ) represents both cognitive and health endowments at birth
1 tⳮ4 2 tⳮ4
(both will be assumed to be captured by our measures of health at birth in combi-nation with the sibling fixed effects),ut is a contemporaneous health problem, and
is a health problem in the first three years of life. The coefficients to
utⳮ3 ␦3 ␦6
are given by:
2
␦3⳱␣, ␦4⳱␣␥Ⳮb2, ␦5⳱␥␦4Ⳮb b2 1,␦6⳱␥␦5Ⳮb b2 1. The model yields several interesting special cases:
Case 1. b ⳱0so that cognition does not depend on health. If ␥⬍1then health
2
depreciates, and the effects of health problems die out over time. In this case, more recent health problems always have a larger effect than problems further in the past. Case 2: b ⬎0 and ␥⳱1. Now early health problems matter more than later
2
health problems. The reason is that early health problems affect the development of cognitive ability through multiple periods.
Case 3. if b2⬎0 and ␥⬍1 then it is possible to generate many interesting patterns. For example, if ␣⳱⳱0.5;b1⳱1.5;b2⳱0.2; ␥⳱0.7, then ␦3⳱0.5,
so that health problems in the first years of life and
␦4⳱0.45, ␦5⳱0.47, ␦6⳱0.56
contemporaneous health problems matter most.
Hence, the impact of health shocks may be bigger or smaller for health shocks further in the past depending on which of the two mechanisms highlighted above dominates: On the one hand, if early health problems affect early cognitive ability, then future cognitive ability and early health problems have cumulative effects. How-ever, people tend to recover from health problems over time, so that the main effect of the health problem per se diminishes with time. The takeaway message is that the overall pattern of effects on outcomes is an empirical matter.
The empirical analogue of Equation 4 is given by:
OUTCOME⳱aⳭb XⳭb HEALTH Ⳮb HEALTH Ⳮb HEALTH
(5) 1 2 0 3 0–3 4 4–8
Ⳮb HEALTH Ⳮb HEALTH Ⳮe,
where OUTCOME is one of the young adult outcomes described above, X is a vector of controls including marital status, sex of the child, and mother’s age at birth, dummy variables for birth order of the child, family size, and year of birth indicators,HEALTH0are measures of health at birth and {HEALTH0–3,HEALTH4–8,
HEALTH9–13,HEALTH14–18} is a vector of age specific health problems. We use a
number of different measures of health, as described above.
Estimation of Equation 5 could be biased by omitted characteristics of families, including characteristics that affect young adult outcomes, the health of children in the family and the propensity of the family to seek medical care.
Hence, our main focus is on models of the following form:
OUTCOME ⳱aⳭb XⳭb HEALTHⳭb HEALTH Ⳮb HEALTH
(6) ya 1 2 0 3 0–3 4 4–8
Ⳮb HEALTH5 9–13Ⳮb HEALTH6 14–18ⳭMOTHERⳭe, whereMOTHERis an indicator for each mother in the data. The inclusion of mother fixed effects will help us to control for many unobserved family background char-acteristics that may be correlated with the propensity to use medical care, health status, and with young adult outcomes. The fact that we observe families over a relatively short period of time is helpful, as siblings will be less likely to be exposed to different environments over a short time than over a long time. The mean differ-ence in age between two siblings is only three years, and 74 percent of children are born less than four years apart. We estimate all of our models using linear probability models for dichotomous outcomes both for ease of interpretation, and for ease of including fixed effects.
V. Estimation Results
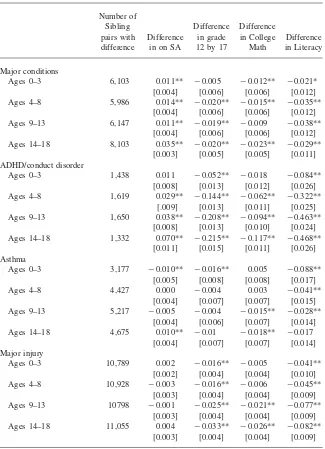
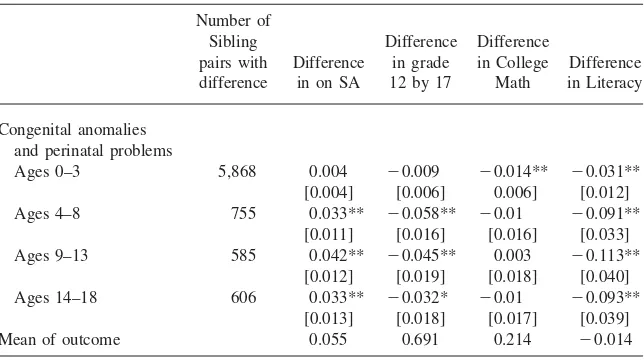
In order for models that include family fixed effects to be informa-tive there must be variation within families in both the health problems children experience and the outcomes observed later in life. To explore the extent of this variation we report the average difference in each outcome for families with children who have different health measures in each age group. The results are reported in Table 3.
Table 3
Mean Differences Between Sibling Pairs with Divergent Health Measures
Table 3(continued)
Mean of outcome 0.055 0.691 0.214 ⳮ0.014
Notes: Standard Errors in brackets. Column 1 reports the number of sibling pairs with differences in health measures at each age. The remaining columns report the average difference in outcomes for the pairs where there is a difference in the specified health condition. * denotes statistical significance at the 10 percent level. ** denotes significance at the 5 percent level.
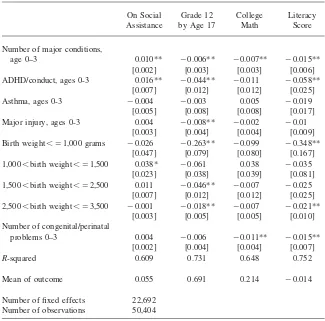
Table 4 shows estimates of a model similar to Equation 6 except that we include only measures of health at birth and health at 0–3. There has been a good deal of popular discussion of the idea that the earliest ages are a uniquely vulnerable period, so it is of interest to see if health conditions at these ages are associated with long-term outcomes.
Table 4 shows that, consistent with other studies, health at birth has significant effects on all four of our outcomes. Turning to health after birth, we find, perhaps surprisingly, that asthma at 0–3 is not predictive of adverse outcomes, while major injury is significant only in the regression for Grade 12 by 17. The most powerful and consistent predictors of poor outcomes are mental health problems and the num-ber of other major health conditions.
Relative to their own healthy siblings, children with an early diagnosis of ADHD or conduct disorders are 1.6 percentage points more likely to end up on welfare immediately after becoming eligible (on a baseline of 5.5 percent). They are also 4.4 percent less likely to be in grade 12 by age 17. An additional major condition increases the probability of being on welfare by 18 percent, reduces the probability of being in grade 12 by age 17 by 1 percent, reduces the probability of taking college preparatory math by 3 percent, and reduces the literacy score by 0.15 of a standard deviation. Hence, poor mental health at 0–3 and other major conditions are associ-ated with significantly poorer outcomes.
Table 4
Regressions of Outcomes on Health Problems at Age 0–3, Birth Weight, and Health at Birth
On Social Assistance
Grade 12 by Age 17
College Math
Literacy Score
Number of major conditions,
age 0–3 0.010** ⳮ0.006** ⳮ0.007** ⳮ0.015**
[0.002] [0.003] [0.003] [0.006]
ADHD/conduct, ages 0-3 0.016** ⳮ0.044** ⳮ0.011 ⳮ0.058**
[0.007] [0.012] [0.012] [0.025]
Asthma, ages 0-3 ⳮ0.004 ⳮ0.003 0.005 ⳮ0.019
[0.005] [0.008] [0.008] [0.017]
Major injury, ages 0-3 0.004 ⳮ0.008** ⳮ0.002 ⳮ0.01
[0.003] [0.004] [0.004] [0.009]
Birth weight⬍⳱1,000 grams ⳮ0.026 ⳮ0.263** ⳮ0.099 ⳮ0.348**
[0.047] [0.079] [0.080] [0.167]
1,000⬍birth weight⬍⳱1,500 0.038* ⳮ0.061 0.038 ⳮ0.035
[0.023] [0.038] [0.039] [0.081]
1,500⬍birth weight⬍⳱2,500 0.011 ⳮ0.046** ⳮ0.007 ⳮ0.025
[0.007] [0.012] [0.012] [0.025]
2,500⬍birth weight⬍⳱3,500 ⳮ0.001 ⳮ0.018** ⳮ0.007 ⳮ0.021**
[0.003] [0.005] [0.005] [0.010]
Number of congenital/perinatal
problems 0–3 0.004 ⳮ0.006 ⳮ0.011** ⳮ0.015**
[0.002] [0.004] [0.004] [0.007]
R-squared 0.609 0.731 0.648 0.752
Mean of outcome 0.055 0.691 0.214 ⳮ0.014
Number of fixed effects 22,692
Number of observations 50,404
Notes: Standard errors in brackets. Each column reports the results of a regression (or linear probability model) for the outcome listed in that column. On Social Assistance, Reaching Grade 12 by Age 1, and Taking College Math are 0/1 variables. The literacy score is normalized (0,1). In addition to the controls listed, all regressions also include mother fixed effects and controls for marital status, sex of the child, mother’s age at birth, dummy variables for birth order of the child, family size, and year of birth indicators. * denotes statistical significance at the 10 percent level. ** denotes significance at the 5 percent level.
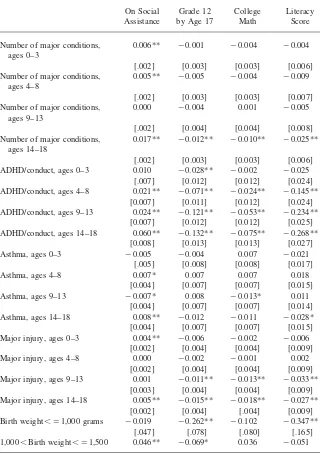
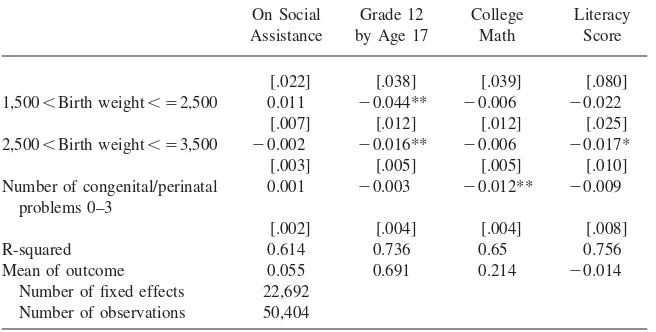
channel? Table 5 takes up this question by showing estimates from a model of the form Equation 6, which includes health conditions in all four age ranges.
Table 5 suggests the following conclusions:
diag-Table 5
Regressions of Outcomes on Childhood Health Conditions at Various Ages and Health at Birth
On Social Grade 12 College Literacy
Assistance by Age 17 Math Score
Number of major conditions, ages 0–3
0.006** ⳮ0.001 ⳮ0.004 ⳮ0.004
[.002] [0.003] [0.003] [0.006]
Number of major conditions, ages 4–8
0.005** ⳮ0.005 ⳮ0.004 ⳮ0.009
[.002] [0.003] [0.003] [0.007]
Number of major conditions, ages 9–13
0.000 ⳮ0.004 0.001 ⳮ0.005
[.002] [0.004] [0.004] [0.008]
Number of major conditions, ages 14–18
0.017** ⳮ0.012** ⳮ0.010** ⳮ0.025**
[.002] [0.003] [0.003] [0.006]
ADHD/conduct, ages 0–3 0.010 ⳮ0.028** ⳮ0.002 ⳮ0.025
[.007] [0.012] [0.012] [0.024]
ADHD/conduct, ages 4–8 0.021** ⳮ0.071** ⳮ0.024** ⳮ0.145**
[0.007] [0.011] [0.012] [0.024]
ADHD/conduct, ages 9–13 0.024** ⳮ0.121** ⳮ0.053** ⳮ0.234**
[0.007] [0.012] [0.012] [0.025]
ADHD/conduct, ages 14–18 0.060** ⳮ0.132** ⳮ0.075** ⳮ0.268**
[0.008] [0.013] [0.013] [0.027]
Asthma, ages 0–3 ⳮ0.005 ⳮ0.004 0.007 ⳮ0.021
[.005] [0.008] [0.008] [0.017]
Asthma, ages 4–8 0.007* 0.007 0.007 0.018
[0.004] [0.007] [0.007] [0.015]
Asthma, ages 9–13 ⳮ0.007* 0.008 ⳮ0.013* 0.011
[0.004] [0.007] [0.007] [0.014]
Asthma, ages 14–18 0.008** ⳮ0.012 ⳮ0.011 ⳮ0.028*
[0.004] [0.007] [0.007] [0.015]
Major injury, ages 0–3 0.004** ⳮ0.006 ⳮ0.002 ⳮ0.006
[0.002] [0.004] [0.004] [0.009]
Major injury, ages 4–8 0.000 ⳮ0.002 ⳮ0.001 0.002
[0.002] [0.004] [0.004] [0.009]
Major injury, ages 9–13 0.001 ⳮ0.011** ⳮ0.013** ⳮ0.033**
[0.003] [0.004] [0.004] [0.009]
Major injury, ages 14–18 0.005** ⳮ0.015** ⳮ0.018** ⳮ0.027**
[0.002] [0.004] [.004] [0.009]
Birth weight⬍⳱1,000 grams ⳮ0.019 ⳮ0.262** ⳮ0.102 ⳮ0.347**
[.047] [.078] [.080] [.165]
1,000⬍Birth weight⬍⳱1,500 0.046** ⳮ0.069* 0.036 ⳮ0.051
Table 5(continued)
On Social Assistance
Grade 12 by Age 17
College Math
Literacy Score
[.022] [.038] [.039] [.080]
1,500⬍Birth weight⬍⳱2,500 0.011 ⳮ0.044** ⳮ0.006 ⳮ0.022
[.007] [.012] [.012] [.025]
2,500⬍Birth weight⬍⳱3,500 ⳮ0.002 ⳮ0.016** ⳮ0.006 ⳮ0.017*
[.003] [.005] [.005] [.010]
Number of congenital/perinatal problems 0–3
0.001 ⳮ0.003 ⳮ0.012** ⳮ0.009
[.002] [.004] [.004] [.008]
R-squared 0.614 0.736 0.65 0.756
Mean of outcome 0.055 0.691 0.214 ⳮ0.014
Number of fixed effects 22,692 Number of observations 50,404
Notes: Standard errors in brackets. Each column reports the results of a regression (or linear probability model) for the outcome listed in that column. On social assistance, reaching Grade 12 by age 17, and taking college math are 0/1 variables. The literacy score is normalized (0,1). In addition to the controls listed, all regressions also include mother fixed effects and controls for marital status, sex of the child, mother’s age at birth, dummy variables for birth order of the child, family size, and year of birth indicators. * denotes statistical significance at the 10 percent level. ** denotes significance at the 5 percent level.
noses at 0–3, presumably because it is difficult to accurately diagnose mental health problems at such a young age.
2. The number of other major conditions at 0–3 and 4–8 remains predictive of social assistance use even when later diagnoses of major conditions are controlled. However, when diagnoses at 14–18 are included in the model, diagnoses at 0–3 and 4–8 are no longer significantly associated with future school outcomes.10
3. Health at birth remains a significant predictor of young adult welfare use and schooling attainment even when many intervening health measures are included in the model.
4. On average, major injuries in childhood do not have lingering effects on edu-cational attainment or welfare use, though major injuries in adolescence place teens at higher risk of poor outcomes.
5. Asthma in early childhood is not predictive of diminished future educational outcomes or receipt of social assistance in young adulthood, though there are some weak associations between adolescent asthma and outcomes and asthma at 14–18 has a significant effect on future social assistance use.
One difficulty with the interpretation of Equation 6 is that conditions that occur early can persist over more periods than ones that appear late in our observational window. An alternative way to look at the data is to compare the effects of health conditions which apparently lasted for only one period. The largest single category
in Table 2 is children who never have a given condition. The next largest groups are children who had a condition only once. We might compare children who have a given condition at age 0–3 and then recover, to those who have the same condition at a different age. Table 6 includes indicators for having a condition only at 0–3, having it only at 4–8, having it only at 9–13, and having it only at 14–18. A fifth indicator is added for children who have a condition over multiple periods. The left out group for each condition is children who never had the condition.
Table 6 confirms that for physical health problems, it is problems that occur late in adolescents or which last for multiple periods that have effects on schooling and welfare participation. Children who sustain health problems early in life and then recover do not appear to suffer lasting effects on these outcomes. Again, mental health proves an exception. ADHD/conduct disorders at 4–8 are associated with poorer outcomes even if the children have no other contacts for mental health prob-lems, although the effects are largest for mental health problems that persist over multiple age ranges.
VI. Extensions
While the ADG system is a well-established way to construct health measures from underlying ICD9/ICD10 codes, some arbitrariness in grouping di-agnoses and in classifying didi-agnoses as major or minor is inevitable. One obvious extension involves breaking down the injury category because it is so large. We have tried to estimate the effect of serious head injuries (skull fractures and intra-cranial injuries including concussion) since there is a literature positing long-term effects of such injuries (Hawley et al. 2008). However, although 4–7 percent of children have such injuries in each age group, we did not find any statistically significant effects. It is possible that to do so may require larger samples.
Our findings with regard to ADHD/conduct disorders beg the question of how other mental illnesses affect child outcomes. We have repeated our analyses with a somewhat broader measure of mental health conditions defined using all of the conditions included in ADG 24 “recurrent or persistent, stable psychosocial condi-tions” the category that includes both ADHD and conduct disorder. This exercise produced similar though somewhat larger estimates of the effects of mental health conditions.
In our administrative data we have no information about measures of socioeco-nomic status (SES) such as parent’s income or education. SES-related gaps in ma-ternal reports of child health status tend to grow with child age in both the United States and Canada (Case, Lubotsky, and Paxson 2002; Currie and Stabile 2003). And poor children receive more insults to their health than richer children, including more injuries, chronic conditions, and acute conditions (see for example, Newacheck 1994; Newacheck and Halfon 1998; Currie and Lin 2007; Case, Lubotsky, and Paxson 2002). Hence, it would be of great interest to break down our results by SES.
estimation results were inconclusive. If we divide our sample by SES, the point estimates of the effects of health problems tend to be larger for the lower SES group, but we cannot reject the null hypothesis that the effects are similar for high and low SES groups.
VII. Discussion
The strengths of our study include: a large sample; coverage of the population from birth to followup; a long followup period; and the use of objective health measures rather than self-reports or retrospective measures. The fact that we observe multiple children from the same family is an additional strength because sibling comparisons enable us to control statistically for many unobserved charac-teristics of families that could be related to health and propensity to seek care.
Still several issues arise when using family fixed effects models. First, there may be characteristics of the individual child that are correlated with health conditions and also with future outcomes. While we cannot control for all such factors, it is important to note that we have unusually thorough controls for health at birth, and that the degree of serial correlation in many of our outcomes (such as injuries) is modest.
Second, parents may treat siblings differently, and illness could cause parents to behave differently toward the sick child, if for example, illness changes parental perceptions about the marginal return to investments in children. If parents favor the stronger child, then the estimated effect of health problems will reflect not only physiological effects, but also the result of the parent’s smaller investments in the sick child. If on the other hand, parents of children with health problems invest in order to compensate disadvantaged children, then sibling fixed effects will tend to understate the true physiological effect of health. Such bias could go either way. Rosenzweig and Zhang (2006) argue that in China, parents favor the stronger child, perhaps because many Chinese still expect to be supported by their children in old age. In the United States, the available evidence suggests that investments are usually compensatory (Behrman, Pollak, and Taubman 1982, 1989; Ashenfelter and Rouse 1998; Ermish and Francesconi 2000; McGarry 1999; McGarry and Schoeni 1995, 1997) so that sibling comparisons are likely to yield underestimates of the true physiological effects of health. We believe that Canada is more similar to the United States than to China, so that our estimates may tend to understate the effects of health problems.
Third, health conditions of one sibling may have an impact on the other sibling. To the extent that the household is disrupted by a child’s illness, we might expect both children to be negatively affected in which case our sibling comparisons will also tend to underestimate the effects of health conditions.
Fourth, sibling fixed effects models may exacerbate the effects of measurement error. This last point highlights a strength of our analysis in that our measures of health are much more accurate than those used in previous studies, and less likely to be subject to bias due to self/parental reports, forgetting, and so on.
administrative data sets that can be merged to the health records. It would be very interesting to be able to measure adult earnings or employment status, but this in-formation is currently unavailable.
Second, what we can observe is whether a child had any interaction with the healthcare system for a specific ADG over a four-year interval. It is always difficult to construct measures of underlying health from data about utilization of care. There are two reasons to believe, however, that the measures we construct are good proxies for underlying health status: First, these children are all fully insured. It is reasonable to expect that a seriously ill child who is fully insured will interact with the health-care system at least once, and in fact, over 98 percent of our sample children have a contact with the medical system in each period. Hence, the use of data from a country with universal health insurance mitigates the concern about access to care (and hence about the relationship between health and utilization). Second, our mea-sure is not affected by the number of visits, as long as the child sees the doctor at least once.
Our Canadian setting provides a data set that would be virtually impossible to replicate in the U.S. It would be difficult to find a U.S. insurer that had comprehen-sive data on a similarly sized sample of children from birth to young adulthood. And as argued above, universal access to care makes it defensible for us to approx-imate underlying health status with data based on healthcare utilization. Still, readers may wonder whether our results can be generalized to a U.S. setting. We believe that if health problems have long-term impacts in the Canadian setting, then they are likely to have even greater impacts in the United States, where access to care is an issue for many children. More specifically, it is possible for example, that asthma could have more deleterious effects in the United States, given large numbers of children with inadequate access to preventive care.
VIII. Conclusions
Our research offers several striking conclusions. First, both poor health at birth and early mental health problems are associated with poorer long-term outcomes, even conditional on future health outcomes. Second, physical health problems in early childhood are associated with poorer long-term outcomes but this appears to be because they predict poorer future health. Unless they persist over time, even serious early health problems have little association with future schooling attainment or reliance on welfare. This is true of major injuries as well as illness. Finally, it is notable that we find very little effect of childhood asthma on the out-comes we examine.
References
Almond, Douglas. 2006. “Is the 1918 Influenza Pandemic Over? Long-term Effects of In Utero Influenza Exposure in the Post-1940 U.S. Population.”Journal of Political Economy114(4):672–712.
Almond, Douglas, and Bhashkar Mazumder. 2005. “The 1918 Influenza Pandemic and Subsequent Health Outcomes: An Analysis of SIPP Data.”American Economic Review: Papers and Proceedings95(2):258–62.
Annett, Robert, Elizabeth Aylward, Jodi Lapidus, Bruce Bender, and Thomas DuHamel. 2000. “Neurocognitive Functioning in Children with Mild and Moderate Asthma in the Childhood Asthma Management Program.”Journal of Allergy and Clinical Immunology
105(4):717–24.
Ashenfelter, Orley, and Cecilia Rouse. 1998. “Income, Schooling and Ability: Evidence from a New Sample of Identical Twins.”Quarterly Journal of Economics113(1):253–84. Baillargeon, Raymond, Richard Tremblay, and Douglas Willms. “The Prevalence of
Physical Aggression in Canadian Children: A Multi-Group Latent Class Analysis of Data from the First Collection Cycle (1994-1995) of the NLSCY.” Human Resources Development Canada, Applied Research Branch Strategic Policy. December 1999. Accessed by: http://www.rhdcc.gc.ca/eng/cs/sp/sdc/pkrf/publications/research/1999-001255/1999-001255.pdf
Baker, Michael, Mark Stabile, and Catherine Deri. 2004. “What Do Self-Reported, Objective Measures of Health Measure?.”Journal of Human Resources39(4):1067–93. Barker, David. 1998. “In Utero Programming of Chronic Disease.”Clinical Science95:115–
28.
Begley, Charles, Carl Slater, Martha Engel, and Thomas Reynolds. 1994. “Avoidable Hospitalizations and Socio-Economic Status in Galveston County, Texas.”Journal of Community Health19:377–87.
Behrman, Jere, Robert Pollak, and Paul Taubman. 1982. “Parental Preferences and Provision for Progeny.”Journal of Political Economy90(1):52–73.
———. 1989. “Family Resources, Family Size, and Access to Financing for College Education.”Journal of Political Economy97(2):398–419.
Behrman, Jere, and Mark Rosenzweig. 2004. “Returns to Birthweight.”Review of Economics and Statistics86(2):586–601.
Billings, John, Lisa Zeitel, Joanne Lukomnik, Timothy Carey, Arthur Black, and Laurie Newman. 1993. “Impact of Socioeconomic Status on Hospital Use in New York City.”
Health Affairs12:162–73.
Black, Sandra, Paul Devereux, and Kjells Salvanes. 2007. “From the Cradle to the Labor Market? The Effect of Birth Weight on Adult Outcomes.”Quarterly Journal of Economics122(1):409–39.
Bloom, Barbara, and Robin Cohen. 2007.Summary Health Statistics for U.S. Children: National Health Interview Survey10(234):1–79. Hyattsville, Md.: National Center for Health Statistics.
Richard Bonnie, Carolyn Fulco, and Catharyn Liverman, eds. 1999.Reducing the Burden of Injury. Washington D.C.: Institute of Medicine.
Brooks-Gunn, Jeanne, Patricia Klebanov, and Greg Duncan. 1996. “Ethnic Differences in Children’s Intelligence Test Scores: Role of Economic Deprivation, Home Environment, and Maternal Characteristics.”Child Development67:396–408.
Marni, Brownell, Noralou Roos, Randy Fransoo, Les Roos, Anne Guevremont, Leonard MacWilliam, Lauren Yallop, and Ben Levin. 2006. “Is the Class Half Empty? A Population Based Perspective on Socioeconomic Status and Educational Outcomes.”
IRPP Choices12(5).
Case, Anne, and Christina Paxson. “Stature and Status: Height, Ability, and Labor Market Outcomes.” NBER Working Paper #12466, August 2006.
Case, Anne, Angela Fertig, and Christina Paxson. 2005. “The Lasting Impact of Childhood Health and Circumstance.”Journal of Health Economics24(2):365–89.
Case, Anne, Darren Lubotsky, and Christina Paxson. 2002. “Economic Status and Health in Childhood: The Origins of the Gradient.”American Economic Review92(5):1308–34. Conley, Dalton, and Neil Bennett. 2000. “Is Biology Destiny? Birth Weight and Life
Chances.”American Sociological Review65(3):458–67.
Cunha, Flavio, and James Heckman. 2008. “Formulating, Identifying, and Estimating the Technology of Cognitive and Noncognitive Skill Formation.”Journal of Human Resources, 18(4):738–82.
Cunha, Flavio, James Heckman, and Susanne Shennach. Forthcoming. “Estimating the Technology of Cognitive and Non-Cognitive Skill Formation.”Econometrica. Currie, Janet. “Healthy, Wealthy, and Wise? Socioeconomic Status, Poor Health in
Childhood, and Human Capital Development.” 2009.Journal of Economic Literature. 47(1):87–122.
Currie, Janet, and Wanchuan Lin. 2007. “Chipping Away at Health: More on the Relationship Between Income and Child Health.”Health Affairs26(2):331–44.
Currie, Janet, and Rosemary Hyson. 1999. “Is the Impact of Health Problems Cushioned by Socioeconomic Status? The Case of Low Birth Weight.”American Economic Review
89(2):245–50.
Currie, Janet, and Enrico Moretti. 2007. “Biology as Destiny? Short and Long-Run Determinants of Intergenerational Transmission of Birth Weight.”Journal of Labor Economics. 25:231–64.
Currie, Janet, and Mark Stabile. 2003. “Socioeconomic Status and Health: Why Is the Relationship Stronger for Older Children?”American Economics Review93(5):1813–23. ———. 2006. “Child Mental Health and Human Capital Accumulation: The Case of
ADHD.”Journal of Health Economics25(6):1094–1118.
———. 2009. “Mental Health in Childhood and Human Capital.” InAn Economic Perspective on the Problems of Disadvantaged Youth, ed. Jonathon Gruber. Chicago: University of Chicago Press for NBER.
Duncan, Greg, Chantelle Dowsett, Amy Claessens, Katherine Magnuson, Aletha Huston, Pamela Klebanov, Linda Pagani, Leon Feinstein, Mimi Engel, Jeanne Brooks-Gunn, Holly Sexton, Kathryn Duckworth, and Crista Japel. “School Readiness and Later Achievement.” Northwestern University Working Paper, 2006.
Ermisch, John, and Marco Francesconi. 2000. “Educational Choice, Families and Young People’s Earnings.”Journal of Human Resources35(1):146–76.
Fransoo, Randall. “How Health Status at Birth and Through Childhood Affects Progress and Performance in School: A Population Based Study.” Ph.D. thesis, Department of Community Health Sciences, Faculty of Medicine, University of Manitoba, August 2007. Froehlich, Tanya, Bruce Lanphear, Jeffery Epstein, William Barbaresi, Slavica Katusic, and
Robert Kahn. 2007. “Prevalence, Recognition, and Treatment of Attention-Deficit/ Hyperactivity Disorder in a National Sample of U.S. Children.”Archives of Pediatric and Adolescent Medicine161(9):857–64.
Glied, Sherry. 2001. “The Value of Reductions in Child Injury Mortality in the U.S..” In
Gregg, Paul, and Steven Machin. “Child Development and Success or Failure in the Youth Labour Market.” Center for Economic Performance, London School of Economics Discussion Paper 0397, July 1998.
Gutstadt, Linda, Jerry Gillette, David Mrazek, Joleen Fukuhara, John LaBrecque, and Robert Strunk. 1989. “Determinants of School Performance in Children with Chronic Asthma.”American Journal of Diseases in Children143(4):471–75.
Hawley, Carol, Anthony Ward, Andrew Magnay, and Julie Long. 2004. “Outcomes Following Childhood Head Injury: A Population Study.”Journal of Neurological, Neurosurgery, and Psychiatry75:737–42.
Lawlor, Debbie, Heather Clark, George Davey Smith, and David Leon. 2006. “Intrauterine Growth and Intelligence Within Sibling Pairs: Findings from the Aberdeen Children of the 1950s Cohort.”Pediatrics117(5):894–902.
McGarry, Kathleen. 1999. “Intervivos Transfers and Intended Bequests.”Journal of Public Economics73(3):321–51.
McGarry, Kathleen, and Robert Schoeni. 1995. “Transfer Behavior in the Health and Retirement Study: Measurement and the Redistribution of Resources within the Family.”
Journal of Human Resources30:S184–S226.
———. 1997. “Transfer Behavior Within the Family: Results from the Asset and Health Dynamics Study.”The Journals of Gerontology52B:82–92.
McLeod, Jane, and Karen Kaiser. 2004. “Childhood Emotional and Behavioral Problems and Educational Attainment.”American Sociological Review69:636–58.
Mustard, Cam, Shelley Derksen, Jean Marie Berthelot, Michael Wolfson, Leslie Roos, and Keumhee Carriere. “Socio-Economic Gradients in Mortality and the Use of Health Care Services at Different Stages in the Life Course.”Manitoba Centre for Health Policy Report, December 1995.
Mustard, Cam, Shelley Derksen, Jean Marie Berthelot, and Michael Wolfson. 1999. “Assessing Ecologic Proxies for Household Income: A Comparison of Household and Neighbourhood Level Income Measures in the Study of Population Health Status.”Health and Place5(2):157–71.
National Center for Injury Prevention and Control. 2006.CDC Injury Fact Book. Atlanta, GA: Centers for Disease Control and Prevention.
Newacheck, Paul. 1994. “Poverty and Childhood Chronic Illness.”Archives of Pediatric and Adolescent Medicine148:1143–49.
Newacheck, Paul, and Neil Halfon. 1988. “Prevalence and Impact of Disabling Chronic Conditions in Childhood.”American Journal of Public Health88(4):610–17. Oreopoulos, Philip, Mark Stabile, Leslie Roos, and Randy Walld. 2008. “The Short,
Medium, and Long Term Effects of Poor Infant Health.”Journal of Human Resources
43(1):88–138.
Powe, Neil, Jonathan Weiner, Barbara Starfield, Mary Stuart, Andrew Baker, and Donald Steinwachs. 1998. “Systemwide Performance in a Medicaid Program: Profiling the Care of Patients with Chronic Illness.”Medical Care34(8):798–810.
Reid, Robert, Leonard MacWilliam, Lorne Verhulst, Noralou Roos, and Michael Atkinson. 2001. “Performance of the ACG Case-Mix System in Two Canadian Provinces.”Medical Care39(1):86–99.
Reid, Robert, Leonard MacWilliam, Lorne Verhulst, Noralou Roos, Norm Frohlich, and Charlyn Black. 2002. “Assessing Population Health Care Needs Using a Claims-Based ACG Morbidity Measure: A Validation Exercise in the Province of Manitoba.”Health Services Research37(5):1345–63.
Roos, Noralou, and Cam Mustard. 1997. “Variation in Health and Health Care Use by Socioeconomic Status in Winnipeg, Canada: Does the System Work Well? Yes and No.”
Roos, Leslie, Randy Walld, Julia Uhanova, and Ruth Bond. 2005. “Physician Visits, Hospitalizations, and Socioeconomic Status: Ambulatory Care Sensitive Conditions in a Canadian Setting.”Health Services Research40(4):1167–85.
Roos, Leslie, and J. Patrick Nicol. 1999. “A Research Registry: Uses, Development, and Accuracy.”Journal of Clinical Epidemiology52(1):39–47.
Rosenzweig, Mark, and Junsen Zhang. 2006. “Do Population Control Policies Induce More Human Capital Investment? Twins, Birthweight, and China’s ’One Child’ Policy.” Working paper #114, Bureau for Research in Economic Analysis of Development. Cambridge, Mass.: Harvard University.
Royer, Heather. 2005. “Separated at Girth: Estimating the Long-Run and Intergenerational Effects of Birthweight Using Twins.”Ford School of Public Policy. Ann Arbor, MI: University of Michigan.
Salm, Martin, and Daniel Schunk. “The Role of Childhood Health for the Intergenerational Transmission of Human Capital: Evidence from Administrative Data.” Mannheim, Germany: University of Mannheim. May 2008.
Shaffer, David, Prudence Fisher, Mina Dulcan, Mark Davies, and John Piacentini. 1996. “The NIMH Diagnostic Interview Schedule for Children Version 2.3 (DISC-2.3): Description, Acceptability, Prevalence Rates, and Performance in the MECA Study. Methods for the Epidemiology of Child and Adolescent Mental Disorders Study.”
Journal of the American Academy of Child and Adolescent Psychiatry35:865–77. Smith, James. 2009. “The Impact of Childhood Health on Adult Labor Market Outcomes.”
The Review of Economics and Statistics91(3):478–489.
Starfield, Barbara, Sam Shapiro, Judith Weiss, Kung-Yee Liang, Knut Ra, David Paige, and Xiaobin Wang. 1991. “Race, Family Income and Low Birth Weight.”American Journal of Epidemiology134:1167–74.
The Johns Hopkins University Bloomberg School of Public Health, Health Services Research & Development Center.The Johns Hopkins ACG威Case-Mix System Version
6.0 Release Notes. (Editor in Chief: Jonathan P. Weiner). Baltimore, Md.: The Johns Hopkins University. April, 2003.
U.S. Centers for Disease Control.Preventing Chronic Diseases: Investing Wisely in Health, Preventing Dental Caries. Washington D.C.: U.S. Department of Health and Human Services. April 6, 2004.
U.S. Department of Health and Human Services. 1999.Mental Health: A Report to the Surgeon General. Rockville MD: U.S. Dept. Of Health and Human Services. U.S. Environmental Protection Agency, Indoor Environments Division Office of Air and
Radiation. 2006. “Asthma Facts.” EPA 402-F-04-019.
Weiner, Jonathan, Allen Dobson, Stephanie Maxwell, Kevin Coleman, Barbara Starfield, and Gerald Anderson. 1996. “Risk-Adjusted Medicare Capitation Rates Using Ambulatory and Inpatient Diagnoses.”Health Care Financing Review17(3):77–99. Weiner, Jonathan, Barbara Starfield, and Richard Lieberman. 1992. “Johns Hopkins
Ambulatory Care Groups (ACGs): A Case Mix System for UR, QA, and Capitation Adjustment.”HMO Practice6(1):13–19.
Appendix 1
Data
The province of Manitoba was chosen for this study because of the unique ability to link the sources of data used in this paper. With a population of 1.17 million, Manitoba has the fifth largest population among Canada’s provinces and territories. Within Canada, Manitoba has generally ranked in the mid-range of a series of in-dicators of health status, socioeconomics, and healthcare expenditures.
The data used in this study come from a number of sources. The birth data originate from Manitoba Health hospital records. The registry contains information on all births in Manitoba since 1970. Siblings are linked to mothers using hospital birth record information. The registry data allow us to specify the mother in all cases. Fathers are specified in 85 percent of cases. When an individual turns 18 years old, he or she receives his or her own family identification number. On marriage, a female receives the identification number of her husband. Both the mother’s iden-tification number (an encrypted Personal Health Ideniden-tification Number) and the fam-ily identification number are used to define siblings.11Several checks on this
algo-rithm as applied to the nine years of birth cohorts (looking at missing data, the number of children designated as having the same mother and father, and compli-cated blended families) have indicompli-cated it to be highly accurate.
Information on the provincial language arts test is taken from education enrollment records and linked to the provincial registry. Taken in Grade 12, these tests contrib-ute 30 percent to the students’ final course grade. Individuals pass the language arts test by scoring 50 percent or more on a comprehensive exam. The test focuses on reading comprehension, exploring and expanding on ideas from texts, the manage-ment of ideas and information, and writing and editing skills. For each birth cohort, we record the test score in five percentage point categories (13 in total, with a residual 14th for students scoring between 0 and 35 percent) in the year that most students write the test. Within each birth cohort, approximately 40 percent of test scores are missing. We impute scores for missing students based on the reason for missing information (ranking them below the lowest scoring category among those who wrote the test).
The missing data categories, listed from highest to lowest rank are: absent (about 1 percent of each birth cohort sample); In Grade 12 but not tested (about 8 percent); In Grade 11 or lower (about 19 percent), Not enrolled (about 2 percent), and With-drawn from School (about 10 percent). For the entire sample, we therefore have 19 test score categories. Following methods discussed by Mosteller and Tukey (1977) and Willms (1986), we compute a standardized score for each individual by assum-ing an underlyassum-ing logit distribution, which is divided into pieces accordassum-ing to the percentage of cohort members in each category. Scores are calculated separately for
each birth cohort because of small changes in the categories available and in the percentage distribution each year. In a typical year, the highest scorers are given an index score of 2.96, while those withdrawn from school are given a score of -1.84. The logit transform produces an index with an overall mean of zero and a standard deviation of one. The ordering on this index is closely correlated with the student’s eventual graduation status.
We remove children who ever had a diagnosis of mental retardation from the sample. This includes ICD9’s 317–319 and ICD10’s F70–F79.
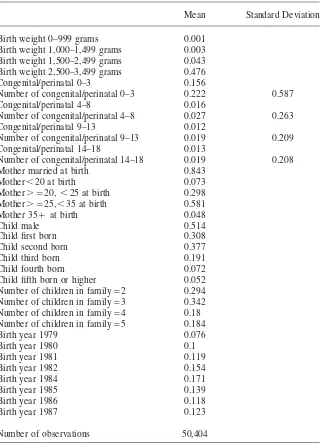
Appendix Table A1 shows means of the “control variables” that are available in our administrative data. Note that while we start with approximately the same num-ber of children in each birth cohort, the focus on comparing siblings means that in our sibling sample, children in the middle cohorts are more likely to be retained in the sample (because they are more likely to have a sibling in the sample).
In order to collapse the number of health measures to a manageable number in an objective and arms-length way, we use Adjusted Clinical Group (ACG) software developed by researchers at Johns Hopkins University (The Johns Hopkins Univer-sity, 2003). The ACG is designed to measure morbidity by clustering individuals by their age, gender, and constellations of diagnoses. Medical providers indicate diag-noses using what are called International Classification of Disease Ninth or Tenth edition (ICD9 or ICD10) codes. This software groups 14,000 ICD9 codes into 32 groups (called Aggregated Diagnostic Groups or ADGs) on the basis of 5 criteria: (1) duration of the condition (acute, recurrent, or chronic), (2) severity of the con-dition (for example, minor and stable versus major and unstable), (3) diagnostic certainty (symptoms focusing on diagnostic evaluation versus documented disease focusing on treatment), (4) etiology of the condition (infectious, injury, or other), and (5) specialty care involved (medical, surgical, obstetric, and so on). Individuals are assigned an ADG code if they have been diagnosed with any of the ICD9/10 codes in the group in either a physician or hospital visit over the past year. A person can have from 0–32 ADGs. The system further classifies diagnoses as “major” or “minor,” a distinction we take advantage of in our study.
The ADG system has been extensively validated in the United States (Weiner et al. 1991; Weiner, Starfield, and Lieberman 1992; Powe et al. 1998; Wiener et al. 1996). The Manitoba Centre for Health Policy also has evaluated the application of the ACG software to the Manitoba administrative data (Reid et al. 1999). They found, for example, that the diagnostic codes used in Manitoba worked well with the ACG software, and that the fraction of people with no valid code in a given year (18 percent) was similar to that expected on the basis of previous analyses of Manitoba data. (People have no valid code if they did not see a doctor at all during the reference period). About 16 percent of the population had four or more ADG codes in a year. The system also generated a distribution of relative expenditures similar to that seen in other data sets (Minnesota Medicaid recipients, and a large U.S. HMO), suggesting that relative expenditures for different types of illness are not very different in Canada and the United States. Finally, the MCHP study verified that areas with high rates of premature mortality also had higher morbidity as mea-sured by the ACG system.
defined by the date of birth for the child (rather than by calendar years). So, for example, we sum the number of major condition codes recorded in each year be-tween ages 0–3 to get a measure of the number of major conditions in that age range. We construct this measure for the age ranges 0–3, 4–8, 9–13, and 14–18.
Major conditions are defined using ADG codes 3, 9, 11, 12, 13, 18, 25, and 32. These codes capture most of the chronic and acute major illnesses faced by children including orthopedic, ear, nose throat and eye problems, cancers, and a variety of other acute major illnesses.
The definition of a “major ADG” comes directly from the John Hopkins software and depends on the age of the child. For children ages 0–17 it includes ADGs 3, 9, 11, 12, 13, 18, 25 and 32; and for children ages 18 and older it includes 3, 4, 9, 11, 16, 22, 25, and 32. For the sake of defining a consistent measure across age groups, we redefine the major ADG group using the 0–17 definition for all ages in the sample.
ICD9 codes have been used for both physician claims and hospital separation abstracts through March 31, 2004. These will have generated the ADG scores for all nine birth cohorts up through age 14. Beginning April 1, 2005, ICD10 coding was adopted for hospital separation abstracts. Because of this, a relatively small number of ICD10 diagnoses (N⳱447) on abstracts from the 1985–87 birth cohorts were also used in categorizing major conditions.
Appendix Table A2 shows the most prevalent ICD9 codes generating major con-ditions for each age group. While the most common serious concon-ditions change as children age, hearing and vision problems are important in each age group. Appendix Table A3 shows the most prevalent ICD9 codes generating major injuries. While the most common serious conditions change as children age, “open wound of the head” and “certain adverse conditions, not elsewhere classified” are important cate-gories at all ages.
Appendix Table A4 shows the most prevalent ICD9 codes for congenital problems and perinatal problems (ICD9 740–779). By definition, these conditions occur at birth or slightly thereafter. However, children with serious congenital/perinatal prob-lems continue to have contacts with the medical system that are related to these diagnoses. Hence, one can sum the number of contacts having to do with congenital/ perinatal problems at each age. In our regression models, we control for the number of contacts related to congenital/perinatal problems at each age group.
The health measures are generated from physician visits and hospital separation abstracts. Emergency department and hospital outpatient visits are not uniformly included in the data sets. Some of these visits are captured as (physician) ambulatory visits. An earlier analysis using one year of Winnipeg data found that 4.9 percent of ambulatory care was provided by emergency departments and outpatient clinics and that residents of lower income neighborhoods were disproportionately likely to receive such care.12,13In our records, 2.5 percent of physician claims are for
emer-12. Mustard, Cam, Anita Kozyrskyj, Morris Barer, and Sam Sheps. 1998. “Emergency Department Use as a Component of Total Ambulatory Care: A Population Perspective.”Canadian Medical Association Journal158(1):49–55.
gency room visits, and 1.6 percent of hospital claims over the period 1979–2004 are for outpatient visits. This comparison suggests that about 1 percent of visits could be missing.
Our analysis is based on ADGs and numbers of ADGs rather than on numbers of visits. Hence, if a child with a missing visit had another contact for a diagnosis in the same ADG within a four-year period (for example, a follow up visit), that child’s condition would be included in our analysis. Nevertheless, in order to gauge the potential importance of missing visit records, we conducted the comparison shown in Appendix Table A5. This table shows the number of ADGs for each age group calculated first using the entire sample of visits available, and then excluding the ER and outpatient records that we do have. Clearly, this exclusion makes very little difference to the average number of ADGs. It also had no effect on the max-imum number of ADGs observed, so we have chosen to conduct our analysis using the entire sample of visit records.
Table A1
Control Variables Used in Analysis
Mean Standard Deviation Birth weight 0–999 grams 0.001
Birth weight 1,000–1,499 grams 0.003 Birth weight 1,500–2,499 grams 0.043 Birth weight 2,500–3,499 grams 0.476 Congenital/perinatal 0–3 0.156
Number of congenital/perinatal 0–3 0.222 0.587 Congenital/perinatal 4–8 0.016
Number of congenital/perinatal 4–8 0.027 0.263 Congenital/perinatal 9–13 0.012
Number of congenital/perinatal 9–13 0.019 0.209 Congenital/perinatal 14–18 0.013
Number of congenital/perinatal 14–18 0.019 0.208 Mother married at birth 0.843
Mother⬍20 at birth 0.073 Mother⬎⳱20, ⬍25 at birth 0.298 Mother⬎⳱25,⬍35 at birth 0.581 Mother 35Ⳮat birth 0.048
Child male 0.514
Child first born 0.308
Child second born 0.377
Child third born 0.191
Child fourth born 0.072
Child fifth born or higher 0.052 Number of children in family⳱2 0.294 Number of children in family⳱3 0.342 Number of children in family⳱4 0.18 Number of children in family⳱5 0.184
Birth year 1979 0.076
Birth year 1980 0.1
Birth year 1981 0.119
Birth year 1982 0.154
Birth year 1984 0.171
Birth year 1985 0.139
Birth year 1986 0.118
Birth year 1987 0.123