Is Welfare Reform Responsible for
Low-Skilled Women’s Declining Health
Insurance Coverage in the 1990s?
Thomas DeLeire
Judith A. Levine
Helen Levy
a b s t r a c t
We use data from the 1989–2001 March Supplements to the Current Population Survey to determine whether welfare reform contributed to declines in health insurance coverage experienced by low-skilled women. Between 1988 and 2000, women with less than a high school education experienced an 8.0 per-centage point decline in the probability of having health insurance. Against this backdrop of large declines, welfare waivers and TANF are associated with modest increases in coverage for low-skilled women of 2.3 and 3.6 percentage points respectively. Overall, our findings suggest that welfare reform did not contribute to declines in coverage but rather offset them somewhat.
I. Introduction
Low-income, low-skilled individuals are disproportionately likely to be without health insurance coverage. Among individuals with less than a high school
Thomas DeLeire is a senior analyst at the Congressional Budget Office and assistant professor of economics at Michigan State University. Judith A. Levine is an assistant professor of social service administration at the University of Chicago. Helen Levy is a research assistant professor at the University of Michigan’s Institute for Social Research. The authors would like to thank the Robert Wood Johnson Foundation’s Economic Research Initiative on the Uninsured at the University of Michigan for financial support, Vanessa Coca, Melissa Ford Shah, Patrick Wightman, and James Larson for excellent research assistance and Rebecca Blank, Mark Duggan, Catherine McLaughlin, Robert Moffitt, two anonymous reviewers, and seminar participants at the University of Michigan and at Harvard University for helpful comments. The authors especially thank Anna Aizer for generously sharing her SCHIP data and Jonah Gelbach for providing the details of his previ-ous work. The views expressed in this paper are those of the authors and should not be interpreted as those of the Congressional Budget Office. The data used in this article can be obtained beginning January 2007 through December 2010 from Thomas DeLeire, Department of Economics, Michigan State University, 110 Marshall-Adams Hall, East Lansing, MI 48824, deleire@msu.edu.
[Submitted October 2004; accepted October 2005]
ISSN 022-166X E-ISSN 1548-8004 © 2006 by the Board of Regents of the University of Wisconsin System
education, 29.6 percent were uninsured in 2003 compared with 17.0 percent of Americans overall (U.S. Census Bureau 2004). During the 1990s, this group also experienced the largest decline in coverage in spite of the fact that eligibility for pub-lic health insurance through Medicaid or State Children’s Health Insurance Programs (SCHIP) was expanding. One possible explanation for this apparent contradiction lies in the concurrent changes to other welfare programs. The work-oriented welfare reforms of the mid-1990s may have increased the income and labor supply of poor women to the point where they are no longer eligible for public coverage but remain unable to afford private coverage, thus increasing the number of the uninsured.
In research on the effects of welfare reform, outcomes such as earnings, program par-ticipation, and marriage have received enormous attention relative to alternative measures of well-being such as health insurance coverage. In this paper, we contribute to a small but growing number of papers examining how welfare reform affected health insurance coverage (also see Borjas 2003; Kaestner and Kaushal 2003; and Bitler, Gelbach, and Hoynes 2005). We focus on a group likely to be affected by welfare reform—low-skilled women—and examine both trends in insurance coverage and what role, if any, welfare reform policy may have played in those trends. Finally, we ask whether welfare reform had different effects on insurance coverage for different women. Specifically, we are interested in whether effects differ by race and ethnicity and family structure.
Is welfare reform responsible for low-skilled women’s declining health insurance in the 1990s? Certainly the results of “leaver studies” that track the experience of for-mer welfare recipients over time are consistent with this story. For example, Garrett and Holohan (2000) find that among women who have been off welfare for a year or more, 28 percent have public coverage, 22 percent have private coverage, and the remaining 49 percent are uninsured. So while some former welfare recipients do obtain private coverage, many welfare leavers join the ranks of the uninsured.
Leaver studies are subject to a variety of well-known problems, however, the most rel-evant in this case being the lack of any comparison group and the failure to measure the effect of welfare reforms on those who are not already on welfare. Among nonrecipients, it is not obvious that welfare reform would have necessarily led to reductions in health insurance coverage rates. A reduced social safety net may have provided low-skilled women a greater incentive to seek jobs that offer health insurance or to marry. The net effect of welfare reform on low-skilled women will be a combination of the effects on former welfare recipients and on nonrecipients. Because only roughly 10 percent of low-skilled women were welfare recipients in the years before welfare reform, even if we would expect large and negative effects of welfare reform on the probability that low-skilled public assistance recipients have health insurance coverage, a small positive effect of welfare reform on the coverage rates for low-skilled women not on welfare could be the dominant effect. Therefore, it would not be surprising to find either a positive or a negative effect of welfare reform on the insurance coverage rates for low-skilled women. Given the potential of welfare reform to affect both recipients and similarly skilled nonrecipients, we take a different approach from “leaver” studies. Instead of follow-ing a sample of recipients as they transition off Temporary Assistance to Needy Families (TANF), we use variation across states in the timing of reforms to estimate the effects of welfare reform on public and private coverage for low-skilled women using data from the Current Population Survey (CPS). We find that on average for this group, welfare reform is associated with an increase in private coverage, a decline in The Journal of Human Resources
public coverage, and an overall decline in uninsurance. Thus, our findings address what effects welfare reform has had overall on all low-skilled women (that is, both TANF recipients and potential TANF recipients) and not the effects it had on recipi-ents alone.
Other studies that, like ours, rely on variation across states in caseload decline or in welfare rules to identify the effects of welfare reform have found mixed effects on health insurance. Kaestner and Kaushal (2003) find that welfare caseload declines were associated with a decline in public coverage, an increase in private coverage, and a slight increase in the uninsured population. They conclude, however, that most of the increase in the number of uninsured was not due to welfare reform. Bitler, Gelbach, and Hoynes (2005) rely on variation across states in the timing of reforms to estimate the effects of welfare reform on insurance coverage and measures of access to medical care. Like Kaestner and Kaushal, they find generally negative effects on health insurance coverage of the population likely to have been affected by welfare reform. In contrast, Borjas (2003) finds that welfare reform increasedhealth insurance coverage among immigrants; increases in labor supply resulted in increases in employer-sponsored coverage that more than offset declines in public health insur-ance for this group.
Our results are consistent with Borjas’ (2003) result for immigrants, but at first appear inconsistent with the results of Kaestner and Kaushal (2003) and Bitler, Gelbach, and Hoynes (2005). We believe that the apparent discrepancy between our results and those of Kaestner and Kaushal (2003) is explained by a difference in iden-tification strategy, as we discuss below; once this difference is taken into account, our results are substantially similar to theirs. We also explore the possibility that the dis-crepancy between our results and those of Bitler, Gelbach, and Hoynes is due to dif-ferences in either sample definition or identification strategy, since both differ slightly between our paper and theirs.
Finally, we conduct an analysis by population subgroups within the low-skilled population. We estimate separate effects of welfare reform for subgroups defined by race and ethnicity, marital status and family structure. This analysis shows that gains in coverage as a result of welfare reform were not shared by all groups but instead were concentrated among Whites and Hispanics, and single childless women, which is consistent with other evidence showing that changes in welfare programs may have important effects on the behavior of nonrecipients.1
The rest of the paper proceeds as follows. In Section II, we summarize the litera-ture evaluating the impact of welfare reform on outcomes other than health insurance (earnings, labor supply, and income) and the literature on expansions of public health insurance coverage. We also discuss in greater detail the papers by Kaestner and Kaushal (2003), Borjas (2003) and Bitler, Gelbach, and Hoynes (2005) mentioned above. In Section III, we discuss the empirical approach we use for our analysis. Section IV discusses the Current Population Survey data and our coding of welfare reform information. Section V presents the results of the analysis, and Section VI concludes.
DeLeire, Levine, and Levy 497
II. Background
The Personal Responsibility and Work Reconciliation Act of 1996 (PRWORA) was intended to increase employment, reduce welfare dependence, and encourage poor women to lift themselves out of poverty. Reviews of the literature on the impacts of welfare reform (Blank 2002; Grogger, Karoly, and Klerman 2002) show that since 1996, employment and earnings among poor women have increased (Moffitt 1999; Schoeni and Blank 2000), marriage has increased (Schoeni and Blank 2000), and welfare caseloads have dropped dramatically (Bell 2001; Blank 2001; Ziliak et al 2000).
There is less evidence, however, on the association between welfare reform and other measures of economic well-being. In particular, there has been very little research on rates of health insurance coverage among the population likely to be affected by PRWORA. Evaluating the impact of PRWORA on health insurance is complicated by two factors. First, employer-sponsored health insurance coverage had been declining among workers since at least 1979, and the declines were most pro-nounced for the least-skilled workers (Farber and Levy 2000, p. 112). Second, expan-sions of public coverage began in the late 1970s and continued to occur throughout the 1990s, which caused some (but not all) of the decline in private coverage (Blumberg, Dubay and Norton 2000, Cutler and Gruber 1996, Dubay and Kenney 1997, Ham and Shore-Sheppard 2005, Shore-Sheppard, Buchmueller, and Jensen 2000). Thus, PRWORA occurred against a backdrop of much longer-term changes in the health insurance landscape for low-skilled individuals.
In spite of these difficulties, a number of studies have undertaken the task of eval-uating PRWORA’s impact on health insurance coverage. One group of these, the “leaver” studies, generally finds that welfare reform led to a decline in Medicaid cov-erage that was only partially offset by increases in private health insurance covcov-erage (Acs, Loprest, and Roberts 2001, Grogger, Karoly, and Klerman 2002, Ku and Garrett 2000, Loprest 1999). Leaver studies strongly suggest that welfare reform must have reduced insurance coverage among the target population.2However, leaver studies
ignore any impact on families not receiving welfare at the time of the reform and also ignore the impact on families who receive welfare but do not leave within the analy-sis window.
This limitation of the leaver studies is potentially important: research has shown that potential welfare recipients behave strategically in their use of welfare benefits in response to the imposition of time limits (Grogger 2004), so it is not at all far-fetched to think that welfare reform might have affected health insurance coverage among
potentialwelfare recipients. For example, a reduced social safety net may have pro-vided low-skilled women a greater incentive to seek jobs that offer health insurance. The net effect of welfare reform on low-skilled women will be a combination of the effects on former welfare recipients and on nonrecipients. According to our calcula-tions from the March Annual Income Supplements to the Current Population Survey (March CPS), between 10 and 12 percent of women with less than a high school degree received Aid to Families with Dependent Children in the years before welfare The Journal of Human Resources
498
reform. Even if welfare reform drastically reduced health insurance coverage among low-skilled welfare recipients, a small positive effect of welfare reform on the cover-age rates for low-skilled women not on welfare could be the dominant effect since the latter group represents roughly 90 percent of low-skilled women. Therefore, it would not be surprising to find either a positive or a negative effect of welfare reform on the insurance coverage of low-skilled women.
Given the potential of welfare reform to affect both recipients and similarly skilled nonrecipients, we take a different approach from “leaver” studies. Instead of following a sample of recipients as they leave TANF, we examine coverage rates of all low-skilled women in the years both before and after welfare reform (either as imple-mented through state waiver programs or through TANF). Thus, our findings address what effects welfare reform has had overall on all low-skilled women (both TANF recipients and potential TANF recipients) and not the effects it had on recipients alone.
Three other recent studies have taken a similar approach. Kaestner and Kaushal (2003) use the March CPS and find that welfare caseload reductions at the state level are associated with declines in public coverage among low-educated single mothers that were only partially offset by increases in private coverage. Our analysis will dif-fer from theirs in two ways. First, they use other low-educated women as a control group for low-educated single mothers (and thus assume that only single mothers were affected by welfare reform). We chose not to make this assumption since PRWORA removed the penalty for marriage and since married nonrecipients consid-ering leaving their marriages may be affected by reform’s incentives. Instead, we examine effects for all women with low levels of education. Second, Kaestner and Kaushal assume that reform could only affect insurance status through caseload decline. Because we are interested in other ways reform may achieve effects, such as through women’s behavioral responses to their perceptions of changing policy incen-tives, we will look for direct effects of reform on insurance coverage, rather than rely-ing on caseload declines to identify the effects of reform.
Borjas (2003) focuses on the effects of welfare reform on immigrants. His analysis relies on a triple-difference identification strategy: immigrants compared to nonim-migrants (defined two different ways), before and after welfare reform, in states that were more versus less generous in terms of their welfare policies toward immigrants. He finds that welfare reform actually increased health insurance coverage among immigrants: declines in public coverage associated with welfare reform were more than offset by the increases in private coverage that accompanied reform-induced increases in labor supply.
Our analysis is most similar to that of Bitler, Gelbach, and Hoynes (2005). Bitler, Gelbach, and Hoynes rely on variation across states in the presence and timing of waivers and TANF to identify the effects of reform on insurance coverage and several measures of the use of preventive medical care of single women in the Behavioral Risk Factor Surveillance Survey (BRFSS). In some specifications, they also use mar-ried women as a control for single women. Again, we have chosen not to do this as we are concerned that reform may have had effects on married women as well as sin-gle women. Bitler, Gelbach, and Hoynes find reductions in health insurance coverage for Hispanics, as well as reductions in the use of preventive care. Our analytic approach differs from theirs in several ways, such as the difference in identification
strategy (that is, we do not rely on the single versus married comparison) and differ-ences in how the samples are defined. Moreover, while the CPS data do not include measures of medical care use, they do allow us to distinguish between private and public health insurance coverage, which is not possible in the BRFSS. We will dis-cuss these differences in more detail later when we attempt to reconcile our findings with theirs.
III. Methods
Our empirical analysis has three components: first, an analysis of long-term trends in health insurance coverage for women by levels of education between 1988 and 2000; second, an analysis of the impact of welfare reform on the coverage rates of these groups (including a set of specification tests); and third, an analysis of heterogeneity in the impacts of welfare reform on insurance coverage by race and ethnicity and family structure. In addition, we perform some analyses attempting to reconcile our results with those of Bitler, Gelbach, and Hoynes (2005). In the first section of the paper, we focus on measuring the trends in insurance cov-erage for women between 1988–2000. We are primarily interested in trends in health insurance coverage for a group likely to have been affected by changes in the eco-nomic and policy environment in the 1990s, low-skilled women, whom we define as women with less than a high school degree. We contrast the experiences of these women with those of women with more education because the insurance coverage rates of women with more education, especially college educated women, are less likely to be affected by changes in the economy or by policy changes such as welfare reform.
We begin our analysis by calculating the trends in coverage between 1988 and 2000 for women with less than a high school degree and, for comparison, for women overall, for women with a high school degree (including those with some college edu-cation), and for women with a college degree. The time frame we choose to exam-ine—1988 through 2000—is of interest because it is the period in which major welfare policy changes were implemented and because it is a period in which there were dramatic changes in health insurance coverage. Although we are mainly inter-ested in the trend in uninsurance, we also calculate the trends in private and public insurance to determine the degree to which each source of coverage is responsible for changes in uninsurance rates.
We are also interested in how much of the trend in uninsurance is due simply to changes in the demographic composition and employment participation of the groups we study as opposed to other structural changes in policy, the economy, or other aspects of the environment.3To control for demographics and employment, we
esti-mate the following linear regression separately for women overall and for each of our educational groups of women:
The Journal of Human Resources 500
(1) UNINSist= Xistβ+ ∑δsSTATEs+ ∑θtYEARt+ eist
where iindexes individuals, sindexes states, and tindexes years;
UNINSis a dummy variable equal to one if the individual has no health insurance coverage; X is a set of characteristics that vary by individual, state, and year including age, age squared, marital status, employment status (full-time/full-year, full-time/part-year, part-time/full-year, and part-time/part-year), race and ethnicity (nonwhite/non-Hispanic and Hispanic), presence of children in the household by age group (any children aged six or younger, any children aged 7–14, and any chil-dren aged 15–17), and, when education groups are pooled, education (high school, some college, and college).
STATErepresents a vector of state dummy variables; and
YEARrepresents a vector of year dummy variables.
The vector of coefficients on the year dummy variables represents the trend in the probability of being without health insurance coverage controlling for demographic characteristics. We calculate an “adjusted uninsured” trend by adding the year dum-mies from this regression to the average fraction uninsured in 1988.
In the second section of the paper, we turn our attention to the question of how wel-fare reform policies may have affected coverage rates. We consider two phases of welwel-fare reform policies: federal waivers granted to states in the early 1990s to experiment with AFDC rules and the transition from AFDC to TANF stipulated by PRWORA. One method for measuring the implementation of waivers and TANF is like that of Bitler, Gelbach, and Hoynes (2005). We base our measures on data available on the U.S. Department of Health and Human Services (2000) website summarizing the date each state implemented a waiver or TANF. These data (and thus our measure) include only waivers that substantially changed the nature of AFDC such as through introduction of time limits, work requirements, sanctions, family caps, or increased earnings disre-gards. In addition, we count only waivers that applied statewide. TANF implementa-tion is measured as the year in which a state implemented its state plan in response to the PRWORA legislation.4We code a state as having implemented a waiver or TANF
in a year if they have done so by March 1 of that year. In an alternative set of specifi-cations, we recode the waiver or TANF variable as equal to the fraction of the year the waiver or TANF was in place, to reflect mid-year implementation.
In order to assess the relationship between welfare reform and coverage, we esti-mate the following linear regression model for being uninsured by education level (less than high school, high school or some college, college):
(2) UNINSist= Xistα+ β1WAIVERst+ β2TANFst+ γ1MEDICAIDst+ γ2URst + ∑ δsSTATEs+ ∑ θtYEARt+ uist
where:
WAIVERis an indicator equal to one if a state has in place a welfare waiver in year
tand has not yet enacted TANF;
TANFis equal to one if a state had implemented TANF as of year t;
DeLeire, Levine, and Levy 501
Xis a set of individual characteristics that vary by individual, state, and year includ-ing age, age squared, race and ethnicity (nonwhite/non-Hispanic and Hispanic), number of children in the household by age group (any children aged six or younger, any children aged 7–14, and any children aged 15–17).
MEDICAIDis a set of Medicaid and S-CHIP program variables (Medicaid eligi-bility level for infants as a percent of the federal poverty level, Medicaid eligieligi-bility level for pregnant women as a percent of the federal poverty level, and an indica-tor equal to one if the state had an S-CHIP program);
URis the state-level unemployment rate;
STATErepresents a vector of state dummy variables; and
YEARrepresents a vector of year dummy variables.
The coefficients on the waiver and TANF dummy variables measure the relationship between welfare reform and the probability of being uninsured. Although we employ extensive controls, especially in our specification tests described below, to capture dif-ferences across states and over time in the broader economic and policy environment, we recognize the difficulty of isolating the pure effect of welfare reform. Given our extensive controls, we interpret these coefficients as the effect of reform, but do so cau-tiously. We discuss this issue further in our conclusion. As with Equation 1, we esti-mate Equation 2 for women overall and for each of our education groups of women. We also estimate Equation 2 using two additional dependent variables: PRIVATE, an indicator for whether the individual had private health insurance coverage from any source (own-employer, spouse’s employer, nongroup market), and PUBLIC, an indi-cator for whether the individual had public coverage (which is mostly Medicaid).
Throughout the paper, we refer to the model represented by Equation 2 as our “baseline” model. We also run several variations of the baseline model to assess how robust our results are across different specifications. We estimate these variations of the baseline model only for our main group of interest—women with less than a high school education.
We perform six specification tests. In the first test, we add employment status con-trols to the baseline model. We include whether a respondent is employed full-time/full-year, full-time/part-year, part-full-time/full-year, and part-time/part-year (not employed is omitted). We do not include employment controls in the baseline model since employment itself may be affected by welfare reform. However, since they are a likely predictor of insurance coverage, we are interested in exploring whether their inclusion changes the observed relationship between reform and coverage. Similar reasoning applies to our treatment of marital status. Since marriage may be affected by reform, we exclude it from our baseline model. In our second specification test, however, we include marital status as a control since insurance coverage through a spouse is a common form of coverage, particularly for women.
In our third specification test, we include additional controls to capture the state economy. An obvious concern in a specification like ours is whether the reform vari-ables are picking up effects of other state-level characteristics that may too be chang-ing over time. In our baseline model, we address this concern by includchang-ing measures for state-level unemployment rate as well as several aspects of the state’s Medicaid program. To test whether inclusion of additional state-level controls would change our observed relationship between reform and coverage, in this specification test we also The Journal of Human Resources
include measures for lagged unemployment rate, employment growth, lagged employment growth, and the natural logarithm of the state maximum AFDC/TANF benefit level for a family of three. Our inclusion of extensive state-level economic and policy variables, as well as year and state dummies, increases our confidence that we are isolating the effect of welfare reform. Thus, we cautiously interpret our results as capturing a welfare reform effect.
In the fourth specification test, we restrict the age range of our sample to women between the ages of 20 and 45, when women are most likely to have children younger than the age of 18 in the home. Women in this age range may be more likely to respond to changes in welfare rules. This narrower range is also the one used by Bitler, Gelbach, and Hoynes (2005). We chose to use the 18–64 age range in our base-line model because it captures a fuller span of potential workers and because some women younger than 20 or older than 45 may still be potentially eligible for cash assistance and therefore respond to changes in welfare policy. However, to ensure that our more liberal choice does not unduly affect results, we re-estimate the baseline model with the restricted age range.
As discussed below, we use data from the March CPS in which respondents are asked about their insurance coverage in the calendar year prior to the survey date. Swartz (1986) has suggested the possibility, however, that survey respondents actu-ally answer the health insurance questions as if they were asked about coverage at the time of the survey, rather than coverage in the previous calendar year. To address this possibility, in our fifth specification test, we code our health insurance variables as if they measure coverage at the survey date rather than in the prior year. We then rerun the baseline model with the newly coded health insurance variables. In our sixth and final specification test, we recode the waiver or TANF variable as equal to the fraction of the year the waiver or TANF was in place, to reflect mid-year implementation.
In the third section of our data analysis, we are interested in determining how wel-fare reform differentially affected different groups. We estimate Equation 2 separately for women of different races and ethnicities (White/non-Hispanic, Black/non-Hispanic, and Hispanic), for married and unmarried women, by parenthood status (mothers and women without children), and by family structure (single mothers, unmarried women with no children, and married mothers).
After showing the results from the three components of our own analysis, we per-form analyses to explore the differences in our results from those of Bitler, Gelbach, and Hoynes (2005), since our approach is similar to theirs but uses a different dataset. We compare our results by, step by step, changing our sample definition to match theirs exactly and by using Bitler, Gelbach, and Hoynes’ identification strategy in order to determine whether differences in sample definition (and, if so, which element of our definition), differences in identification strategy, or some difference between the two datasets themselves that accounts for the difference in results across the two papers.
IV. Data
The data for the analyses conducted in this paper come from the March CPS. Our sample consists of 580,364 women aged 18 to 64 from the 1989 to 2001 years of the March CPS. Of these women, 91,124 have less than a high school
The Journal of Human Resources
504
Table 1
State Implementation of Waivers and TANF as of March 1
State 1988 1989 1990 1991 1992 1993 1994 1995 1996 1997 1998 1999 2000
Alabama 0 0 0 0 0 0 0 0 0 2 2 2 2
Alaska 0 0 0 0 0 0 0 0 0 0 2 2 2
Arizona 0 0 0 0 0 0 0 0 1 2 2 2 2
Arkansas 0 0 0 0 0 0 0 1 1 1 2 2 2
California 0 0 0 0 0 1 1 1 1 1 2 2 2
Colorado 0 0 0 0 0 0 0 0 0 0 2 2 2
Connecticut 0 0 0 0 0 0 0 0 1 2 2 2 2
Delaware 0 0 0 0 0 0 0 0 1 1 2 2 2
D.C. 0 0 0 0 0 0 0 0 0 2 2 2 2
Florida 0 0 0 0 0 0 0 0 0 2 2 2 2
Georgia 0 0 0 0 0 0 1 1 1 2 2 2 2
Hawaii 0 0 0 0 0 0 0 0 0 1 2 2 2
Idaho 0 0 0 0 0 0 0 0 0 1 2 2 2
Illinois 0 0 0 0 0 0 1 1 1 1 2 2 2
Indiana 0 0 0 0 0 0 0 0 1 2 2 2 2
Iowa 0 0 0 0 0 0 1 1 1 2 2 2 2
Kansas 0 0 0 0 0 0 0 0 0 2 2 2 2
Kentucky 0 0 0 0 0 0 0 0 0 2 2 2 2
Louisiana 0 0 0 0 0 0 0 0 1 2 2 2 2
Maine 0 0 0 0 0 0 0 0 0 2 2 2 2
Maryland 0 0 0 0 0 0 0 0 1 2 2 2 2
Massachusetts 0 0 0 0 0 0 0 0 1 2 2 2 2
Michigan 0 0 0 0 0 1 1 1 1 2 2 2 2
DeLeire, Le
vine, and Le
vy
505
Mississippi 0 0 0 0 0 0 0 0 1 1 2 2 2
Missouri 0 0 0 0 0 0 0 0 1 2 2 2 2
Montana 0 0 0 0 0 0 0 0 1 2 2 2 2
Nebraska 0 0 0 0 0 0 0 0 1 2 2 2 2
Nevada 0 0 0 0 0 0 0 0 0 2 2 2 2
New Hampshire 0 0 0 0 0 0 0 0 0 2 2 2 2
New Jersey 0 0 0 0 0 1 1 1 1 1 2 2 2
New Mexico 0 0 0 0 0 0 0 0 0 0 2 2 2
New York 0 0 0 0 0 0 0 0 0 0 2 2 2
North Carolina 0 0 0 0 0 0 0 0 0 2 2 2 2
North Dakota 0 0 0 0 0 0 0 0 0 0 2 2 2
Ohio 0 0 0 0 0 0 0 0 0 2 2 2 2
Oklahoma 0 0 0 0 0 0 0 0 0 2 2 2 2
Oregon 0 0 0 0 0 1 1 1 1 2 2 2 2
Pennsylvania 0 0 0 0 0 0 0 0 0 0 2 2 2
Rhode Island 0 0 0 0 0 0 0 0 0 0 2 2 2
South Carolina 0 0 0 0 0 0 0 0 0 2 2 2 2
South Dakota 0 0 0 0 0 0 0 1 1 2 2 2 2
Tennessee 0 0 0 0 0 0 0 0 0 2 2 2 2
Texas 0 0 0 0 0 0 0 0 0 2 2 2 2
Utah 0 0 0 0 0 1 1 1 1 2 2 2 2
Vermont 0 0 0 0 0 0 0 1 1 2 2 2 2
Virginia 0 0 0 0 0 0 0 0 1 2 2 2 2
Washington 0 0 0 0 0 0 0 0 1 2 2 2 2
West Virginia 0 0 0 0 0 0 0 0 1 2 2 2 2
Wisconsin 0 0 0 0 0 0 0 0 1 1 2 2 2
Wyoming 0 0 0 0 0 0 0 0 0 2 2 2 2
The Journal of Human Resources 506
degree, 367,712 have a high school degree, and 121,528 have a college degree. All of our analyses conducted using data from the March CPS are weighted using the March supplemental survey weights provided with the CPS.
The March CPS provides information on demographic characteristics, employment, income, and public and private health insurance coverage. Unlike the employment and earnings questions in the basic monthly CPS, which refer to employment in the week before the one in which the survey takes place and usual earnings on the job held during that week, the March supplement questions pertain to employment, earnings and income during the entire calendar year before the year in which the survey takes place. For exam-ple, the March 1992 supplement contains information on the longest job held by the respondent in 1991, the number of weeks worked, usual hours worked on this job, total earnings, and industry and occupation codes. Similarly, the health insurance questions in the March supplement ask whether the respondent had coverage from a particular source (for example, through her own employer or from Medicaid) at any time during the pre-vious calendar year.5The employment and health insurance questions in the March
sup-plement therefore refer to the same reference period: the calendar year before the year of the survey. Having information on a full year’s employment allows us to differentiate between workers with strong and weak attachments to the labor force in a way that is not possible in the basic monthly CPS. Specifically, we are able to categorize every adult in the sample as either a nonworker; a full-time, full-year worker; a part-time, full-year worker; a full-time, part-year worker, or a part-time, part-year worker.
One limitation of the March CPS data for our analysis is that information on mar-ital status, education, and the presence of children in the household refer to the sur-vey date, rather than to the prior calendar year. Therefore, there will be some temporal mismatch between our information on employment and health insurance coverage and our information on (for example) marriage. There is also the possibility men-tioned above that survey respondents answer the health insurance questions as if they were asked about coverage at the time of the survey, rather than coverage in the pre-vious calendar year (Swartz 1986). An additional concern with the March CPS data stem from changes in the survey questions regarding health insurance that occurred in 1995 (see Swartz 1997 for a discussion). Some of the year to year changes in health insurance coverage—in particular the change from 1994 to 1995—are partially the result of changes in the survey. However, because we include a full set of year con-trols in our analysis of the effects of welfare reform, survey changes are not likely to affect these results.6
Table 1 shows when waivers and TANF were implemented in each state. This is the information we use to code the waiver and TANF dummy variables in our regression specification. Combining this information with the March CPS data shows that in 1993, the first year any waivers were implemented, 21 percent of all women (and 23 percent of low-skilled women) lived in states that had a waiver in place. By 1996, half
5. Out of the 425,242 individuals with health insurance coverage from a private source in our sample, 22,338 also reported being covered by public health insurance. In all of our analyses reported below, we treated indi-viduals with both private and public health insurance as having private health insurance. All of our results are robust to categorizing this group as publicly insured instead.
DeLeire, Levine, and Levy 507
of all women lived in states that had implemented waivers. By 1998, all states had implemented TANF.
V. Results
A. Trends in Women’s Health Insurance Coverage, 1988–2000
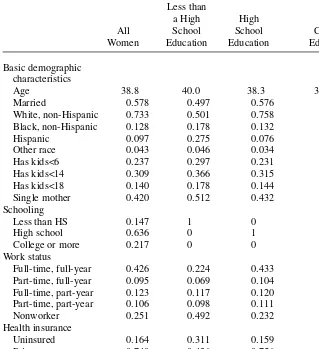
We begin our discussion of results with a set of descriptive tables. In Table 2, we show demographic characteristics and health insurance coverage rates pooled across all years (1988–2000) for all women and for women by educational attainment (less than a high school degree, high school degree but no college degree, college degree). Almost one-third (31.1 percent) of low-skilled women (women with less than a high school education) do not have health insurance coverage. In contrast, only 16.4 per-cent of all women overall, 15.9 perper-cent of women with a high school diploma, and 8.0 percent of female college graduates are without health insurance coverage.
One quarter of low-skilled women are covered by public health insurance. This frac-tion is much lower for women with a high school degree (8.5 percent) and for women with a college degree (2.2 percent). Low-skilled women also differ from women with higher levels of education in other ways. For example, women with less than a high school education are less likely to be employed and less likely to be married than are women with more education. In addition, family income for women with less than a high school education is substantially below that of any of the other groups (authors’ calculations of March CPS data, not shown). These differences are likely to contribute to the lower rates of insurance coverage for low-skilled women.
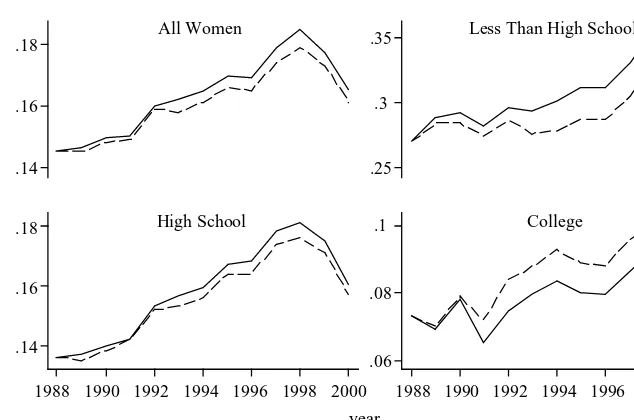
In Figure 1, we show 1988–2000 trends in the fraction uninsured (both unadjusted and adjusted for demographic traits and employment) for women overall and by education level. For women overall, the fraction uninsured increased from 0.145 in 1988 to a high of 0.185 in 1998 and fell to 0.165 by 2000. For women with less than a high school edu-cation, the fraction uninsured started higher and increased even more dramatically from 1988 to 1998 (from 0.270 to 0.356) and barely decreased in 1999 and 2000 (to 0.350). (Appendix Table A1 provides fractions uninsured, adjusted uninsured, and insured through private and public coverage for each education group from 1988–2000).
The trends in the fraction uninsured for female high school graduates mirror the trends for women overall—increasing from 0.136 in 1988 to 0.181 in 1998 and falling to 0.161 by 2000. Relative to the large increases in the fraction uninsured for women with lower levels of education, the fraction of female college graduates uninsured changes little over this time period (rising from 0.073 in 1988 to 0.093 in 1998 and falling to 0.079 in 2000).
The Journal of Human Resources 508
Table 2
Means of Selected Variables
Less than
a High High
All School School College
Women Education Education Education
Basic demographic characteristics
Age 38.8 40.0 38.3 39.2
Married 0.578 0.497 0.576 0.636
White, non-Hispanic 0.733 0.501 0.758 0.816
Black, non-Hispanic 0.128 0.178 0.132 0.079
Hispanic 0.097 0.275 0.076 0.040
Other race 0.043 0.046 0.034 0.065
Has kids<6 0.237 0.297 0.231 0.212
Has kids<14 0.309 0.366 0.315 0.254
Has kids<18 0.140 0.178 0.144 0.103
Single mother 0.420 0.512 0.432 0.323
Schooling
Less than HS 0.147 1 0 0
High school 0.636 0 1 0
College or more 0.217 0 0 1
Work status
Full-time, full-year 0.426 0.224 0.433 0.541
Part-time, full-year 0.095 0.069 0.104 0.085
Full-time, part-year 0.123 0.117 0.120 0.134
Part-time, part-year 0.106 0.098 0.111 0.095
Nonworker 0.251 0.492 0.232 0.145
Health insurance
Uninsured 0.164 0.311 0.159 0.080
Private coverage 0.740 0.436 0.756 0.898
Public coverage 0.096 0.253 0.085 0.022
Sample n 580,364 91,124 367,712 121,528
Note: Data pooled from 1989 through 2001 March Current Population Surveys. All statistics are weighted using the March supplemental survey weights provided with the CPS.
ultimately declining by 2000 to 0.220 making the overall decline in public coverage 1.4 percentage points over the entire period. For women with a high school education, the patterns are similar to those for low-skilled women but the magnitude of the fluc-tuations is smaller.
marital status, and other characteristics as discussed above. For college educated women, the change in uninsurance over the 1988–2000 period is small and comparing actual and adjusted fractions of women without health insurance coverage explains lit-tle of the change. However, for women with less than a high school education or a high school degree, controlling for changes in demographic characteristics explains roughly half of the increase in the fraction uninsured. For women with less than a high school degree, however, this leaves a 3.6 percentage point drop in insurance coverage unex-plained by changes in their characteristics.
B. The Relationship between Welfare Reform and Women’s Health Insurance Coverage
The results of our baseline model of the relationship between our welfare reform measures and the probability of being uninsured, having private health insurance cov-erage, and of having public health insurance coverage are presented in Table 3. The first two rows of the table report the coefficients on the waiver and TANF indicators. Recall that these indicators are equal to one if the respondent is surveyed in a year and state with a welfare waiver in place but not TANF (first row) and with TANF (second row).7Standard errors that are robust to the presence of correlated errors at the state
level are included in parentheses beneath the coefficients.
DeLeire, Levine, and Levy 509
.14 .16 .18
.14 .16 .18
.25 .3 .35
.06 .08 .1
1988 1990 1992 1994 1996 1998 2000 1988 1990 1992 1994 1996 1998 2000
All Women Less Than High School
High School College
Uninsured Adjusted Uninsured
year
Figure 1
Trends in the Fraction of Women Uninsured by Education Level
The Journal of Human Resources
510
Table 3
Welfare Reform and Health Insurance Coverage Among Women by Education Level
(1) (2) (3) (4) (5) (6) (7) (8) (9)
Less Than High School High School College
Uninsured Private Public Uninsured Private Public Uninsured Private Public
Waiver in effect −0.023 0.025 −0.002 −0.005 0.008 −0.004 0.005 −0.003 −0.002 (0.010)* (0.009)** (0.009) (0.004) (0.004)* (0.002) (0.002)* (0.004) (0.003)
TANF in effect −0.036 0.029 0.006 −0.013 0.013 −0.000 0.008 −0.010 0.002
(0.014)* (0.019) (0.018) (0.005)* (0.007)* (0.004) (0.006) (0.008) (0.003) State has SCHIP program 0.021 −0.019 −0.002 0.002 −0.003 0.001 0.005 −0.000 −0.004
(0.017) (0.015) (0.011) (0.005) (0.007) (0.007) (0.009) (0.012) (0.005) Percent of federal poverty −0.043 0.015 0.028 −0.008 −0.001 0.009 −0.008 0.009 −0.001
limit for infants (0.011)** (0.017) (0.013)* (0.005) (0.007) (0.003)* (0.005) (0.005) (0.002) Percent of federal poverty 0.007 −0.008 0.001 −0.000 0.003 −0.002 0.002 −0.002 0.000
limit for pregnant women (0.012) (0.012) (0.015) (0.004) (0.008) (0.005) (0.004) (0.005) (0.003) State unemployment rate −0.000 −0.586 0.586 0.206 −0.416 0.209 0.271 −0.278 0.007
(0.426) (0.327) (0.317) (0.130) (0.152)** (0.108) (0.125)* (0.159) (0.096) Mean of the dependent 0.311 0.436 0.253 0.159 0.756 0.085 0.080 0.898 0.022
variable
Sample n 91,124 367,712 121,528
DeLeire, Levine, and Levy 511
For women with less than a high school education, welfare waivers are associated with a 2.3 percentage point decline in the probability of being uninsured (p-value = 0.027). All of this decline in uninsurance is due to an increase in private, rather than public, cov-erage since waivers are associated with a 2.5 percentage point increase in the probability of having private insurance (p-value = 0.006) and with no change in the probability of having public health insurance. TANF reduced uninsurance among low-skilled women by 3.6 percentage points (p-value = 0.012), increasing private coverage by 2.9 percent-age points although this result is not statistically significant. TANF was also associated with a 1.3 percentage point decline in uninsurance among women with a high school edu-cation; waivers had no effect on this group. Among women with a college degree, nei-ther waivers nor the implementation of TANF are related to coverage in a sizeable or statistically significant way.
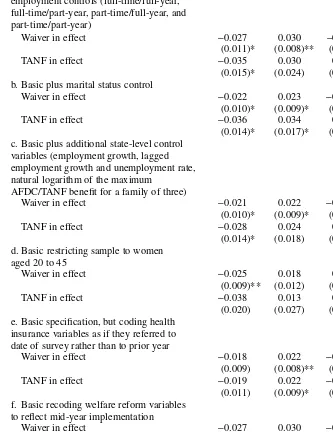
Table 4 shows the results of our six specification tests run on the sample of women with less than a high school education. The first two rows of Table 4 show the waiver and TANF coefficients when we add employment controls to the baseline model from Table 3. This first specification test results in no substantial change in the relationship between reform and coverage. The next two rows show the coefficients on our reform variables once marital status is added to the baseline model. In this second test, the only substantial change in results is that the TANF effect on private coverage increases slightly from 0.029 to 0.034 and becomes statistically significant. The effect on uninsurance is unchanged.
In our third test, the inclusion of additional state-level controls, the general pattern of results is again unchanged. The only change we observe is that the size of the TANF coefficient in the model predicting uninsurance declines somewhat in size from
−0.036 to −0.028. Controlling for state-level economic conditions and social policies is clearly important, but it does not seem to matter substantively whether we use unemployment rates alone or additional economic measures nor does including the maximum AFDC/TANF benefit or just Medicaid rules appear to have great impact. The specific variables included may not matter in part because we always include state fixed effects.
When we restrict the age range of our sample from women aged 18–64 to women aged 20–45 in our fourth test, again we see no major change in the pattern of results for uninsurance. However, the coefficients on both of our reform variables on private coverage decrease somewhat in size (for waivers from −0.025 to −0.018 and for TANF from −0.036 to −0.013) and become statistically insignificant while the coeffi-cients measuring the effect of reform on public coverage increase in size.
Table 4
Specification Tests Among Women with Less Than a High School Education
(1) (2) (3)
Uninsured Private Public
a. Basic specification (from Table 3) plus employment controls (full-time/full-year, full-time/part-year, part-time/full-year, and part-time/part-year)
Waiver in effect −0.027 0.030 −0.002
(0.011)* (0.008)** (0.009)
TANF in effect −0.035 0.030 0.005
(0.015)* (0.024) (0.024)
b. Basic plus marital status control
Waiver in effect −0.022 0.023 −0.001
(0.010)* (0.009)* (0.009)
TANF in effect −0.036 0.034 0.002
(0.014)* (0.017)* (0.016)
c. Basic plus additional state-level control variables (employment growth, lagged employment growth and unemployment rate, natural logarithm of the maximum
AFDC/TANF benefit for a family of three)
Waiver in effect −0.021 0.022 −0.002
(0.010)* (0.009)* (0.010)
TANF in effect −0.028 0.024 0.004
(0.014)* (0.018) (0.019)
d. Basic restricting sample to women aged 20 to 45
Waiver in effect −0.025 0.018 0.008
(0.009)** (0.012) (0.011)
TANF in effect −0.038 0.013 0.025
(0.020) (0.027) (0.028)
e. Basic specification, but coding health insurance variables as if they referred to date of survey rather than to prior year
Waiver in effect −0.018 0.022 −0.004
(0.009) (0.008)** (0.009)
TANF in effect −0.019 0.022 −0.002
(0.011) (0.009)* (0.011)
f. Basic recoding welfare reform variables to reflect mid-year implementation
Waiver in effect −0.027 0.030 −0.002
(0.011)* (0.008)** (0.009)
TANF in effect −0.035 0.030 0.005
(0.015)* (0.024) (0.024)
survey. However, since the public health insurance coverage is somewhat sensitive to this recoding and decreases from −0.002 to −0.004, the coefficient (standard error) measuring the association between welfare waivers and uninsurance is reduced slightly, changing from −0.023 (0.010) to −0.018 (0.009) and becomes statistically insignificant (p-value = 0.057). Thus, while the reform effects on uninsurance are no longer statistically significant, the fact that they are still negative and reform contin-ues to have a positive association with private coverage suggests that the general find-ing that reform has not lowered coverage and may actually have increased it is robust to this recoding.
In our sixth specification test, we recode the waiver or TANF variable as equal to the fraction of the year the waiver or TANF was in place, to reflect mid-year imple-mentation and find almost no change in the estimated effects.
While our fifth test is the only test in which we observe substantial changes in the reform-coverage relationship, it is hard to know exactly what to do with differences between models with insurance coverage coded in keeping with the question word-ing in the survey and those with coverage coded as respondents may have inter-preted questions. Given that we do not know for sure how respondents interinter-preted the coverage questions, and most likely only a portion of respondents are likely to misinterpret the questions, we feel the most prudent choice is to code the ques-tions in keeping with how they were actually asked, as we do in our baseline model. We take the results from the specification test, however, as a caution con-cerning the possible role misinterpretation of the survey questions by respondents may play.
C. Group Differences in the Relationship between Welfare Reform and Insurance Coverage
In Table 5, we show the results of estimating Equation 2 separately for different groups of low-skilled women defined by marital status, parenthood status, family structure and race and ethnicity. These results show that the effects of welfare reform were concentrated in particular groups and, somewhat surprisingly, are similar across other groups. Waivers are associated with roughly the same decline in the probability of being uninsured for both single mothers (2.3 percentage points) and married mothers (2.2 percentage points) though neither effect is statistically signifi-cant. Perhaps surprisingly, TANF is associated with a large decline in uninsurance for unmarried women without children (10.4 percentage points). Even more dramat-ically, waivers are associated with declines in the probability of being uninsured for White and Hispanic women (about 2 percentage points for Whites and about 6 per-centage points for Hispanics) and TANF if associated with a decline in the probabil-ity of being uninsured for Hispanics (also about 5 percentage points). But both waivers and TANF are associated with a (statistically insignificant) increase in unin-surance for non-Hispanic, Black women. The reader should note that Hispanic women comprise roughly 26 percent of women with less than a high school degree according to the March CPS. Thus, the effects of welfare reform on the insurance coverage of low-skilled Hispanic women are an important factor in our baseline esti-mates (reported in Table 3).
The Journal of Human Resources 514
D. Comparing our results to results of other studies
As already noted, our result that health insurance coverage increased among Hispanics as a result of waivers is similar to Borjas’s (2003) result that immigrants in less-generous welfare reform states experienced increases in coverage. Like him, we find that this increase was due to an increase in private coverage, although unlike Borjas we find a slight (insignificant) increase in public coverage for Hispanics where he found large declines for immigrants (as do Kandula et al. 2004). But on the whole, our results for Hispanics are similar to what Borjas finds for nonrefugee immigrants. The comparison of effects across single mothers, married mothers, and single women without children (Table 5) can help reconcile our findings with those of Kaestner and Kaushal (2003). Had we used married women as a control group for single mothers as they did, we would have concluded that waivers were not associated with a change in uninsurance among single mothers. Similarly, had we used single childless women as a control group for single mothers, we would have concluded that waivers were associ-ated with a decline in uninsurance but that TANF was associassoci-ated with an increase in uninsurance among single mothers. We are concerned, however, about the appropriate-ness of married women or single childless women as control groups since they too may experience effects of reform. We chose not to rule out, a priori, the possibility that wel-fare reform might have affected married women or single childless women. And thus we chose not to use other low-skilled women as control groups.
Bitler, Gelbach, and Hoynes (2005) find that welfare reform had no effect on cover-age for Blacks or low-skilled women but had a negative effect on covercover-age for Hispanics. At first glance, with the exception of the findings for Blacks, this is very dif-ferent from our findings, which is particularly surprising since we code the waiver/TANF variables the same way they do (in contrast to Kaestner and Kaushal (2003) and Borjas (2003) who use alternative measures of welfare reform). In fact, most of the apparent differences seem to be due to one of three factors. First, Bitler, Gelbach, and Hoynes, stratify their sample by marital status before performing analyses similar to ours and, in some specifications, rely on a different identification strategy—the com-parison of single versus married women in difference-in-difference-in-difference (DDD) analyses to identify the effects of welfare reform. As noted above we choose not to do this due to our concern that welfare reform may have had effects on married as well as single women making married women an inappropriate control group.8
Second, Bitler, Gelbach, and Hoynes make a variety of different sample restrictions than we do. In particular, they restrict their sample to women aged 20 through 45 while we include women aged 18 through 64, their analysis of Black and Hispanic women includes women at all levels of education while we focus only on women with less than a high school education, and their definition of “low skill” women includes women with a high school diploma while we include only women who did not graduate from high school in this group. Due to data limitations, they use data starting in 1991 on a
DeLeire, Levine, and Levy 515
restricted set of states while our data go back to 1988 and are available for women from all states.9Finally, they use data from the BRFSS while our data are from the CPS.10
To determine whether differences in identification strategy (comparing single women with married women) or differences in sample definition can explain the dif-ferent results across the CPS and BRFSS, we first disaggregate our results for each subgroup (low-skilled, Black, and Hispanic) into single and married women and, sec-ond, redefine our samples, step by step, as Bitler, Gelbach, and Hoynes do. We also conduct the same analyses they do including both our baseline models by subgroup and for each different sample restriction (that is, difference in difference or DD analy-ses) and report DD estimates for both single and married women separately. Finally, we report results, as they do, using married women as a control group for single women (the DDD estimates). The outcome variable in these tables is the same that Bitler, Gelbach, and Hoynes use—any health insurance coverage, public or private. (The BRFSS does not allow for the public vs. private breakdown.) A comparison of results using our data with those of Bitler, Gelbach, and Hoynes on the low-skill and Hispanic samples appear in Tables 6 and 7.11
In Table 6, we see how our results for all low-skilled women by marital status change as we vary our sample restriction. First, our (baseline) estimated relationship between welfare waivers and any health insurance coverage change is reduced as we change the years of analysis from 1988–2000 to 1991–2000 and restrict the sample to women aged 20 to 45. In addition, when we add women with a high school degree to our sample of low-skilled women, the estimated relationship between waivers and coverage becomes smaller and not statistically different from zero. Restricting our sample to those states analyzed by Bitler, Gelbach, and Hoynes increases our esti-mated effect somewhat. By contrast, our (baseline) estiesti-mated relationship between TANF and coverage is robust to all sample changes.
For single women, the estimated association between waivers and having any health insurance coverage becomes somewhat smaller as we change the years of analysis from 1988–2000 to 1991–2000, restrict the sample to women aged 20 to 45, and define low-skilled women as having an education level of a high school degree or less as opposed to less than a high school degree. For married women, however, the coefficient on waivers falls from 0.026 to 0.004, primarily from expanding the sample of low-skilled women to include women with a high school
9. Because data are not available in some states in some years, Bitler, Gelbach, and Hoynes (2005) exclude data from Arkansas, the District of Columbia, Kansas, Nevada, Rhode Island, and Wyoming. We thank Jonah Gelbach for graciously providing us with this information.
10. Bitler, Gelbach, and Hoynes (2005) discuss some of the advantages of the BRFSS as a source of data on health insurance coverage. These include the fact that, unlike in the CPS, the BRFSS question on coverage did not change during the 1991 to 2000 time period, asks about coverage during the survey year, and asks about uninsurance directly. CBO (2003) compares the strengths and weaknesses of using several major nationally representative data sets to compute health insurance coverage rates including the CPS, the Survey of Income of Program Participation, the Medical Expenditure Panel Survey, and the National Health Interview Survey, but not the BRFSS. A major limitation of the BRFSS is that it does not distinguish between public and private sources of coverage.
The Journal of Human Resources
516
Table 5
Welfare Reform and Health Insurance Among Women with Less than a High School Education by Select Characteristics
Single Mother Single, No Children Married with Children
Uninsured Private Public Uninsured Private Public Uninsured Private Public
Waiver in effect −0.023 0.017 0.007 −0.013 0.040 −0.027 −0.022 0.012 0.011
(0.014) (0.017) (0.022) (0.022) (0.023) (0.011)* (0.013) (0.015) (0.009)
TANF in effect 0.010 0.026 −0.036 −0.104 0.069 0.035 −0.029 0.013 0.016
(0.018) (0.026) (0.022) (0.026)** (0.031)* (0.035) (0.030) (0.030) (0.023)
Sample n 25,884 25,884 25,884 18,296 18,296 18,296 27,397 27,397 27,397
White, Non-Hispanic Black, Non-Hispanic Hispanic
Uninsured Private Public Uninsured Private Public Uninsured Private Public
Waiver in effect −0.020 0.019 0.001 0.023 −0.006 −0.017 −0.058 0.041 0.017
(0.009)* (0.012) (0.011) (0.024) (0.014) (0.027) (0.022)* (0.016)* (0.019)
TANF in effect −0.034 0.031 0.003 0.015 0.009 −0.024 −0.049 0.034 0.015
(0.019) (0.022) (0.019) (0.030) (0.049) (0.044) (0.015)** (0.019) (0.018)
DeLeire, Le
vine, and Le
vy
517
Single Married
Uninsured Private Public Uninsured Private Public
Waiver in effect −0.023 0.029 −0.006 −0.026 0.018 0.007
(0.015) (0.011)* (0.016) (0.011)* (0.010) (0.007)
TANF in effect −0.042 0.045 −0.003 −0.030 0.013 0.018
(0.016)* (0.019)* (0.019) (0.022) (0.026) (0.019)
Sample n 44,180 44,180 44,180 46,944 46,944 46,944
No Children Children
Uninsured Private Public Uninsured Private Public
Waiver in effect −0.020 0.031 −0.011 −0.022 0.018 0.004
(0.015) (0.013)* (0.008) (0.011)* (0.011) (0.011)
TANF in effect −0.073 0.052 0.021 −0.007 0.016 −0.009
(0.018)** (0.026)* (0.027) (0.016) (0.021) (0.019)
Sample n 37,843 37,843 37,843 53,281 53,281 53,281
Note: Additional controls include age, age squared, number of children in the household by age group (number of children aged six or younger, number of children aged 7–14, and number of children aged 15–17), a set of year and state dummy variables, and controls for race and ethnicity (nonwhite/non-Hispanic and Hispanic; not included in Panel B). Robust standard errors, clustered by state, are in parentheses. All statistics are weighted using the March supplemental survey weights provided with the CPS. * significant at 5 percent; ** significant at 1 percent.
The Journal of Human Resources
518
Table 6
Comparison with Bitler, Gelbach, and Hoynes, All Low-skilled Women
Dependent variable: Any health insurance (private or public)
(1) (2) (3) (4) (5) (6) (7)
Education <HS <HS <HS HS or less HS or less HS or less HS or less
Ages included 18–64 18–64 20–45 20–45 20–45 20–45 20–45
Start year 1988 1991 1991 1988 1991 1991 1991
States included All All All All All Select Select
Reference year Calendar Calendar Calendar Calendar Calendar Calendar
Source of estimates DLL DLL DLL DLL DLL DLL BGH
Waivers
Coefficient from baseline 0.023 0.016 0.019 0.009 0.009 0.011
(Standard error) (0.010)* (0.009) (0.011) (0.005) (0.005) (0.005)*
Coefficient for single 0.023 0.011 0.019 0.015 0.010 0.011 −0.002
(Standard error) (0.015) (0.012) (0.014) (0.009) (0.007) (0.008) (0.012)
Coefficient for married 0.026 0.024 0.022 0.004 0.007 0.010 −0.010
(Standard error) (0.011)* (0.013) (0.018) (0.005) (0.007) (0.006) (0.009)
Difference −0.003 −0.012 −0.003 0.011 0.004 0.001 0.008
DeLeire, Le
vine, and Le
vy
519
TANF
Coefficient from baseline 0.036 0.034 0.037 0.023 0.023 0.022
(Standard error) (0.014)* (0.013)* (0.019) (0.009)** (0.009)** (0.009)*
Coefficient for single 0.042 0.039 0.035 0.017 0.017 0.016 −0.030
(Standard error) (0.016)* (0.017)* (0.021) (0.010) (0.010) (0.010) (0.021)
Coefficient for married 0.030 0.028 0.042 0.028 0.028 0.027 0.007
(Standard error) (0.022) (0.021) (0.035) (0.011)* (0.011)* (0.011)* (0.014)
Difference 0.012 0.011 −0.007 −0.011 −0.010 −0.011 −0.036
(Standard error) (0.026) (0.027) (0.042) (0.014) (0.013) (0.013) (0.025)
Mean of the dependent variable
Single women 0.687 0.686 0.643 0.700 0.688 0.688 0.692
Married women 0.692 0.674 0.627 0.811 0.799 0.798 0.818
Sample n 91,124 68,206 35,839 175,373 127,096 119,033
The Journal of Human Resources
520
Table 7
Comparison with Bitler, Gelbach, and Hoynes, Hispanic Women
Dependent variable: Any health insurance (private or public)
(1) (2) (3) (4) (5) (6) (7)
Education <HS <HS < HS HS or less HS or less HS or less HS or less
Ages included 18-64 18-64 20-45 20-45 20-45 20-45 20-45
Start year 1988 1991 1991 1988 1991 1991 1991
States included All All All All All Select Select
Reference year Calendar Calendar Calendar Calendar Calendar Calendar
Source of estimates DLL DLL DLL DLL DLL DLL BGH
Waivers
Coefficient from baseline 0.058 0.048 0.036 0.038 0.031 0.033
(Standard error) (0.022)* (0.018)** (0.020) (0.015)* (0.013)* (0.013)*
Coefficient for single 0.063 0.037 0.032 0.057 0.034 0.035 −0.050
(Standard error) (0.031)* (0.021) (0.026) (0.019)** (0.015)* (0.015)* (0.025)*
Coefficient for married 0.066 0.055 0.043 0.024 0.026 0.028 −0.030
(Standard error) (0.026)* (0.027)* (0.029) (0.014) (0.015) (0.016) (0.020)
Difference −0.002 −0.018 −0.011 0.033 0.008 0.007 −0.020
DeLeire, Le
vine, and Le
vy
521
TANF
Coefficient from baseline 0.049 0.044 0.047 0.047 0.048 0.048
(Standard error) (0.015)** (0.012)** (0.021)* (0.018)* (0.018)** (0.018)*
Coefficient for single 0.023 0.008 0.002 0.028 0.027 0.028 −0.092
(Standard error) (0.017) (0.017) (0.022) (0.021) (0.023) (0.024) (0.035)**
Coefficient for married 0.078 0.085 0.097 0.062 0.064 0.063 0.046
(Standard error) (0.025)** (0.022)** (0.033)** (0.027)* (0.026)* (0.027)* (0.022)*
Difference −0.055 −0.078 −0.095 −0.034 −0.038 −0.035 −0.139
(Standard error) (0.031) (0.031)* (0.047)* (0.036) (0.036) (0.038) (0.041)** Mean of the dependent variable
Single women 0.553 0.553 0.548 0.629 0.623 0.623 0.661
Married women 0.530 0.522 0.496 0.670 0.664 0.664 0.691
Sample n 32,224 25,709 16,599 56,981 45,393 43,541
The Journal of Human Resources 522
degree. Thus, the difference (the DDD estimate using married women as a control group for single women), increases from −0.003 to 0.011, though the coefficients are never statistically different from zero. The estimated relationship between TANF and any insurance coverage is mostly unchanged for married women, but falls for single women when we use the more liberal definition of low-skill.12There
continues to be no significant difference between low-skilled single and married women in the effects of TANF. Thus, when we use Bitler, Gelbach, and Hoynes’s identification strategy, we are able to replicate their result of no significant effect of reform on coverage for low-skilled women overall.
For Hispanic women (Table 7), we cannot reconcile our results with those from Bitler et al by either choice of sample restrictions or identification strategy. Regardless of sample definition, we find increases in insurance coverage associated with welfare waivers and with TANF in our baseline model. We also find increases in insurance associated with waivers for single women while Bitler, Gelbach, and Hoynes (2005) find declines. However, the difference between single and married Hispanic women in the effect of welfare waivers and coverage is not statistically sig-nificant for either analysis. We consistently find positive effects of TANF on single women across specifications, in contrast to Bitler, Gelbach, and Hoynes though we also tend to find even larger positive effects for married women. Thus, we generally find negative (and statistically significant in some specifications) differences between the effect of TANF on single and married women while they find a sub-stantially larger, negative, and statistically significant difference.13Therefore, some
difference (other than sample definition or identification strategy) between the CPS data we use and the BRFSS data Bitler, Gelbach, and Hoynes (2005) use is respon-sible for the estimated differences in the effects of welfare reform for Hispanic women.
Given our suspicion that welfare reform may have had effects on married women (which is supported by our findings), we continue to be concerned over the use of married women as a control for single women and thus retain a preference for our DD over the DDD results. Similarly, we prefer our initial sample choices for reasons described above. However, we present readers with the comparisons in Tables 6 and 7 in order to let them make their own choices between findings.
12. We prefer our measure of low-skill since having a high school degree is the modal level of education in the U.S. and thus does not capture low-skill in a comparative sense. We recognize, however, that since the number of women aged 18 to 64 with a high school degree increased over the period of analysis, perhaps, high school graduates are becoming less skilled over time.
DeLeire, Levine, and Levy 523
VI. Conclusion
Our results suggest that welfare reform increased private health insur-ance coverage for women with less than a high school education by 2.5 percentage points while having no substantial impact on public insurance coverage rates. Unlike previous research based on leavers, our findings provide no evidence that welfare reform is responsible for (or, with the exception of African-American women, even contributed to) the decline in health insurance coverage for low-skilled women overall in the 1990s. To the contrary, we find that welfare reform may have helped stem the ongoing decline in coverage that predated welfare reform. This finding does not imply, however, that welfare leavers themselves have not suffered losses in coverage due to reform, nor that we should not be concerned about leavers’ fates.
It is clearly difficult to isolate the effects of reform. Business-cycle changes con-current with policy changes are also likely to affect employment and marriage rates which in turn affect coverage rates. In addition, economic conditions may affect employers’ generosity in offering health benefits to workers. Other changes in the pol-icy environment, particularly those related to public health insurance coverage, occur-ring over the same time period as welfare reform are also likely to have effects on coverage. The late 1990s economic boom and state changes in public coverage eligi-bility rules are both likely predictors of coverage rates.
We have tried to control for these factors in a variety of ways. First, we include year and state controls to capture time trends and state differences in both the economic and policy environments. Second, we employ controls to capture the state of the economy (we employ an especially extensive set of such controls in our specification test in Table 4). In the specification test, we include lagged measures which capture the state of a state’s economy prior to the implementation of waivers and TANF in order to con-trol for the fact that there may be selection of states by economic strength into the implementation of reform. Our observed relationship between reform and coverage is robust to the inclusion of more extensive state-level economic controls, perhaps because our use of state dummies captures much of these factors. Third, we include an extensive set of controls that measure the nature and generosity of Medicaid policy as well as the state maximum AFDC/TANF benefit. Again, we observe our reform-coverage relationship despite the inclusion of these policy measures.