1
kang
INDONESIA’S
BALANCE OF PAYMENTS
REPORT
SECOND QUARTER 2009
2
Contact Address
Balance of Payments Bureau
Directorate of Economic and Monetary Statistics Bank Indonesia
Sjafruddin Prawiranegara Tower, 16th Floor Jl. M.H. Thamrin No. 2
Jakarta 10350
Phone : (021) 3817088
Fax : (021) 3800134
E-mail : [email protected]
3
INDONESIA’S
BALANCE OF PAYMENTS
REPORT
SECOND QUARTER 2009
1
RINGKASAN ……… 1
SUMMARY INDONESIA’S BALANCE OF PAYMENTS IN Q2/2009 AND ITS CONTRIBUTING FACTORS ……… ……… 1 3 CURRENT ACCOUNT 1. Non-Oil and Gas Trade Balance ……… 7
1.1. Non-Oil and Gas Exports ……… 8
1.2. Non-Oil and Gas Imports ……… 14
2. Oil and Gas Trade Balance ……… 16
2.1. Oil ……… 16
2.2. Gas ……… 17
3. Services Account ……… 18
4. Income Account ……… 19
5. Current Transfers ……… 20
CAPITAL AND FINANCIAL ACCOUNT 1. Capital Account ……… 21
2. Financial Account ……… 21
2.1. Public Sector ……… 22
2.2. Private Sector ……… 26
RESERVE ASSETS ……… 31
INDICATORS OF EXTERNAL SUSTAINABILITY ……… 33
2
LIST OF TABLES
Page Page
Table 1 Indonesia’s Balance of Payments and Several Economic Indicators in Q2/2009
5 Table 13 Major Non-Oil and Gas Commodities Imported from Major Countries of Origin
14
Table 2 Major Non-Oil and Gas Commodities Exported to Major Countries of Destination
8 Table 14 Import Value of Raw Materials Based on Country of Origin (C&F)
15
Table 3 Coal Export Value to Major Countries of Destination 9 Table 15 Import Value of Consumption Goods Based on Country of Origin (C&F)
15
Table 4 Machinery & Mechanical Appliances Export Value to Major Countries of Destination
9 Table 16 Import Value of Capital Goods Based on Country of Origin (C&F)
15
Table 5 Electronics Export Value to Several Major Countries of Destination
10 Table 17 Growth of 15 Major Import Commodities 15
Table 6 Value of Rubber Exports to Several Major Countries of Destination
10 Table 18 Oil Exports and Imports 16
Table 7 Value of Shrimp Exports to Several Major Countries of Destination
11 Table 19 Demand and Supply of World Oil 16
Table 8 Copper Export Value to Several Major Countries of Destination
11 Table 20 Exports of LNG, LPG, and Natural Gas 17
Table 9 Nickel Export Value to Several Major Countries of Destination
12 Table 21 Indonesia’s Gas Reserves (billion cubic feet) 18
Table 10 TTP Export Value to Several Major Countries of Destination
12 Table 22 Non-Investment Grant 20
Table 11 Export Value of Chemical Product to Several Major Countries of Destination
13 Table 23 Investment Grant 21
Table 12 CPO Export Value
to Several Major Countries of Destination
14 Table 24 Indicator of External Sustainability 33
LIST OF CHARTS
Page Page
Chart 1 Current Account 7 Chart 10 World CPO Price 13
Chart 2 Non-Oil and Gas Trade Balance 8 Chart 11 Shares of Non-Oil and Gas Imports Based on Major Countries of Origin
14
Chart 3 Shares of Non-Oil and Gas Exports Based on Major Countries of Destination
8 Chart 12 World Oil Prices 17
Chart 4 Coal Unit Price 9 Chart 13 Oil Consumption 17
Chart 5 World Rubber Price 10 Chart 14 Services Account 18
Chart 6 World Shrimp Price 11 Chart 15 Travel Services 19
Chart 7 World Copper Price 11 Chart 16 Income Account 19
Chart 8 World Nickel Price 12 Chart 17 Workers’ Remittances 20
Chart 9 Volume Of Textile and Textile Product (TTP) Exports to Several Major Countries of Destination
12 Chart 18 Capital and Financial Account by Type of Investment
3
LIST OF CHARTS
Page Page
Chart 19 Capital and Financial Account by Sector 22 Chart 29 Government Foreign Loan Position 26
Chart 20 Financial Account of Public Sector 22 Chart 30 Financial Account of Private Sector 27
Chart 21 Yield of Indonesian Global Bond and US T-Note 23 Chart 31 Direct Investment in Indonesia 27
Chart 22 BI Rate and Fed Rate 24 Chart 32 Foreign Direct Investment Inflows in Oil and Gas
Sector
27
Chart 23 SUN & SBI Owned by Foreign Investors 24 Chart 33 Net Foreign Direct Investment in Non-Oil and Gas Sector Based on Country
27
Chart 24 Disbursement and Repayment of Government Loan 24 Chart 34 Net Foreign Direct Investment in Non-Oil and Gas By Sector
28
Chart 25 Program Loan Disbursement 25 Chart 35 Foreign Transactions in IDX and IHSG 28
Chart 26 Project Loan Disbursement 25 Chart 36 Debt Securities Issued by Private Sector 29
Chart 27 Loan Position by Major Creditor Countries 26 Chart 37 Loan Disbursement of Private Sector 29
1
SUMMARY
During Q2/2009, Indonesia's current account posted a US$3.1 billion surplus, up from the US$2.9 billion
surplus in Q1/2009. This surplus more than compensated for the deficit on the capital and financial account,
bringing the overall balance of payments surplus to US$1.1 billion. In response, international reserves climbed
further to US$57.6 billion at end Q2/2009, equivalent to about 5.5 months of imports and official debt service
payments.
The current account surplus was bolstered by more robust surpluses in non-oil and gas trade balance, oil
and gas trade balance and current transfers, with the surpluses in these accounts outweighing the escalation in the
income and services account deficit. The strongest improvement over the preceding quarter was recorded in the
non-oil and gas trade balance, with non-oil and gas exports posted a larger quarterly increase than non-oil and gas
imports. An improving trend in non-oil and gas export performance was also visible in its annual growth (y.o.y),
recorded at negative 17.3% in Q2/2009, a milder decline than in Q1/2009. Contrasting this was the negative 30.6%
growth in non-oil and gas imports during Q2/2009, representing steeper decline compared to Q1/2009 performance
of negative 28.8%. The significant improvement in non-oil and gas exports over the earlier quarter is explained
primarily by persistent strong demand from some Asian economies and further increases in international market
prices for key export products, led by primary commodities such as coal, copper and CPO. On the other hand,
recovery in non-oil and gas imports was constrained by a slowing down in domestic demand growth.
In Q2/2009, the capital and financial account posted a US$2.4 billion deficit following the US$1.8 billion
surplus of the preceding quarter. This deficit resulted from reduced inflows of foreign direct investment, increased
domestic bank and non-bank placements in non-resident banks and higher levels of servicing of official external
debt. The drop in foreign direct investment was consistent with the slowdown in domestic economic growth, while
the rise in servicing of official external debt was due to seasonal factor. The increase in domestic bank and non-bank
placements in non-resident banks should not be considered as a negative development as this condition took place
when the current account recorded a surplus, portfolio capital inflow increased and the demand for foreign
exchange was still limited. In other words, this was a reflection of the growing foreign exchange liquidity and the
anticipation towards a higher demand for foreign exchange in Q2/2009 in line with the expectation of an improving
domestic demand. The capital and financial account received a significant boost in Q2/2009 from portfolio
investment, which recorded an increased surplus over the preceding quarter. Among the factors bolstering the
portfolio investment performance were renewed investor confidence in Indonesia's economic stability and the calm,
orderly national elections.
3
Indonesia’s Balance of Payments (BOP) in Q2/2009 recorded a surplus of USD1.1 billion. The main
contributor was the current account with a surplus of USD3.1 billion. Meanwhile, the capital and financial accounts
posted a deficit of USD2.4 billion. The current account surplus increased compared to the preceding quarter. The
improved performance of current account was stemming from the increased surplus on non-oil and gas trade
balance, oil and gas trade balance, and current transfers, with the surpluses in these accounts compensating the
deficits on services and income account. The capital and financial account was in deficit, after registering a surplus in
the previous quarter, due to the drop of direct investment inflows, the increased of domestic bank and non-bank
placements in overseas banks, and higher levels of servicing of official external debt. Meanwhile portfolio investment
posted a surplus related to the higher investor confidence in economic condition and security matters in Indonesia.
In line with the overall BOP development, the amount of foreign reserves at the end of the period rose to USD57.6
billion or equivalent to 5.5 months of imports and official debt service payments.
Several fundamental factors contributed to the Indonesia’s Balance of Payments during Q2/2009, both
stemming from domestic and foreign aspects, such as:
Despite the fact that several developed countries that are the major trade partners of Indonesia—such as the US, Japan, and the European Union—were still recording negative growth, some Asian trade partners such as
China and India posted positive growth contributing a positive impact to the demand and prices of several
Indonesian prime export commodities. In the meantime, the slowing down of domestic demand in many
countries contributed to inflation pressure that showed a declining tendency. Consequently most of monetary
authorities continued to implement the policy of declining interest rate to sufficiently low level. This situation
provoked investors to place their funds in countries providing high yield such as Indonesia.
The prospect for global economic recovery supported the increased demand for several key non oil and gas
export commodities, such as Crude Palm Oil (CPO), copper and rubber, which then induced the rise of the price
of the said commodities compared to the previous quarter.
The average oil prices (export unit price) rose to USD56.9/bl in Q2/2009 from USD41.8/bl in Q1/2009. This rise in prices was related to the expectation of world’s demand recovery, especially in developed countries such as
the US, European countries, and Japan. Furthermore, the impact of the weakened USD exchange rate against
other main currencies also boosted oil price to a higher level. In line with the world’s oil price development, the
price of gas (LNG) also rose from USD5.5/MBTU in Q1/2009 to USD6.5/MBTU during reporting period.
Indonesian economy grew by 4.0% (y.o.y) during Q2/2009, lower than 4.4% in Q1/2009. From demand side,
the slowing rate was related to the crawling condition of all domestic demand components especially
household consumption. This situation was considered pertaining to the lower expenses of Presidential election
compared to those of legislative election. The slow growth of domestic economy and the decline of exports
became the contributing factors maintaining low import growth rate.
INDONESIA
’
S BALANCE OF PAYMENTS IN Q2/2009 AND ITS
4
Indonesian inflation rate was 3.7% during the reporting period, lower than the preceding quarter (7.9%). This condition was in line with the weakening of domestic demand and the decrease of world commodity price. In
terms of foreign exchange, rupiah strengthened during the reporting quarter with an average rate of
Rp10,531/USD compared to the previous rate of Rp11,631/USD. In line with the low inflation rate and the
strengthening of rupiah against USD and supporting the efforts to boost domestic economic growth, Bank
Indonesia loosened its monetary policy by lowering BI interest rate.
Oil production declined despite the improving oil price. Indonesian oil production in Q2/2009 reached 0.947
million barrels per day, lower than 0.962 million barrels per day in the preceding quarter. In addition to the
natural declining phenomenon, several technical problems on site were contributing to the downturn of oil
production. During the same period, the gas (LNG) export volume lessened from 256.8 MBTU in Q1/2009 to
228.1 MBTU in Q2/2009. Likewise, natural gas export volume decreased from 77.6 MBTU to 76.8 MBTU
during the reporting quarter. Meanwhile oil consumption reached 84.9 million barrels in Q2/2009, higher than
80.7 million barrels in the preceding quarter. The increasing oil demand was related to domestic economic
activities that recorded higher level than the previous quarter, despite its slowing growth. It was also
considered related to the election activities absorbing considerable demand for energy especially in
5
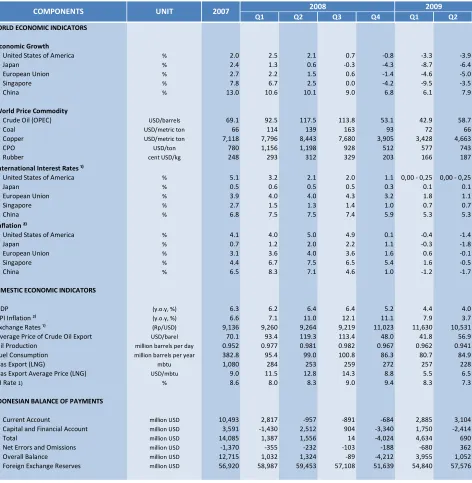
Table 1
Indonesia’s Balance of Payments and
Several Economic Indicators in Q2/2009
Q1 Q2 Q3 Q4 Q1 Q2
WORLD ECONOMIC INDICATORS
Economic Growth
‐ United States of America % 2.0 2.5 2.1 0.7 ‐0.8 ‐3.3 ‐3.9
‐ Japan % 2.4 1.3 0.6 ‐0.3 ‐4.3 ‐8.7 ‐6.4
‐ European Union % 2.7 2.2 1.5 0.6 ‐1.4 ‐4.6 ‐5.0
‐ Singapore % 7.8 6.7 2.5 0.0 ‐4.2 ‐9.5 ‐3.5
‐ China % 13.0 10.6 10.1 9.0 6.8 6.1 7.9
World Price Commodity
‐ Crude Oil (OPEC) USD/barrels 69.1 92.5 117.5 113.8 53.1 42.9 58.7
‐ Coal USD/metric ton 66 114 139 163 93 72 66
‐ Copper USD/metric ton 7,118 7,796 8,443 7,680 3,905 3,428 4,663
‐ CPO USD/ton 780 1,156 1,198 928 512 577 743
‐ Rubber cent USD/kg 248 293 312 329 203 166 187
International Interest Rates ¹⁾
‐ United States of America % 5.1 3.2 2.1 2.0 1.1 0,00 ‐ 0,25 0,00 ‐ 0,25
‐ Japan % 0.5 0.6 0.5 0.5 0.3 0.1 0.1
‐ European Union % 3.9 4.0 4.0 4.3 3.2 1.8 1.1
‐ Singapore % 2.7 1.5 1.3 1.4 1.0 0.7 0.7
‐ China % 6.8 7.5 7.5 7.4 5.9 5.3 5.3
Inflation ²⁾
‐ United States of America % 4.1 4.0 5.0 4.9 0.1 ‐0.4 ‐1.4
‐ Japan % 0.7 1.2 2.0 2.2 1.1 ‐0.3 ‐1.8
‐ European Union % 3.1 3.6 4.0 3.6 1.6 0.6 ‐0.1
‐ Singapore % 4.4 6.7 7.5 6.5 5.4 1.6 ‐0.5
‐ China % 6.5 8.3 7.1 4.6 1.0 ‐1.2 ‐1.7
DOMESTIC ECONOMIC INDICATORS
GDP (y.o.y, %) 6.3 6.2 6.4 6.4 5.2 4.4 4.0 CPI Inflation ²⁾ (y.o.y, %) 6.6 7.1 11.0 12.1 11.1 7.9 3.7 Exchange Rates ¹⁾ (Rp/USD) 9,136 9,260 9,264 9,219 11,023 11,630 10,531 Average Price of Crude Oil Export USD/barel 70.1 93.4 119.3 113.4 48.0 41.8 56.9 Oil Production million barrels per day 0.952 0.977 0.981 0.982 0.967 0.962 0.941 Fuel Consumption million barrels per year 382.8 95.4 99.0 100.8 86.3 80.7 84.9 Gas Export (LNG) mbtu 1,080 284 253 259 272 257 228 Gas Export Average Price (LNG) USD/mbtu 9.0 11.5 12.8 14.3 8.8 5.5 6.5 BI Rate 1) % 8.6 8.0 8.3 9.0 9.4 8.3 7.3
INDONESIAN BALANCE OF PAYMENTS
‐ Current Account million USD 10,493 2,817 ‐957 ‐891 ‐684 2,885 3,104
‐ Capital and Financial Account million USD 3,591 ‐1,430 2,512 904 ‐3,340 1,750 ‐2,414
‐ Total million USD 14,085 1,387 1,556 14 ‐4,024 4,634 690
‐ Net Errors and Omissions million USD ‐1,370 ‐355 ‐232 ‐103 ‐188 ‐680 362
‐ Overall Balance million USD 12,715 1,032 1,324 ‐89 ‐4,212 3,955 1,052
‐ Foreign Exchange Reserves million USD 56,920 58,987 59,453 57,108 51,639 54,840 57,576
Source: CEIC, IMF, World Bank, Bank Indonesia, and other sources ¹⁾ average
²⁾ end‐month position of the relevant quarter
*) temporary data from Forecast Consensus August 2009
7
The current account in Q2/2009 posted a
surplus of USD3.1 billion, higher than a surplus of
USD2.9 billion in Q1/2009. The improved performance
of current account was supported by the increasing
surpluses on non-oil and gas trade balance, oil and gas
trade balance, and current transfers. The larger
surpluses in these three balances exceeded the
increased deficits on services and income accounts.
-5,000 -3,000 -1,000 1,000 3,000 5,000 7,000 9,000
Q.1 Q.2 Q.3 Q.4 Q.1 Q.2 Q.3 Q.4 Q.1 Q.2
2007 2008* 2009**
million USD
Services Income Trade Balance Current Trans. Current Account
Chart 1 Current Account
The increased surplus on non-oil and gas trade
balance compared to the preceding quarter was
resulted from the higher increase in non-oil and gas
exports than the increase in non-oil and gas imports.
Higher increase was recorded in the exports of
natural-based commodities with low import content. In the
midst of weakening domestic demand, such export
profile would consequently impede import of non-oil
and gas.
Meanwhile, the oil trade balance improved. It was
due to the fact that the rise of oil export price was
higher than the increase in oil import price. Despite
falling gas export volume, the surplus of gas trade
balance increased supported by the gas price increase
following the rise of oil price. The current transfers also
improved as a result of a considerable inflow of
workers’ remittances specifically from the Middle East.
On the other side, the increase deficit on services
account was driven among others, by the increase in
import freights. The rise in deficit of the income account
was originated from the increased dividend payments of
foreign direct investment companies, interest/coupon
payments of securities, and the interest payments of
external debt.
1.
Non-Oil and Gas Trade Balance
In Q2/2009 the non-oil and gas trade balance
recorded a surplus of USD6.6 billion, higher than
USD5.3 billion surplus in Q1/2009. The improved
performance of non oil and gas exports was also
reflected in its annual growth (y.o.y) which improved to
negative 17.3% in Q2/2009 compared to negative 22.2
% in Q1/2009. On the contrary, non oil and gas
imports posted a negative growth of 30.6% in
Q2/2009, steeper than minus 28.8% in Q1/2009.
The improvement in non-oil and gas exports
compared to Q1/2009 was mainly due to the
considerable demand from several Asian countries and
the sustained increase in prices of several key export
products in international market such as coal, copper
and CPO. At the same time, the increase in non-oil and
gas imports was hampered by the slowing growth of
domestic demand.
8
1,000 2,000 3,000 4,000 5,000 6,000 7,000 8,000
3,000 8,000 13,000 18,000 23,000 28,000 33,000 38,000
Q.1 Q.2 Q.3 Q.4 Q.1 Q.2 Q.3 Q.4 Q.1 Q.2
2007 2008* 2009**
juta USD juta USD
Export Import Trade Balance (RA)
Chart 2
Non-Oil and Gas Trade Balance
1.1. Non-Oil and Gas Exports
The non-oil and gas exports rose to USD23.1
billion in Q2/2009 compared to USD20.5 billion in
Q1/2009. The strong demand for natural-based
commodities such as mining products (coal) and
manufacturing products (CPO) from several Asian
countries had succeeded to raise export value. Amidst
the ongoing global recession, Indonesian exports were
concentrated in five major countries of destination
namely the US (10.6%), Japan (10.3%), the European
Union (10.1%), China (9.2%) and India (8.0%) with the
following main commodities: clothing to the US and the
European Union, metalliferous ores & metal scrub to
Japan, fixed vegetable oils & fats to China and India.
0.00 3.00 6.00 9.00 12.00 15.00 18.00
Q1 Q2 Q3 Q4 Q1 Q2 Q3 Q4 Q1 Q2
2007 2008 2009*
Sg Jpn EU USA India
(%)
Chart 3
Shares of Non-Oil and Gas Exports Based on Major Countries of Destination
Despite sustaining a negative annual growth,
non-oil and gas exports showed a slowing rate of decline
which was contributed as well by the improved export
performance of most of major commodities.
Performance of natural based commodities (SDA) such
as rubber, copper, nickel, coal, CPO and chemical
products improved significantly. Nevertheless, exports of
several non-SDA manufacturing commodities such as
electrical equipment and machinery & mechanical
appliances also improved.
Table 2
Major Non-Oil and Gas Commodities Exported to Major Countries of Destination
(based on 2digits SITC code, as a % shares of total non-oil and gas exports)
Commodity Share Commodity Share Commodity Share Commodity Share Commodity Share
Clothing 3.4 Metal Ore & scrub 1.6 Clothing 1.5 Vegetable Fats and Oils 2.0 Vegetable Fats and Oils 3.4
Telecommunication Device 1.0 Coal, Coke and Briquettes 1.5 Vegetable Fats and Oils 1.4 Coal, Coke and Briquettes 1.4 Coal, Coke and Briquettes 2.4
Fish and Shrimp 0.8 Non-Iron Metals 1.0 Footwear 1.0 Other Transportation Vehicles 1.0 Metal Ore & scrub 0.9
Coffee, Tea, Cocoa, and Spice 0.6 Electronic Machines 0.7 Telecommunication Device 0.7 Raw Rubber 1.0 Raw Rubber 0.2
9
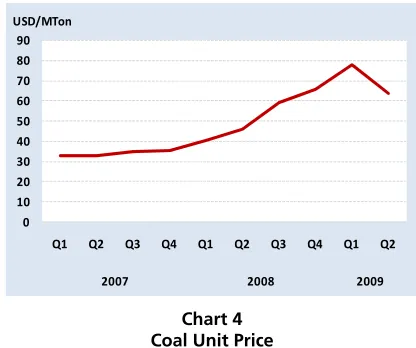
Coal
Coal exports reached USD2.9 billion in Q2/2009 or
increased by 15.3% (y.o.y), slowing down compared to
40.1% increase in Q1/2009 following a weakening
price. Despite the tardy annual growth of this export
commodity, this result still showed an increase of
13.1% (q.t.q) compared to Q1/2009.
0 10 20 30 40 50 60 70 80 90
Q1 Q2 Q3 Q4 Q1 Q2 Q3 Q4 Q1 Q2
2007 2008 2009
USD/MTon
Chart 4 Coal Unit Price
Most Coal exports were based on long term
contracts. Consequently, despite a slight decline in
volume, Indonesian coal still gained a considerable
demand especially from Asian countries such as India,
Taiwan, South Korea, and Malaysia. This demand was
relatively stable due to the use of coal as a source of
energy. The main destinations of coal exports were
India (18.7%), Taiwan (18.6%), South Korea (14.9%),
and Japan (11.5%).
Table 3 Coal Export Value to Major Countries of Destination
Period
Destination Country Value (Million USD) Share (%) Value (Million USD) Share (%)
India 280 11.2 571 19.9
Taiwan 365 14.6 568 19.8
South Korea 325 13.0 455 15.8
Japan 450 18.1 350 12.2
Others 1,072 43.0 928 32.3
Total 2,492 100 2,872 100
Quarter II-2008 Quarter II-2009
Machinery & Mechanical Appliances
Exports of machinery & mechanical appliances was
USD2.2 billion in Q2/2009 or grew by 5.5% (y.o.y),
higher than minus 18.6% in Q1/2009. The improved
exports of machinery & mechanical appliances especially
automotive (road vehicle) to Japan succeeded in
supporting export value. The export destinations of
machinery & mechanical appliances were mainly
Singapore (40.5%), China (11.3%), and Japan (7.9%).
In the framework of enhancing exports of machinery &
mechanical appliances especially automotive products,
Gaikindo will set up collaboration with Australia as the
potential market for automotive industry.
Table 4
Machinery & Mechanical Appliances Export Value to Major Countries of Destination
Period
Destination Country Value (Million USD) Share (%) Value (Million USD) Share (%)
Singapore 457 21.7 972 43.7
China 44 2.1 271 12.2
Japan 268 12.7 190 8.5
Others 1,338 63.5 790 35.5
Total 2,107 100 2,223 100
Q2-2008 Q2-2009
Electronics
Export of electronic products stood at USD2.4
billion or grew by 4.9% (y.o.y). It was improved
compared to minus 4.5% in Q1/2009. The increased
exports were mainly driven by the exports of electronic
goods from Batam to Singapore. Electronic goods
exported by Indonesia were not classified as high-end
products. Therefore, their demand were relatively stable
despite the decrease of purchasing power of the
importing country. The major destinations of
electronics exports were Singapore (24.4%), the US
10
Table 5
Electronics Export Value
to Several Major Countries of Destination
Period
Destination Country Value (Million USD) Share (%) Value (Million USD) Share (%)
Singapore 730 31.5 547 22.5
United States of America 193 8.3 308 12.7
European Union 186 8.0 259 10.7
Japan 367 15.9 229 9.4
Others 839 36.2 1,085 44.7
Total 2,315 100 2,428 100
Q2-2008 Q2-2009
In line with the positive growth of electronics
exports, the government plans to disperse the location
of electronic industries. Currently electronic industries
are concentrated in Java and Batam. In order to reach
the growth target of 7% in 2009, various incentives
had been implemented such as lowering Luxury Tax and
tightening of import procedures. Furthermore, the
Ministry of Industry will enhance product
standardization as a strategy in facing the free trade
era.
Rubber
Rubber exports was USD714 million in Q2/2009 or
recorded a negative growth of 56.7% (y.o.y) compared
to minus 57.9% in Q1/2009. The negative growth was
in line with the decreasing export volume by 16% and
the declining price by 40.0%.
However, compared to the preceding quarter, the
rubber price improved as reflected in the climbing price
in Q2/2009 to USD187.0 cent/kg compared to
USD165.8 cent/kg in Q1/2009. The rise in rubber price
was contributed by the high demand from China as the
major consumer in the world for raw material of tire. In
addition, the political turbulence in Thailand also driven
a price rise due to the uneasiness of investors caused by
the delay in rubber supply from this country, one of the
largest rubber producers in the world.
0 50 100 150 200 250 300 350
Q1 Q2 Q3 Q4 Q1 Q2 Q3 Q4 Q1 Q2
2007 2008 2009
c/kg
Chart 5 World Rubber Price
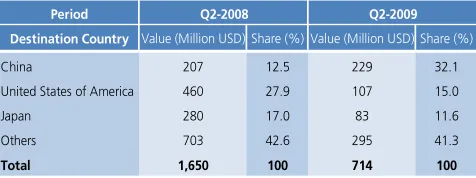
The main destinations of rubber exports in
Q2/2009 were China, the US, and Japan with market
shares of 32.2%, 15%, and 11.6% respectively.
Table 6
Value of Rubber Exports to Major Countries of Destination
Period
Destination Country Value (Million USD) Share (%) Value (Million USD) Share (%)
China 207 12.5 229 32.1
United States of America 460 27.9 107 15.0
Japan 280 17.0 83 11.6
Others 703 42.6 295 41.3
Total 1,650 100 714 100
Q2-2008 Q2-2009
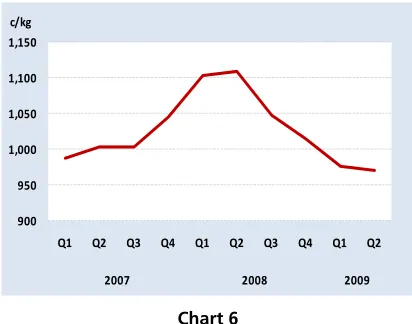
Shrimp
In Q2/2009 the shrimp exports was USD154
million or recorded a negative growth by 35.6% (y.o.y)
compared to minus 16.8% in Q1/2009. The decline of
shrimp exports was in line with the decreasing volume
of 73.6%. In addition, the ongoing slumping down of
shrimp price in the world market also contributed to the
decline of export value. In Q2/2009 shrimp price was
USD970 cent/kg, lower than USD1,112 cent/kg in
Q2/2008 and was also inferior to USD976 cent/kg in
11 900
950 1,000 1,050 1,100 1,150
Q1 Q2 Q3 Q4 Q1 Q2 Q3 Q4 Q1 Q2
2007 2008 2009
c/kg
Chart 6 World Shrimp Price
The major destinations of shrimp exports were
Japan (share 41.1%), the US (36.6%), and the
European Union (14%).
Table 7
Value of Shrimp Exports
to Several Major Countries of Destination
Period
Destination Country Value (Million USD) Share (%) Value (Million USD) Share (%)
Japan 81 33.9 64 41.6
United Staes of America 100 41.8 57 37.0
European Union 35 14.6 22 14.3
Others 23 9.6 11 7.1
Total 239 100 154 100
Q2-2008 Q2-2009
Copper
In Q2/2009 copper exports stood at USD1.4 billion
or grew by 3.8% (y.o.y), lower than 14.1% in Q1/2009.
The slowing down of copper export growth was caused
by, albeit starting to increase, lower price compared to
the previous year price. The copper price was
USD4,663/MTon in Q2/2009 contracted by 44.8% from
the previous year price (USD8,443/MTon).
3,000 4,000 5,000 6,000 7,000 8,000 9,000
Q1 Q2 Q3 Q4 Q1 Q2 Q3 Q4 Q1 Q2
2007 2008 2009
USD/MTon
Chart 7 World Copper Price
From demand side, copper exports were still
promising and marked with the increase in its export
volume by 48.1%. The demands mainly came from
Japan (30.9%), South Korea (15.1%), and India
(13.2%).
Table 8 Copper Export Value
to Several to Major Countries of Destination
Period
Destination Country Value (Million USD) Share (%) Value (Million USD) Share (%)
Japan 380 27.0 572 42.2
South Korea 193 13.7 230 17.0
India 2 0.1 202 14.9
Malaysia 153 10.9 122 9.0
Others 679 48.3 228 16.8
Total 1,407 100 1,354 100
Q2-2008 Q2-2009
Nickel
In Q2/2009 nickel exports was USD149 million or
contracted by 68.5% (y.o.y), better than minus 73.4%
in Q1/2009. This improvement was mainly supported
by the price rise to USD12,920/MTon, higher than
USD10.471/MTon in the preceding quarter. However, it
was still inferior to the price in Q2/2008
12 0 10,000 20,000 30,000 40,000 50,000 60,000
Q1 Q2 Q3 Q4 Q1 Q2 Q3 Q4 Q1 Q2
2007 2008 2009
USD/MTon
Chart 8 World Nickel Price
A discourse has currently been developed in nickel
market pertaining to the European Union resolution to
classify nickel as one of dangerous substances. By
putting pressures to the market of nickel, it seems that
this issue was brought up with the objective of
protecting the environment, people and products
manufactured by the countries in the region. Since
2008, a certification is required for nickel exports to the
European Union countries. Presently this discourse has
been submitted for the validation of the WTO. It is
petrified that this validation will affect the prospect of
Indonesia nickel exports considering that the European
Union is the potential market for nickel commodity
despite its still insignificant share. Other destination
countries for nickel exports were Japan (33.1%), China
(13.9%), and South Korea (10.9%).
Table 9
Nickel Export Value to Several Major Countries of Destination
Period
Destination Country Value (Million USD) Share (%) Value (Million USD) Share (%)
Japan 246 52.0 67 45.0
China 98 20.7 28 18.8
South Korea 33 7.0 22 14.8
Others 96 20.3 32 21.5
Total 473 100 149 100
Q2-2008 Q2-2009
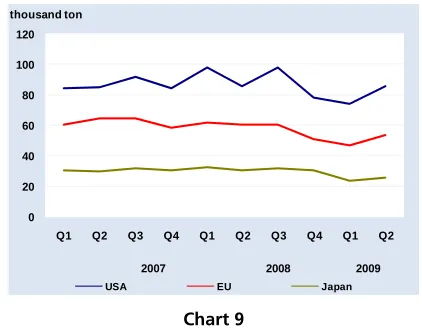
Textile and Textile Products
In Q2/2009 the export value of Textile and Textile
Product (TTP) was USD2.4 billion or negatively grew by
11.6% (y.o.y), improving compared to negative 13.9%
in Q1/2009. Despite the sharp drop in terms of value,
the volume only contracted by 1%. It was a result of
the switch of the demand for TTP of the US, the
European Union, and Japan from China to Indonesia.
0 20 40 60 80 100 120
Q1 Q2 Q3 Q4 Q1 Q2 Q3 Q4 Q1 Q2
2007 2008 2009
thousand ton
USA EU Japan
Chart 9
Volume of Textile and Textile Product (TTP) Exports to Several Major Countries of Destination
In order to increase export value, TTP industries
started to direct their export destinations toward the
high potential market of ASEAN countries. ASEAN
market currently absorbs 7% of Indonesian textile
products and therefore opportunities exist to be
developed. The major countries of destination for
Indonesian TTP were the US (35.8%), the European
Union (18%), and Japan (4.6%).
Table 10
TTP Export Value to Several Major Countries of Destination
Period
Destination Country Value (Million USD) Share (%) Value (Million USD) Share (%)
United States of America 971 36.4 845 35.8
European Union 479 17.9 425 18.0
Japan 132 4.9 109 4.6
Others 1,089 40.8 983 41.6
Total 2,671 100 2,362 100
Q2-2008 Q2-2009
With the objective of enhancing the performance
of Indonesian TTP industries, the government launched
a restructuring program of textile machinery. The
registration of this program started on April 1, 2009 up
to June 30, 2009. The mechanism of program
disbursement is classified into 2 (two) schemes. Scheme
I concerns the provision of discount facility in
purchasing machinery/equipment for TTP company
13
Scheme II is related to the low interest credit facility
through startup capital. According to the Director
General of Metal, Machinery, Textile and Multifarious
Industries, the Ministry of Industry allocated a budget of
Rp240 billion, divided into Rp213 billion for Scheme I
and Rp27 billion for Scheme II. In Scheme I, a 10%
discount will be provided for the total machinery price,
while assistance in Scheme II is related to financing loan
that will be provided under the condition that each
participating company makes an investment of
minimum Rp100 million and maximum Rp5 billion. The
source of financing will be as follows: 70% from the
Ministry of Industry, 10% from Lembaga Pengelola
Program (LPP), and 20% self financing, with 7%
interest during 5-years term. The number of companies
targeted to participate in this program is 200. If this
target is achieved it is expected that job opportunities
will be available for 22,000 people and the TTP
industries will be more efficient especially in energy
consumption.
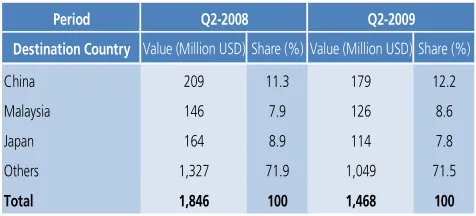
Chemical Products
In Q2/2009 export of chemical products was
USD1.5 billion or contracted by 20.5% (y.o.y), better
than minus 27.3% growth in Q1/2009. These falling
exports were in line with the sharp decrease of volume
by 40.6%. The reduced demand for chemical products
was mainly stemmed from China, Malaysia, and Japan.
Table 11
Export Value of Chemical Products to Several Major Countries of Destination
Period
Destination Country Value (Million USD) Share (%) Value (Million USD) Share (%)
China 209 11.3 179 12.2
Malaysia 146 7.9 126 8.6
Japan 164 8.9 114 7.8
Others 1,327 71.9 1,049 71.5
Total 1,846 100 1,468 100
Q2-2008 Q2-2009
Crude Palm Oil (CPO)
In Q2/2009 exports of CPO stood at USD2.1 billion
or contracted by 36.5% (y.o.y), better than minus
50.9% growth in Q1/2009. These falling exports were
due to the remain low price of CPO, while the volume
increased by 14.4%.
CPO price was USD744/MTon in Q2/2009, higher
than USD577/MTon in Q1/2009 but still lower than the
previous year (USD1,198/MTon). The strengthening
CPO price was mainly supported by the increased
demand from China and India as well as the increased
crude oil price in international market.
0 200 400 600 800 1,000 1,200 1,400
Q1 Q2 Q3 Q4 Q1 Q2 Q3 Q4 Q1 Q2
2007 2008 2009
USD/MTon
Chart 10 World CPO Price
In response to the strengthening of CPO price
during this period, the government set up an Export
Standard Price (HPE) of USD700/MTon with an export
duty of 3% starting from June 1, 2009. This export
duty will be valid for one month and subject to
reevaluation in the following month.
Export volume rose by 14.4%. Despite the
decreased exports to Pakistan and the European Union,
this situation was compensated by the considerable
demand from China and India. Drop of exports to
Pakistan were due to the import duty which was
applied higher for Indonesian CPO (10%) than CPO
from Malaysia (5%). In solving this problem, the
government tried to negotiate on a Preferential Trade
Agreement (PTA) with Pakistan with the objective of
enhancing CPO export volume to that country.
Table 12
14
to Several Major Countries of Destination
Period
Destination Country Value (Million USD) Share (%) Value (Million USD) Share (%)
India 1,081 32.7 769 36.6
China 393 11.9 361 17.2
European Union 478 14.5 246 11.7
Others 1,354 41.0 723 34.4
Total 3,306 100 2,099 100
Q2-2008 Q2-2009
1.2.
Non-Oil and Gas Imports
In Q2/2009 imports of non-oil and gas rose to
USD16.5 billion or higher than USD15.2 billion in
Q1/2009. Nevertheless, non-oil and gas imports during
this period posted a sharper negative annual growth of
30.6% compared to minus 28.8% in Q1/2009.
Imports of raw material posted the steepest
negative annual growth followed by imports of
consumption goods and capital goods. The decrease of
non-oil and gas imports was mostly caused by the
contracted volume as a consequence of the weakening
real domestic demand in Q2/2009.
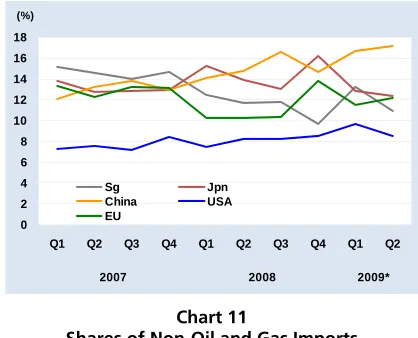
In Q2/2009 imports of non-oil and gas were mainly
originated from China (16.9%), Singapore (12.5%),
Japan (11.8%), the European Union (8.6%), and the US
(8.4%). Major imported commodities were
telecommunication equipment from China, electronics
equipment from Singapore, road vehicles from Japan,
and other means of transportation from the European
Union and the United States.
0 2 4 6 8 10 12 14 16 18
Q1 Q2 Q3 Q4 Q1 Q2 Q3 Q4 Q1 Q2
2007 2008 2009*
Sg Jpn
China USA
EU (%)
Chart 11
Shares of Non-Oil and Gas Imports Based on Major Countries of Origin
The imports of raw material were USD11.7 billion
in Q2/2009 or drop by 36.7% from the previous year
(Q1/2009: -36.9%). This negative growth signaled the
still weak demand for imports of raw materials for
exports and domestic consumption that put pressure to
import value in this period.
Table 13
Major Non-Oil and Gas Commodities Imported from Major Countries of Origin (based on 2digit SITC code, as a% shares of total non-oil and gas imports)
Commodity Share Commodity Share Commodity Share Commodity Share Commodity Share
Telecommunication Device 2.4 Electronic Machines 1.8 Vehicles 2.1 Other Transportation Vehicles 1.7 Other Transportation Vehicles 1.9
Electronic Machines 1.5 Other Transportation Vehicles 1.2 Iron and Steel 1.3 Public Industrial Machines 1.0 Nuts & Oil Seeds 0.8
yarn, fabrics, and textile produc 1.2 Paper 1.1 Public Industrial Machines 1.2 Certain Industrial Machines 0.7 Public Industrial Machines 0.6
Energy Generating Machine 1.2 Public Industrial Machines 1.0 Certain Industrial Machines 1.0 Electronic Machines 0.5 Textile Fibers 0.5
15
Imports of raw materials were generally from
China (13.7%), Singapore (13.2%), and Japan (12.6%).
Table 14
Import Value of Raw Materials Based on Country of Origin (C&F)
Period
Destination Country Value (Million USD) Share (%) Value (Million USD) Share (%)
China 2,353 12.7 1,612 13.7
Singapore 2,261 12.2 1,550 13.2
Japan 2,567 13.8 1,479 12.6
Others 11,376 61.3 7,104 60.5
Total 18,557 100 11,745 100
Q2-2008 Q2-2009
In Q2/2009 imports of consumption goods was
USD1.6 billion (C&F) or grew negatively by 31.3%
(y.o.y) compared to minus 39.8% in Q1/2009. The
decline in imports of consumption goods was in line
with the weak domestic demand. Imports of
consumption goods were mainly from China (31.6%),
Thailand (12.9%), and India (6.5%).
Table 15
Import Value of Consumption Goods Based on Countries of Origin (C&F)
Period
Destination Country Value (Million USD) Share (%) Value (Million USD) Share (%)
China 629 38.7 645 39.7
Thailand 480 29.5 263 16.2
India 75 4.6 132 8.1
Others 441 27.1 585 36.0
Total 1,625 100 1,625 100
Q2-2008 Q2-2009
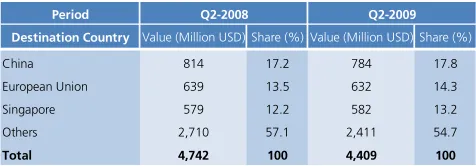
Meanwhile imports of capital goods were USD4.4
billion in Q2/2009 or contracted by 7% compared to
6.6% in Q1/2009. Despite this negative growth, the
decrease was slower than the contraction of other
group of products. This situation was contributed by
the high imports of air transportation and automotive
equipment. Imports of capital goods were mainly from
China (18.8%), the European Union (15.2%), and
Singapore (14%).
Table 16
Import Value of Capital Goods Based on Country of Origin (C&F)
Period
Destination Country Value (Million USD) Share (%) Value (Million USD) Share (%)
China 814 17.2 784 17.8
European Union 639 13.5 632 14.3
Singapore 579 12.2 582 13.2
Others 2,710 57.1 2,411 54.7
Total 4,742 100 4,409 100
Q2-2008 Q2-2009
Almost all of the 15 biggest non-oil and gas import
products recorded negative growth except airplane and
its equipment. Several products recorded negative
import growth rate higher than Q1/2009 such as
telecommunication equipment, processed steel
products, construction/civil engineering equipment, and
electrical equipment.
Table 17
16
2. Oil and Gas Trade Balance
In Q2/2009 the oil and gas trade balance recorded
a surplus of USD2.1 billion, higher than a USD1.6 billion
surplus in Q1/2009. Both oil trade balance and gas
trade balance improved. After experiencing deficit for a
long time, oil trade balance posted a surplus of USD69
million.
The surplus on gas trade balance was higher due
to the trend of increasing gas price pursuant to the
world oil price movement. The positive price effect was
much stronger than the negative volume effect in which
demand for gas weakened in response to the world
economic slowdown.
2.1. Oil
The increasing oil prices started to bring an
advantageous effect to the oil trade balance in
Q2/2009. In the reporting period the oil trade balance
recorded a USD69 million surplus compared to USD155
million deficit in Q1/2009. The surplus was mainly
resulted from the increase in crude oil exports.
Table 18 Oil Exports and Imports
Export 41.2 1,817 41.5 2,405
Crude Oil 31.5 1,328 42.2 31.6 1,775 56.2
Refinery Products 9.8 490 50.1 9.9 630 63.9
Import 39.6 1,973 40.1 2,337
Crude Oil 18.7 744 39.8 17.3 857 49.4
Refinery Products 20.9 1,228 58.7 22.8 1,480 65.0
Oil Trade Balance ‐155 69
Source: BPMigas and PT Pertamina (processed) Volume (mbbl)
Value (million USD)
Price (USD/barrel) Details 2009 Q1 Q2 Volume (mbbl) Value (million USD)
Price (USD/barrel)
Oil exports during the reporting period rose to
USD2.4 billion or increased by 33.2% compared to the
preceding quarter (USD1.8 billion). As previously
stated, the higher oil exports were primarily affected by
oil price. This was reflected from the slight increase in
oil export volume but in terms of value recorded a
relatively considerable increase. Based on types of
export product, crude oil export volume increased from
31.5 million barrel in Q1/2009 to 31.6 million barrel in
Q2/2009. Exports of oil product increased from 9.8
million barrel in Q1/2009 to 9.9 million barrel in
Q2/2009.
Indonesian crude oil export destinations (with share
of 70% of total oil exports) were mainly Japan,
Australia, Singapore, and Korea. Among the existing
48 types of domestic crude oil, the largest export
volumes were SLC, Duri, Senipah and Belanak.
From import side, oil value in Q2/2009 was USD2.3
billion, also higher than the preceding quarter value of
USD2.0 billion. Similar to the export trend, this increase
was also contributed by the rise in oil prices. In average
oil import1
price increased from USD49.2/barrel to
USD65.3/barrel and oil import volume showed a slight
increase from 39.6 million barrel to 40.1 million barrel.
Imports of crude oil for refinery intake were mainly
originated from Saudi Arabia with ALC (Arab Light
Crude) oil type and followed by crude oil from Brunei,
Africa and Malaysia. These types of oil were used for
the need of Cilacap refinery as well as refineries in
Balikpapan and Balongan.
Table 19
Demand and Supply of World Oil
Q1 Q2 Q3 Q4 Q1 Q2
Oil Demand
North America 25.5 24.8 24.5 23.7 24.1 23.5 22.9
China 7.6 8.0 8.2 8.1 7.7 7.6 8.3
West Europe 15.3 15.2 14.9 15.4 15.3 14.9 14.4
Others 37.5 38.7 37.8 37.8 38.1 37.9 37.4
Total Oil Demand 85.9 86.7 85.4 85.0 85.2 83.9 83.0
Oil Supply
OPEC 30.1 31.2 31.2 31.5 30.3 28.3 28.4
Non OPEC 54.5 55.0 55.0 54.2 54.9 55.6 55.0
Total Oil Supply 84.6 86.3 86.3 85.7 85.2 83.9 83.4
Netto Demand ‐ Supply ‐1.2 ‐0.4 0.9 0.8 0.0 0.0 0.4
Source: OPEC
Details (in mbpd) 2007
2008 2009
With reference to the oil price, the rise in
Indonesian crude oil export price was closely linked to
the average development of OPEC and WTI basket
crude oil prices in which both reaching USD42.9 per
barrel, higher than the preceding quarter. Several
international institutions projected that the improved
world economic condition in 2010 and the decreased
production of world oil supported the hike in oil prices.
17 30 40 50 60 70 80 90 100 110 120 130 140
J J A S O N D J F M A M J J A S O N D J F M A M J
2007 2008 2009
USD/barel
SLC Export Price WTI OPEC
Source: OPEC, Ditjen Migas
Chart 12 World Oil Prices
The average of Indonesian oil production reached
0.941 million barrel per day, lower than the average
production of the preceding quarter (0.962 million
barrel per day). The average production was below the
target stated in the 2009 government budget or
APBN-P 2009 (0.960 million barrel per day).
Oil consumption during Q2/2009 increased (84.9
million barrels) compared to Q1/2009 (80.7 million
barrels). Pertaining to user sectors, the rise in oil
consumption were registered in industrial, electrical,
and transportation sectors while the use in household
sector showed a decrease. The oil consumption did not
increase sharply due to the ongoing conversion
program to replace fuels with LPG and coal and the
slowing domestic economy.
7.2 7.4 7.6 7.8 8.0 8.2 8.4 8.6 0.0 0.5 1.0 1.5 2.0 2.5 3.0 3.5
Q1 Q2 Q3 Q4 Q1 Q2 2008 2009 Household
Industry Electricity Transportation (RHS)
billion litre billion litre
Sumber: Pertamina
Chart 13 Oil Consumption
2.2. Gas
A surplus on gas trade balance increased to
USD2.0 billion from USD1.9 billion in Q1/2009. The
higher surplus was driven by the growing trend of gas
price as reflected by the gas export price at the end of
June 2009 that had already increased by 32.3%2
compared to the price in March 2009.
Table 20
Exports of LNG, LPG and Natural Gas
Q1 Q2 Q3 Q4 Q1 Q2
LNG
Volume (mmbtu) 1,080 284 253 259 272 257 228 Value (million USD) 9,723 3,275 3,462 3,699 2,350 1,417 1,483 Price (USD/mmbtu) 9 12 13 14 9 5 6
LPG
Volume (000 metric ton) 337 66 35 0 0 0 0 Value (million USD) 210 51 28 0 0 0 0 Price (USD/MTon) 605 777 802 0 0 0 0
Natural Gas
Volume (mmbtu) 293 69 78 84 74 78 77 Value (million USD) 2,443 747 978 1,164 580 441 565 Price (USD/mmbtu) 8 11 12 14 8 6 7
Gas Trade Balance 12,407 4,073 4,501 4,945 3,000 1,926 2,048
Export (million USD) 12,376 4,073 4,468 4,863 2,929 1,858 2,048 Import (million USD) ‐31 0 ‐34 ‐82 ‐70 ‐67 0
Source: BPMigas
Details 2007 2008 2009
The impact of global crisis on the demand for gas
from the major destination countries (Japan, Korea, and
Taiwan) decreased LNG export volume from 256.8
mbtu to 228.1 mbtu.
Gas exports still maintained its high potential due
to Indonesia’s current gas reserves of 170.1 TSCF
(trillion standard cubic feet) which consist of 112.5 TSCF
of proven reserves and 57.7 TSCF of potential reserves.
Gas reserves in 2008 was higher compared to 2007.
18
Table 21
Indonesia’s Gas Reserves (billion cubic feet) Year
Reserves
Proven 91 91 97 94 106 113 Potential 87 98 89 93 59 58 Total 178 188 186 187 165 170
2007 2008
2003 2004 2005 2006
3. Services Account
The deficit on services account in Q2/2009 reached
USD3.2 billion, higher than the deficit in the preceding
quarter (deficit of USD2.5 billion). The increased deficit
was mainly triggered by the increase in import freights
and was consistent with the increase in imports
compared to the previous quarter. In addition, several
other services imports still showed an increase
compared to Q1/2009 such as construction services and
computer and information services. Meanwhile, net
travel services still managed to maintain the same level
of surplus as the preceding quarter.
-3500 -3000 -2500 -2000 -1500 -1000 -500 0 500 1000
Q.1 Q.2 Q.3 Q.4 Q.1 Q.2 Q.3 Q.4 Q.1 Q.2
2007 2008* 2009**
Transportation Travel Other services Services, net
million USD
Chart 14 Services Account
Transportation services recorded a higher deficit of
USD1.9 billion than that in Q1/2009 (USD1.7 billion).
This increased deficit was originated from freight
services rising from USD1.5 billion to USD1.7 billion in
line with the hike in import volume. The high deficit on
transportation services was related to the domination of
foreign fleet in transportation of import products. The
empowerment of national shipping industry in
supporting international trade through the obligation to
use domestic fleet in shipping national commodities
was still difficult to be implemented.
Tourism sector (travel services) remained at the
same rate as in Q1/2009 by posting a surplus of USD0.3
billion in Q2/2009. The surplus was contributed by the
foreign exchange receipts from international travelers
climbing from USD1.4 billion to USD1.6 billion. This
increased surplus, however, was offset by foreign
exchange expenses by Indonesian travelers abroad
mounting from USD1.1 billion to USD1.3 billion.
The number of international travelers visiting
Indonesia (inbound) reached 1,590 thousand people
increased from 1,464 thousand people in Q1/2009. This
increase reflected that Indonesia was still an interesting
travel destination amidst the slowing global economic
growth. Several international tourism agenda also
supported the growth of international travelers such as
the World Ocean Congress (WOC), the Coral Triangle
Initiatives, and the 42nd
Annual General Meeting of
Asian Development Bank (ADB) in Bali, that all took
place in May 2009.
In Q2/2009 the countries of origin of international
travelers were still dominated by Singapore (18%),
Malaysia (16%), Australia (10%), Japan (7%), and
China (6%). Three out of these five countries namely
Malaysia, Australia, and China showed a positive
growth during the reporting period. Travelers from
Saudi Arabia and France grew significantly by 40%
(y.o.y) albeit their shares were still relatively small.
The main destinations of travelers visiting
Indonesia were Bali with 44% share, followed by
Jakarta (26%), and Batam (18%). The countries having
the largest number of travelers visiting Bali were
Australia (17%), Japan (13%), China (8%), and France
19 -600 -400 -200 0 200 400 600 800 -600 -500 -400 -300 -200 -100 0 100 200 300 400 500 600 700
J F M A M J J A S O N D J F M A M J J A S O N D J F M A M J
2007 2008 2009
million USD
Inbound (thousand people) Outbound (thousand people)
Trav. Balance (thousand people) Inflows (million USD) RHS
Trav. Balance (million USD) RHS Outflows (million USD) RHS thousand people
Chart 15 Travel Services
The number of Indonesians going abroad also
grew to 1,289 thousand people or higher 13% than
the preceding quarter (1,142 thousand people). This
rise was followed by an increase in foreign exchange
travel expenses to USD1.2 billion, from USD1.1 billion in
the previous quarter.
Neighbouring ASEAN countries still remained the
main destination of Indonesian travelers such as
Singapore (44%), Malaysia (25%), and Thailand (4%).
While Australia (6%) and the US (4%) were the main
destination of Indonesian travelers outside ASEAN
countries. The annual growth of Indonesian travelers
visiting Singapore contracted in May 2009 while those
visiting Malaysia increased.
According to the information from Malaysia
Tourism Promotion Board (MTPB), the number of
Indonesian tourists visiting Malaysia slightly increased by
3.1% (y.o.y) reaching 195 thousand from a total of
1.89 million. Singapore Tourism Board reported that the
number of Indonesian tourists decreased by 5.9%
(y.o.y) reaching 129 thousand from a total of 725
thousand.
4. Income Account
In Q2/2009 the income account recorded a USD3.7
billion deficit, higher than USD2.7 billion deficit in
Q1/2009. Deficit on income account reflected a higher
resident’s liabilities to non-resident than resident’s
claims on non-resident. The higher deficit was
contributed by the increased deficits on other
investment income, portfolio investment income as well
as direct investment income.
-6,000 -5,000 -4,000 -3,000 -2,000 -1,000 0
Q.1 Q.2 Q.3 Q.4 Q.1 Q.2 Q.3 Q.4 Q.1 Q.2
2007 2008* 2009**
Income, net Inv. Income DI Income PI Income OI Income
million USD
Chart 16 Income Account
Other investment income posted a deficit of
USD0.9 billion, higher than USD0.4 billion in the
preceding quarter. This deficit was triggered by a
scheduled increase in interest payments of government
external debt.
The deficit on net portfolio investment income rose
to USD0.7 billion from USD0.4 billion deficit in
Q1/2009. This increased deficit was as a result of a rise
in dividend payments on securities owned by foreign
investors to USD0.4 billion from USD0.1 billion. The
increased payments of dividend were consistent with
the growth of foreign ownership of domestic shares in
the previous periods.
The deficit on direct investment income also
widened to USD2.1 billion from USD1.7 billion in
Q1/2009. This higher deficit was due to the increased
profit transfers reported by oil and gas companies
(Contractor of Production Sharing Contract) from
USD0.6 billion to USD0.8 billion.
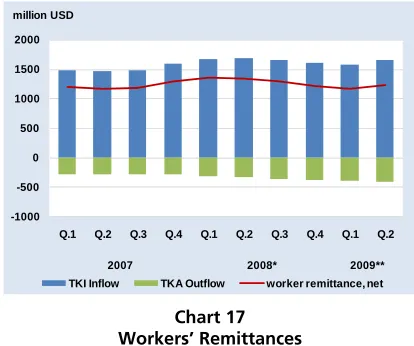
5. Current Transfers
The current transfers in Q2/2009 posted a USD1.2
billion surplus, slightly higher than USD1.1 billion in
20
contributed by remittances from Indonesian workers
abroad amounting to USD1.8 billion, slightly increased
from USD1.7 billion in the preceding period. Outflows
of remittances by foreigners working in Indonesia
reached USD423 million in Q2/2009, higher than
USD404 million in Q1/2009.
-1000 -500 0 500 1000 1500 2000
Q.1 Q.2 Q.3 Q.4 Q.1 Q.2 Q.3 Q.4 Q.1 Q.2
2007 2008* 2009**
TKI Inflow TKA Outflow worker remittance, net million USD
Chart 17 Workers’ Remittances
The placement of Indonesian workers abroad
reached 158.2 thousand people in Q2/2009, 1.5%
lower than the placement in Q1/2009. This was as a
result of a fall in demand for Indonesian workers
especially from countries in Asia-Pacific region such as
Malaysia, Singapore, and Taiwan. On the contrary, the
placement of Indonesian workers in the Middle East
region especially in Saudi Arabia and Bahrain increased.
The number of Indonesian workers abroad at the
end of Q2/2009 were 4.39 million, lower than 4.42
million at the end of Q1/2009. This decrease was driven
by the falls in total placements of both formal and
informal workers. Placement of formal Indonesian
workers posted a steep drop compared to informal
workers. This was considered as a result of global
financial crisis negatively affecting the economy of the
placement destination especially in the Asia-Pacific
region.
The other component contributing to the surplus of
current transfers was the inflows of non-investment
grants in the form of aids of non-durable goods such as
food, clothes and medicines. Inflows of grants reached
USD32 million, lower than USD73 million in Q1/2009.
The grants received by the Government amounting to
USD15 million, higher than USD4 million in the
preceding quarter. The grants received by NGO was
USD17 million, lower than USD69 million in the
previous quarter.
In Q2/2009 several activities financed by foreign
grants were, among others, technical assistance from
Norway with an agreement signed at the end of April
2009 for the implementation of capacity building in
Fisheries and Aquaculture. Technical assistance from
ADB related to the bureaucracy reformation of central
and regional government was agreed in April 2009.
Table 22 Non-Investment Grant
(million USD)
Investment Grants
(Capital Transfer)
Total 17 61 186 29 19 29
Public (Govt.) 4 6 7 3 2 3
Private (NGO) 13 55 179 26 17 26
Source: Indonesian Ministry of Finance, United Nations
2008* 2009**
21
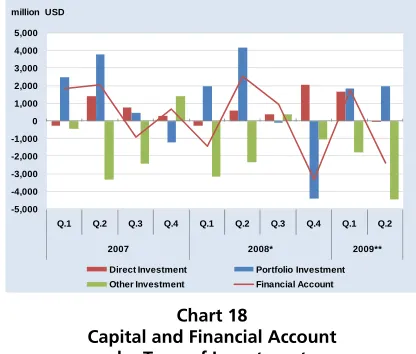
The capital and financial account posted a USD2.4
billion deficit in Q2/2009 after recording a USD1.8
billion surplus in Q1/2009. This deficit was stemmed
from decreased inflows of direct investment, increased
domestic bank and bank placements in
non-resident banks abroad, and the increase in external debt
repayments by the government. The falls in direct
investment inflows were consistent with the slowing
growth of domestic economy.
Within the capital and financial account, the
portfolio investment still recorded a robust surplus
compared to the previous quarter. The renewed
investor confidence in Indonesian economic stability and
the calm, orderly national elections were several factors
contributing to the improved performance of portfolio
investment.
-5,000 -4,000 -3,000 -2,000 -1,000 0 1,000 2,000 3,000 4,000 5,000
Q.1 Q.2 Q.3 Q.4 Q.1 Q.2 Q.3 Q.4 Q.1 Q.2
2007 2008* 2009**
Direct Investment Portfolio Investment
Other Investment Financial Account
million USD
Chart 18
Capital and Financial Account by Type of Investment
1.
Capital Account
The capital account in Q2/2009 recorded a USD29
million surplus, higher than a surplus of USD19 million
in the previous quarter. This surplus was contributed by
the investment grants, such as those for construction of
housing, bridges, roads, schools, and others. The entire
grants were provided in the framework of aids for
natural disaster’s victims in several locations of
Indonesia. Most of the grants (90%) were distributed
through private sector (NGO) amounting to USD26
million, while the rest were through public sector
(government) amounting to USD3 million.
The investment grants were represented among
others by the aid from Global Partnership on
Output-Based Aid (GPOBA) through the World Bank for the
development of internet access for the people living in
isolated areas in Java and Sumatera which was signed in
April 2009 between GPOBA and Indonesian
government (Ministry of Communication and
Information).
Table 23 Investment Grant
(million USD) Investment Grants
(Capital Transfer)
Total 17 61 186 29 19 29
Public (Govt.) 4 6 7 3 2 3
Private (NGO) 13 55 179 26 17 26
Source: Indonesian Ministry of Finance, United Nations
2008* 2009**
Q1 Q2 Q3 Q4 Q1 Q2
2.
Financial Account
The financial account in Q2/2009 posted a deficit
of USD2.4 billion compared to a surplus of USD1.7
billion in Q1/2009. This was due to the deficits on other
investment and direct investment while portfolio
investment still posted a surplus.
The financial account deficit was primarily due to a
low direct investment inflows and increased domestic
bank and non-bank placements in non-resident banks
abroad as well as a scheduled rise in the government’s
foreign debt repayments. The slowing down of
22
domestic economic growth resulted on the low demand
for foreign financing.
The surplus on portfolio investment account in
Q2/2009 was contributed by the issuance of
Government Sharia Securities (SBSN) or Government
Sukuk in foreign currency. Moreover, there were
renewed foreign investor interest in
denominated securities, especially the
rupiah-denominated Government Bonds, Bank Indonesia
Certificates (SBIs), and domestic shares.
-4,000 -3,000 -2,000 -1,000 0 1,000 2,000 3,000 4,000
Q.1 Q.2 Q.3 Q.4 Q.1 Q.2 Q.3 Q.4 Q.1 Q.2
2007 2008* 2009**
Public sector Private sector Capital & financial account
million USD
Chart 19
Capital and Financial Account by Sector
2.1 Public Sector
Public sector’s financial account recorded a USD0.3
billion deficit during Q2/2009, in contrast with a
USD2.8 billion surplus in the preceding quarter. The
deficit was as a result of public other investment deficit
that was exceeded the surplus of public portfolio
investment.
Although posted a lower surplus than the
preceding period (USD2.8 billion), portfolio investment
of public sector during the reporting period still
managed to record a surplus of USD1.8 billion. This
surplus was resulted from the increase in foreign
investment inflows through the purchase of
rupiah-denominated government bonds (SUN) and Certificate
of Bank Indonesia (SBI) as well as the issuance of
government Sukuk in foreign currency.
The ongoing inflows of portfolio investment in
Q2/2009 were consistent with the increase in credit
rating outlook by Moody’s from stable to positive.
Moody’s underlined several contributing factors to this
situation such as the strong prospect of economic
growth, effective policy framework that mitigated the
impact of economic turbulence and sustained economic
resilience, internal political stability, improved credit
fundamental as reflected in the falling external debt
figures, positive trade balance, external financing
sustainability as well as banking liquidity adequacy and
adequate capital support.
The purchases of public sector
rupiah-denominated securities (SBI and SUN) by foreign
investors recorded net surplus during the reporting
period. Foreign investment transactions on SBI posted a
net surplus of USD420 million, lower than the net
surplus of the preceding period (USD700 million). SUN
transactions by foreign investors also recorded a net
surplus of USD743 million, in contrast with the net
deficit occurred in the preceding period (USD 809
million). -4000 -3000 -2000 -1000 0 1000 2000 3000 4000 5000
Q.1 Q.2 Q.3 Q.4 Q.1 Q.2 Q.3 Q.4 Q.1 Q.2
2007 2008* 2009**
Portfolio Investment Other Investment Financial Account
million USD
Chart 20
Financial Account of Public Sector
The strengthened portfolio investment transactions
by foreign investors were inseparable from the
improving condition of global financial sector. Liquidity
squeeze continued to ease supported by liquidity
injection following the quantitative easing policy
23
performed by the central banks such as the Fed, the
BOE, the BOJ, and the ECB was successful to ease credit
market squeeze as reflected by a decline of the spread
between Libor and Overnight Index Swap (OIS) to the
level before Lehman Brother’s bankruptcy. The financial
sector improvement was also shown by the Fed’s stress
test result concluding that the US banking relatively <