Effect of Stove Types on In-kitchen Air Quality: Case Study at
Way Isem Village, Lampung Province, Indonesia
U. Hasanudin
1,*, A. Haryanto
2, J. Romero
31Department of Agro-industrial Technology, Faculty of Agriculture, University of Lampung. Jl. Sumantri Brojonegoro No. 1, Bandar Lampung, Indonesia, 35145. Email: [email protected]
2Department of Agricultural Engineering, Faculty of Agriculture, University of Lampung. Jl. Sumantri Brojonegoro No. 1, Bandar Lampung, Indonesia, 35145. Email: [email protected]
3Institute for Global Environmental Strategies, 2108-11 Kamiyamaguchi, Hayama, Kanagawa 240-0115, Japan. Email: [email protected] *Corresponding author: [email protected] Tel: + 62-721-781823, Fax: + 62-721-700682
Abstract: The objective of this research was to investigate in-kitchen air quality as related to stove utilization during cooking. The experiment was conducted at Way Isem, a village located in the North of Lampung Province, Indonesia. Nine homes using four different fuels or stoves participated in this experiment with a total of fifteen samples - five wood stoves, five kerosene stoves, four liquefied petroleum gas (LPG) stoves and one biogas stove. In-kitchen air quality was measured using five parameters, namely SO2,
NO2, dust, PM10 and opacity. In-kitchen air was sampled using a High Volume Air Sampler apparatus equipped with a vacuum
pump. The air was then absorbed using a RAC 5 gas sampler for further analysis. Results showed that SO2 content in the kitchen air
for an hour of measurement ranged from 340 to 357 μg/Nm3, lower than the Indonesia standard of 900 μg/Nm3. NO2 content, ranged
from 12 to 19 μg/Nm3, was also distinctly lower than the national standard of 400 μg/Nm3. Wood stoves, however, resulted in high concentrations of dust and PM10, which were 390 μg/Nm3 and 400 μg/Nm3, respectively. These numbers were higher than the
national standards of 230 μg/Nm3 for dust and 150 μg/Nm3 for PM10.
Keywords: Biomass, black carbon, gas emission, indoor cooking, in-kitchen air, opacity, particulate matter, stove.
1. Introduction
Biomass is still a primary energy source for cooking in developing countries. Currently, it is estimated that around 50% of the world's population (90% or about 3 billion people in developing countries) rely on biomass fuels (wood, dung and crop residues), which are typically burnt especially for cooking, heating, and lighting [1-2]. The use of biomass energy is environmentally benign if it is managed appropriately. In addition, carbon dioxide (CO2) released during combustion of biomass, is finally utilized
for photosynthesis during plant growth. If biomass was completely combusted, the use of biomass for cooking could be carbon dioxide-neutral [3]. Most biomass, however, is burned incompletely and produces other by-products which contribute to climate change. In the rural areas, wood fuel is used through direct, open combustion in a simple stove that results in incomplete combustion. Incomplete combustion processes can emit organic pollutants and fine particles. In effect, biomass combustion is related to significant pollutant emissions and hence, needs to be improved. Nussbaumer [4] stated that pollutant formation occurs in two ways: (1) Incomplete combustion that leads to high emissions of unburnt pollutants such as CO, soot, and PAH, and (2) fuel constituents such as N, K, Cl, Ca, Na, Mg, P, and S that form pollutants such as NOx and particles.
Zhang and Smith (2003) noted that combustion of solid fuels in simple, poorly designed and maintained stoves contributed directly to low energy efficiency and, therefore, increased pressure on fuel resources [5]. Low combustion efficiency means that a large fraction of fuel carbon is converted to compounds other than carbon dioxide (CO2), i.e. products of incomplete combustion.
These products mainly comprise CO and fine (inhalable) particles, and volatile as well as semi volatile organic compounds.
In addition, people rarely erect a chimney to release flue gases resulting from biomass burning. This has resulted in dirty, unhealthy kitchens. Black carbon emitted during biomass burning accumulates and forms black soot on the walls and ceiling. Therefore, the use of biomass energy should be evaluated comprehensively.
The relation of indoor air pollution and ill health condition has been well documented. For example, Bruce et al. (2002) highlighted that indoor air pollution may be attributed to some diseases including acute respiratory infections, chronic pulmonary disease, asthma, lung cancer, pulmonary tuberculosis, low birth weight and infant mortality, and cataracs [6].
The aforementioned condition of wood fuel utilization applies to Indonesia. During the last ten years, biomass consumption in Indonesia was 272 million barrel oil equivalent [7] and most is used for cooking by rural and low income people. Most people burn wood fuel in open, simple woodstoves. Cooking is done in the kitchen without a chimney to release the flue gases. The by-products escape out of the building simply through windows, doors, porous walls and roofing. This condition caused black, dirty walls and ceiling in the kitchen.
There are some studies on the woodstove energy efficiency in Indonesia. Nurhayati et al. [8], for example, reported that thermal efficiency of woodstoves used in brown sugar industries was around 15-18.6%, whereas the efficiency of traditional household and small restaurant woodstoves varied between 1.6% and 23.9%. Recently, Haryanto and Triyono [9] reported that thermal efficiency of woodstoves was 9-16%. Information on the emissions related to household stoves, however, is scarce. Therefore, investigations of emission characteristics resulting from fuel combustion for cooking are required. The results are expected to contribute in helping the design of efficient, low emission wood stoves. The objective of this research was to investigate in-kitchen air quality as related to different stoves used during cooking at Way Isem, a village in Lampung Province, Indonesia.
2. Experimental
2.1 Description of study site
study were one-story houses with large backyards for gardening. So far, no electricity grid is installed at the village. Because of relatively easy access to gather fire wood, energy consumption for cooking is basically supplied by wood. The wood is gathered from the yard or farm with no costs incurred. The wood is burnt in a simple brick stove. For all households their kitchens were in the back section of the house. Generally, the kitchens are designed for a wood stove without a chimney to release the flue gas. By-products from fuel combustion were simply removed from the kitchen by natural ventilation through windows, doors, porous walls and roofs. This condition caused black, dirty walls and ceiling in the kitchen.
Some people with a better economic standing have kerosene stoves. Smith et al. [10] clearly stated that the transition of people away from reliance on wood as fuel toward commercial (often fossil) fuels occurred due to people's living standard improvement. Through a kerosene conversion program, 20 villagers recently (in 2010) also received an LPG stove from the government for free. The LPG and kerosene are purchased from a local supplier for IDR.8000 (US$89 cent) per liter for kerosene and IDR.15,500 (US$1.7) per bottle of 3-kg LPG. Sustaining the use of LPG stoves was expensive or deemed as an unnecessary expense compared to using free and abundant wood as fuel so most of the people continued using wood as a primary fuel. In fact most kerosene and LPG stoves were kept in a drawer due to the high price of kerosene and many accidents involving LPG stoves being reported in the media. Therefore, the people continued running their wood stoves as a primary stove.
In 2007, Way Isem village became a recipient of the Self Sufficient Energy Village (SSEV) pilot project. The project scheme is for the village to grow Jatropha curcas as a source of energy with assistance from a foundation. The jatropha plant was able to produce seeds within six months after planting (the seedling was planted in a plastic bag for one month). The seeds from the harvested ripe jatropha fruits were processed to produce biokerosene, i.e. crude jatropha oil (CJO). All the facilities, including seed, were provided from the sponsor. The CJO needs to be further processed so that it can be used to run a generator and produce electricity. The jatropha seed supply, however, was not sufficient due to low yields. Production was intermittent so the CJO was merely sold through the sponsor. In order to attract people into participating in the program, the sponsor also provided biogas digesters to generate biogas fuel from jatropha cake. In fact, 20 families have already received biogas digester through the SSEV program, but only one was in operation when the experiment took place. The people showed high enthusiasm for the biogas digester because it is a cleaner source of cooking fuel compared to wood and it is almost free compared to the LPG. However, with the low technology transfer and limited training capacity, the villagers did not have the skills to fix even small problems such as gas holder leaks. But the main problem was that the economic benefits from jatropha cultivation was not attractive when compared to planting other crops such as cassava so the supply of jatropha cake used in the biogas digester was not readily available [11].
2.2 Experimental settings
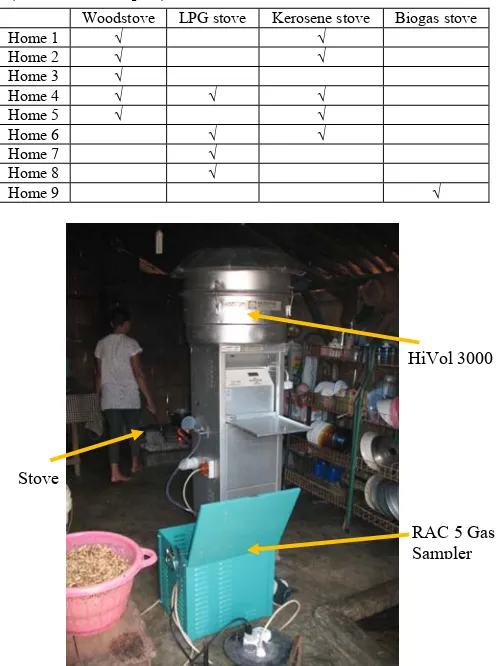
Nine houses using four different fuel/stove participated in this experiment making taking a total of fifteen samples, which included five cordwood stoves, five kerosene stoves, four LPG stoves and one biogas stove (see Table 1). As stated earlier, it was hard to find people using kerosene, LPG and biogas stoves. In cases that a home had more than one stove the emission measurement were made separately for each stove on a different day. This strategy was adopted to avoid the effect of previous conditions created by a different fuel. Data recorded included the kitchen condition, and stove and fuel types. Measurements of air quality were conducted in the kitchen at a point 2-3 meters from
the stove (Figure 1). A High Volume Air Sampler apparatus (HiVol 3000 ECOTECH) equipped with a vacuum pump was used to collect air samples for dust and PM10 determination for
an hour. Particulate matter in the air sample was trapped in a membrane-type filter before air enters the inlet manifold. Particulate analysis was performed based on the Indonesia National Standard (SNI) #19-7119.3-2005 released by the Bureau for National Standards (BSN, 2005a) [12].
A RAC 5 Gas Sampler (New Star Environmental) capable of testing five emission gases was used to measure NO2 and SO2
content at the same time. The RAC 5 Gas Sampler was equipped with bubbler tubes to absorb the air. The sample air passes through these tubes into 50 ml of reagent (absorbing solution) contained in each bubbler. The gas sampler arrangement is depicted schematically in Figure 2. The scrubbed air was analyzed based on the SNI standards #19-7119.2-2005 for NO2 and
#19-7119.7-2005 for SO2 [13-14].
Table 1. Sampling strategy for in-kitchen air quality measurement (fifteen total samples).
Woodstove LPG stove Kerosene stove Biogas stove
Home 1 √ √
Home 2 √ √
Home 3 √
Home 4 √ √ √
Home 5 √ √
Home 6 √ √
Home 7 √ Home 8 √
Home 9 √
HiVol 3000
Figure 1. Field measurement to evaluate in-kitchen air quality.
A. Fritted tube B. Absorbing solution C. Mist trap D. Flow meter E. Control valve F. Pump
Figure 2. Sketch for gas sampler arrangement.
RAC 5 Gas Sa
Stove
Fuel combustion produces smoke at different intensities due to different moisture content and different size, form and color of the particulates. The opacity was measured using the Ringelmann scale and was presented as a percentage of the standard background. The method was detailed in the SNI standard # 19-7117.11-2005 [15].
3. Results and Discussion
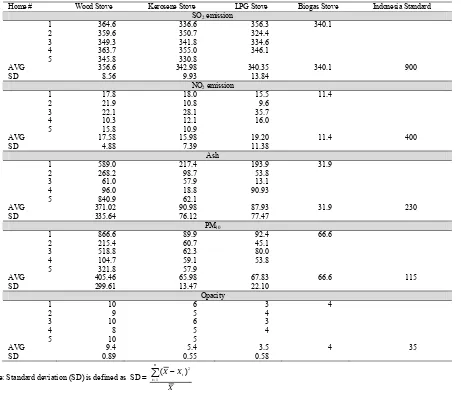
Table 2 shows the emission data resulted from the experiment.
3.1 SO2 emission
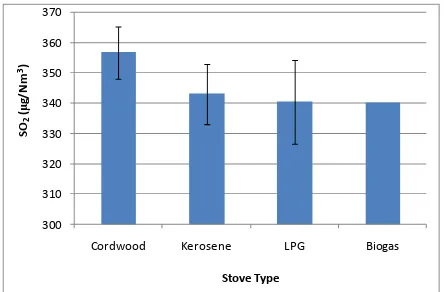
Figure 3 shows the SO2 content in-kitchen air in relation
to different types of stove. The SO2 concentration was in the range
of 340.1 μg/Nm3 (for biogas stove) to 356.6 μg/Nm3 (for wood stove). Standard ambient air quality for Indonesia, as found in the Government Regulation No. 41/1999 [16], requires that SO2
content for an hour must not exceed 900 μg/Nm3. Therefore, SO2
concentrations found during cooking activities was well below the required national standard for ambient air regardless of stove type. It can also be seen from Figure 3 that kerosene, LPG, and biogas stoves produced a relatively comparable amount of SO2 but cordwood
stoves, on the other hand, produced slightly higher SO2 levels.
The sulfur oxides (SOx) emissions from the stoves directly
related to the sulphur content of fuels used [17]. It is well known that the combustion of fossil fuels produce more SO2 than that
of biomass [18]. In fact, the combustion of fossil fuel has been
claimed to be the major anthropogenic source of SO2 emissions.
Our data, however, showed that biomass combustion produce higher SO2. This may be due to the low efficiency of the
woodstoves used in this experiment as reported recently by Haryanto and Triyono [9].
3.2 NO2 emission
The NO2 content in the kitchen air as related to different
types of stove is presented in Figure 4. It was observed that NO2
emissions from all stoves were basically comparable in the window of 11.4 μg/Nm3 for the biogas stove to 19.2 μg/Nm3 in
average for the LPG stove. Again, these quantities were much lower than the national standard of 400 μg/Nm3.
The NO2 formation may occur by two different
mechanisms: (1) formation of NO2 from the conversion of
chemically bound nitrogen in the fuel, and (2) formation of NO2
from the fixation of atmospheric nitrogen in the combustion process. Therefore, NO2 emission levels will depend on the
combustion temperature and the fuel composition as well. Dinca et al. [19] noted the correlation between the NO2 emissions and
the nitrogen content of the fuel. Nussbaumer (2003) confirmed that biomass furnaces exhibit relatively high emissions of NO2than
those of gas or kerosene stoves [4]. Our results, however, showed a different tendency. These implied that NO2 emissions in
this study mostly resulted from atmospheric nitrogen and therefore, NO2 emissions will not be different due to the different fuels used.
The small discrepancy may be due to the quality of combustion.
Table 2. Emission data resulted from the experiment.
Home # Wood Stove Kerosene Stove LPG Stove Biogas Stove Indonesia Standard SO2 emission
3.3 Particulate emission
Figures 5 and 6 respectively showed the concentration of dust and particulate matter with a diameter of 10 μm or less (PM10) in the kitchen air. Both figures demonstrated that particulate
emissions from biomass combustion was much higher than those of the other three stoves. Jiang and Bell [20] reported that indoor particle levels may be attributed to different fuel types and kitchen designs. Dust levels in kitchen air in relation to liquid and gas fuels varied from 31.9 μg/Nm3 with biogas stoves to 91
μg/Nm3 with kerosene stoves. Wood stoves, however, resulted in a dust content of 371 μg/Nm3 on average. A similar trend was observed for PM10 levels, which were in the range of 66 to 68
μg/Nm3 with kerosene, LPG, and biogas stoves; whilst woodstoves resulted in 405.5 μg/Nm3 on average. Dust and PM
10 levels
showed that particle emissions from wood stoves were above the national standard of 230 and 115 μg/Nm3 for dust and PM
10,
respectively. The type of stove used as well as the type of wood and its moisture content were likely be substantial variables. The other three stoves (kerosene, LPG, and biogas) produced dust and PM10 emissions lower than the national standards.
300
Figure 3. SO2 content in-kitchen air quality as related to different
types of stove.
Figure 4. NO2 content in the kitchen air as related to different
types of stove
Figure 5. Dust content in the kitchen air as related to different types of stove.
Our results indicated higher PM levels for households using biomass stoves compared with those using cleaner fuels. These findings imply that biomass burning for cooking contributes substantially to indoor particulate levels. The results concurred with previous work. Jiang and Bell reported that urban households using cleaner fuels (such as natural gas), had significantly lower indoor PM levels than did rural households using biomass [20]. In Tamil Nadu, India, cooks using biomass fuels also experienced higher indoor PM4 levels than cooks using clean fuels such as kerosene or gas did [21]. Smith et al. [22] concluded emissions of by-products from incomplete combustion decrease from unprocessed biomass to processed biomass (charcoal) to liquid fuels to gaseous fuels. Although our results are limited by the small sample size, these findings confirmed the growing body of evidence that biomass fuels can result in high indoor air pollution levels, which in turn can contribute to ill health such as respiratory infections, [23] and decreasing of lung function [24].
It can also be observed from Figure 5 and 6 that PM10
emissions were comparable with dust emissions for each type of stove. This implies that PM10 is the major component of dust
polluting the air in the kitchen. The reason for this phenomenon is that PM10 remains in the atmosphere for longer periods
because of its low settling velocity. Particulates greater than PM10, on the other hand, remain in the atmosphere for shorter
periods. The importance of PM10 is that it can penetrate deeply
into the respiratory tract and cause respiratory illnesses in humans. It is important, therefore, to develop improved wood-burning stoves in order to increase the efficiency and reduce particle emissions.
3.4 Smoke opacity
Figure 7 revealed the percentage of opacity in the kitchens studied. The opacity of kitchen air met the national standard of 35% maximum [25]. The figure clearly shows that wood stoves resulted in higher air opacity than the other three stoves did. The opacity is caused by smoke which is a sign of
0
Figure 6. PM10 content in the kitchen air as related to different
types of stove.
incomplete combustion. This means that woodstoves produced more smoke as compared to liquid or gas stoves. Smith et al. [26] pointed out that simple stoves using solid fuels do not merely convert fuel carbon into carbon dioxide. Such stoves actually convert a significant portion of the fuel carbon into products of incomplete combustion. In this case, local practices, the type of stove, as well as the wood species and moisture content, are important variables.
The significance of smoke particles is that they are composed of 50-60% organic carbon and 5-10% black carbon. Without a chimney or exhaust fan, smoke is the source of the black soot accumulated on the walls and ceiling of the kitchens. Smith et al. (2005) firmly stated that indoor smoke from solid fuel combustion is the second-leading environmental risk factor contributing to the total burden of disease in India, and the third-largest risk factor overall [27].
4. Conclusion
Our experiment concluded that opacity, NO2 and SO2
concentrations in kitchen air as related to the type of fuel or stoves used for cooking was far below the national standard, regardless fuel and stoves type. Biomass combustion results in elevated air pollution, especially particulate matter. The dust and PM10 concentrations during cooking time due to wood stove was 371 and 405 μg/Nm3, respectively. These numbers
were higher than the national standards of 230 and 115 μg/Nm3 for dust and PM10, respectively.
Further field studies are necessary to evaluate the use of improved stoves and to quantify the carbon savings from the use of specific stoves.
Acknowledgment
The authors greatly acknowledge the Institute for Global Environmental Strategies (IGES), Japan, for their financial support of this research. However, the views expressed in this document are solely those of the authors.
Reference
[1] McCracken JP, Smith KR, Díaz A, Mittleman MA, Schwartz J, Chimney Stove Intervention to Reduce Long-term Wood Smoke Exposure Lowers Blood Pressure among Guatemalan Women, Environmental Health Perspectives 115(2007) 996-1001.
[2] Naeher LP, Leaderer BP, Smith KR, Particulate Matter and Carbon Monoxide in Highland Guatemala: Indoor and Outdoor Levels from Traditional and Improved Wood Stoves and Gas Stoves, Indoor Air 10 (2000) 200-205. [3] MacCarty N, Ogle D, Still D, Bond T, Roden C, A
laboratory comparison of the global warming impact of five major types of biomass cooking stoves, Energy for Sustainable Development XII/2(2008) 5-14.
[4] Nussbaumer T, Combustion and Co-combustion of Biomass: Fundamentals, Technologies, and Primary Measures for Emission Reduction, Energy Fuels 17 (2003) 1510-1521. [5] Zhang JJ, Smith KR, Indoor air pollution: A global health
concern, British Medical Bulletin 68 (2003) 209-225. [6] Bruce N, Perez-Padilla R, Albalak R, The health effects of
indoor air pollution exposure in developing countries (2002) World Health Organization, 20 Avenue Appia, 1211 Geneva 27, Switzerland.
[7] MEMR (Ministry of Energy and Mineral Resources), Handbook of Energy and Economic Statistics of Indonesia (2007) Accsesed from: http://www.esdm.go.id (May 01, 2008).
[8] Nurhayati T, Waridi Y, Roliadi H, Progress in the technology of energy conversion from woody biomass in Indonesia, For. Stud. China 8(2006) 1-8.
[9] Haryanto A, Triyono S, Energetic characteristic of household stoves (in Bahasa Indonesia) (2010) Sains and Technology Seminar, University of Lampung, October 18-19, 2010.
[10] Smith KR, van der Plas D, Barnes F, Openshaw K, What Makes People Cook with Improved Stoves? A Comparative Review, joint ESMAP/UNDP report (1992).
[11] Hasanudin U, Haryanto A, Sustainability assessment of biomass utilization for energy, case study in Lampung, Indonesia (2010) Presentation at 7th Biomass-Asia Workshop “Biomass as Sustainable Energy.” Agency for The Assessment and Application of Technology (BPPT), Jakarta, November 29 – December 1, 2010.
[12] BSN (Bureau for National Standard), SNI # 19-7119.2-2005 Ambient Air – Part 2: Test code for nitrogen dioxide (NO2) content with Griess Saltzman metode using
spectrophotometry (in Bahasa Indonesia).
[13] BSN (Bureau for National Standard), SNI # 19-7119.3-2005 Ambient Air – Part 3: Test code for total suspended with high volume air sampler (HVAS) instrument using gravimetry (in Bahasa Indonesia).
[14] BSN (Bureau for National Standard), SNI # 19-7119.7-2005 Ambient Air – Part 7: Test code for sulphur dioxide (SO2) content with pararosaniline metode using
spectrophotometry (in Bahasa Indonesia).
[15] BSN (Bureau for National Standard), SNI # 19-7117.11-2005 Fluegas Emission from Static Source – Part 11: Test code for air opacity using Ringelmann scale for black smoke (in Bahasa Indonesia).
[16] President of the Republic of Indonesia, Government Regulation No. 41/1999 on the Controlling Air Pollutant (1999).
[17] Khodier A, Nigel S, Kilgallon P, Legrave N, Investigation of gaseous emissions and ash deposition in a pilot-scale PF combustor co-firing cereal co-product biomass with coal, International Conference on Renewable Energies and Power Quality (ICREPQ’10) (2010) Granada (Spain), 23rd to 25th March, 2010.
[18] Erisman JW, Acid Deposition and Energy Use, Encyclopedia of Energy 1 (2004) 1-15, Elsevier, Amsterdam.
[19] Dinca C, Badea A, Marculescu C, Gheorghe C, Environmental analysis of biomass combustion process, Proceedings of the 3rd WSEAS Int. Conf. on Renewable Energy Sources (2009) 234-238, University of La Laguna, Tenerife, Canary Islands, Spain, July 1-3, 2009.
[20] Jiang R, Bell ML, A Comparison of Particulate Matter from Biomass-Burning Rural and Non-Biomass-Burning Urban Households in Northeastern China, Environmental Health Perspectives 116 (2008) 907-914.
[21] Balakrishnan K, Sankar S, Parikh J, Padmavathi R, Srividya K, Venugopal V, Prasad S, Pandey VL, Daily average exposures to respirable particulate matter from combustion of biomass fuels in rural households of southern India, Environmental Health Perspectives 110 (2002) 1069-1075.
[22] Smith KR, Khalil MAK, Rasmussen RA, Thorneloe SA, Manegdeg F, Apte M, Greenhouse gases from biomass and fossil fuel stoves in developing countries: A manila pilot study, Chemosphere 26(1993) 479-505
[24] Regalado J, Perez-Padilla R, Sansores R, Ramirez JIP, Brauer M, Pare P, Vedal S, The Effect of Biomass Burning on Respiratory Symptoms and Lung Function in Rural Mexican Women, Am J Respir Crit Care Med 174 (2006) 901-905. [25] Ministry of Environment, Regulation No. 13/1995 on The
Controlling Air Pollutant (1995) (in Bahasa Indonesia). [26] Smith KR, Uma R, Kishore VVN, Zhang J, Joshi V, Khalil
MAK, Greenhouse implications of household stoves: an
analysis for India, Annual Review of Energy and Environment 25 (2000) 741-63.