VELOCITY DISTRIBUTION OF LOW VELOCITY
WIND TURBINE WITH WINGLET
Sri Utami Handayani
Program DIII Teknik Mesin, Fakultas Teknik Universitas Diponegoro [email protected]
ABSTRACT
Drag induced by three dimensional flows in a wind turbine blade will increase the losses, which mean reduce the power generated by wind turbines. In airplanes winglet can decrease induced drag by reducing span wise flow. Theoretically bent the tip of wind turbine blade will give the same impact. The goal of this research is to investigate the velocity distribution of low velocity wind turbine with winglet. Research was conducted in an open loop wind tunnel while axial, tangential and radial velocity were measured using a five hole probe. The measurements were done in horizontal axis from -1.4R to 1.4R with a spacing of 0.2R. There were four variation in Z axis downstream of the rotor, i.e. Z/D=0.125, 0.25, 0.5, and 1.0. The pressures measured by the probe were then converted into axial, radial and tangential velocities. Results showed that flow downstream of the wind turbine is dominated by axial velocity and there were relative small tangential velocities so it might be ignored. The smallest axial velocity happened at the rotor axis, the velocity increase as the distance increase and almost equal to free stream velocity at -1.4 and 1.4R. There were a sudden velocity reduction in -1R and 1R. This reduction probably because the probe hits the vortex. Keyword :” five hole probe”, “ winglet”, “velocity distribution”
INTRODUCTION
Rotor is the main component of wind turbine which converts kinetic energy of the wind into mechanic energy. Many researchers have focused the investigation on rotor design to gain higher power output from the wind. Basically rotor is a rotated wing, so rotor design can be started from studying the flow around the wing.
One of the consequences of producing lift on a finite wing is the generation of span wise flow. In particular, the pressure gradients caused by the lower pressures on the upper surface relative to the higher pressures on the lower surface lead to
inward span wise flow on the upper surface and outward span wise flow on the lower. At the trailing edge, the merging of these two flows having different directions generates the vorticity that is shed from a finite wing and is the origin of induced drag.
Considered another way, the effect of the winglet is to produce a vertical diffusion of the vorticity in tip region. This diffusion process is also realized as an expansion of the wake in the far field due to induced velocities from the nonplanar components of the winglet. The out of plane bound vortex on an upward winglet induces horizontal velocities on the free wake that cause a span wise spreading of the wake field (Maughmer 2001).
In wind turbine the flow field in the blade tip and root is three dimensional flow, for example due to pressure difference, centrifugal and coriolis force. Tip vortex formation on wind turbine blade will decrease power output which is called blade tip losses. Blade tip losses will increase as blade number increase. Winglet in the tip of wind turbine blade hopefully will reduced induced drag and then blade tip losses.
The previous research on influence of the winglet on power coefficient showed that adding winglet on the tip of the rotor blade could increase power coefficient especially when the wind velocity below 5 m/s (Handayani, 2007). Investigation on velocity distribution of wind turbine with or without winglet is needed to study the flow behind wind turbine in order to design the optimum winglet.
Hartono (2007) have measured three dimensional flow velocity using five hole probe. Before used, the probe is calibrated to determine its sensitivity to pitch and yaw angles in a known uniform rectilinear flow field. Calibration was held on free stream velocity 5, 10, and 15 m/s, result showed that calibration curve is not depended on velocity
FIVE HOLE PROBE THEORY
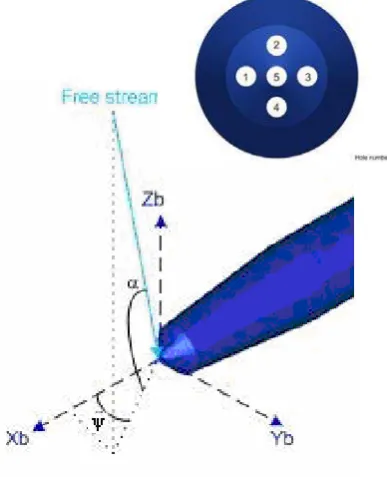
Five-hole probe is an instrument often used in low-speed wind tunnels to measure flow direction, static pressure, and total pressure in subsonic flows. From these data the associated orthogonal velocity vector component are computed. Local coordinate system and hole numbering of the probe can be seen in the figure below :
Figure 1.(a). Local coordinate system, (b). Hole numbering of the probe (Hartono, 2007)
From the above figure center of the coordinate is located in the symetrical axis of the probe. Xb axis is parallel to symmetrical axis, Yb axis parallel to horisontal line and Zb axis parallel to
vertical line. (Xb,Yb) plane called yaw(ψ)
projection of free stream velocity vector is called pitch (α) plane.
In the standard pitot static tube, the relation between velocity, static and total pressure data is formulated using Bernoulli equation with limitation the flow is subsonic and the direction of pitot static is parallel to the flow direction. Five hole probe also adopt the same principle, but for one measurement point it need five pressure data. To simplify the analysis then dinamic pressure coefficient, total pressure coefficient, yaw and pitch direction pressure coefficient are defined. For low yaw and pitch angle the dynamic pressure componet are defined as below :
p
Dynamic pressure of the probe (qp)is the
difference between maximum pressure (p5)
and the average pressure of the rest hole. Pressure coefficient which is used to represent probe response toward angle change is defined as :
(1) Pressure coefficient in yaw direction :
(2) Pressure coefficient in pitch direction :
Dynamic pressure coefficient and total pressure coefficient are define to find velocity and total pressure of the flow.
(1) Dynamic pressure coefficient
(
)
(2) Total pressure coefficient
p
First, pressure data from the five hole probe reduced into pressure coefficient in yaw and pitch direction to get yaw and pitch angle. Then flow velocity and total pressure are counted base on yaw and pitch angle, dynamic pressure coefficient and total pressure coefficient.
Dynamic pressure coefficient and total pressure coefficient is counted refer to calibration curve, then it used to estimated absolut velocity and total pressure. Finally, axial, radial and tangential velocity can be determined using this relation :
u=Vcosαcosψ (7)
v=Vcosαsinψ (8) . w=Vsinα (9)
And this relation allow static pressure of the flow to be determined (Kitoh, 1991):
= −
∫
drr w p
ps wall
2
ρ
(10)
EXPERIMENTAL METHODS
A
A
The experimental data used to find velocity distribution were collected using the aerdynamic rotor model in the open jet wind tunnel of Aerogasdynamic Laboratory of Aeronautics Engineering ITB. The model used in this experiment was three bladed, 0.26 m diameter wind turbine rotor. Rotor blade is designed based on blade element momentum theory. There was two rotor, one rotor with winglet with cant angle 60° and the other without winglet.
Figure 2. Rotor models
Before measurement session the freestream flow was set into constant velocity by regulating motor rotational speed. The rotor model with its bearing was placed on a support and mounted on a test section around 20 cm in front of wind tunnel opening. The pressure data of the
flow were measured using five hole probe connected to pressure tranducer and recorded by analog to digital converter. The five hole probe are positioned with custom built traversing system. The reading data from analog to digital converter is sent to the computer and
by Aerologger software. The output data was voltage which is then averaged and converted to pressure. For each hole of the probe in an each position there was approximately 20 data was taken.
proceed
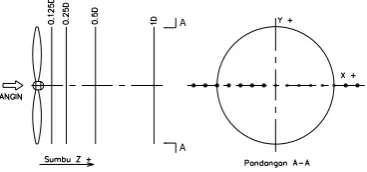
Measurements was done in horisontal direction. Measurement points was determined as below :
Figure 3. Velocity distribution measurement point.
In the X axis measurement starts from -1.4R to 1.4R with increment 0.2R. In Z axis measurement starts from 0.125D to 1D, while no variation in Y direction. For Z=0.125D measurement done from 0.2R until -1.4R, because probe movement was disturb by support. The disturbance also exist in Z = 0.25D, measurement only held from 0.4R until -1.4R.
in volt was sent to computer. Data which is received by computer is pressure data in volt and then computed using Fortran programming language to determined axial, radial and tangential velocity.
ANALYSIS
Axial, radial and tangensial velocity, yaw and pitch angle can be determined from velocity distribution measurement using five hole probe. Velocities is non dimensionalized by dividing velocity measured with reference velocity 4,72 m/s.
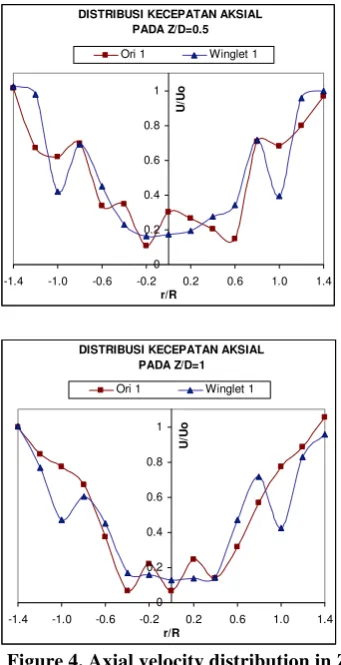
Axial velocity distribution in each Z/D position can be seen in this figure below:
DISTRIBUSI KECEPATAN AKSIAL PADA Z/D=0.125
0 0.2 0.4 0.6 0.8 1
-1.4 -1.0 -0.6 -0.2 0.2 0.6 1.0 1.4
r/R
U/
Uo
Ori 1 Winglet 1
DISTRIBUSI KECEPATAN AKSIAL PADA Z/D=0.25
0 0.2 0.4 0.6 0.8 1
-1.4 -1.0 -0.6 -0.2 0.2 0.6 1.0 1.4
r/R
U/
Uo
Ori 1 Winglet 1
DISTRIBUSI KECEPATAN AKSIAL PADA Z/D=0.5
0 0.2 0.4 0.6 0.8 1
-1.4 -1.0 -0.6 -0.2 0.2 0.6 1.0 1.4
r/R
U/
Uo
Ori 1 Winglet 1
DISTRIBUSI KECEPATAN AKSIAL PADA Z/D=1
0 0.2 0.4 0.6 0.8 1
-1.4 -1.0 -0.6 -0.2 0.2 0.6 1.0 1.4
r/R
U/
Uo
Ori 1 Winglet 1
Figure 4. Axial velocity distribution in Z/D position
area. This vortex was formed because of cylindrical hub shaped with sharp end.
At the beginning when the vortex sheded, vortex size was small, as vortex travelled downstream, vortex spiral diameter increases and then diffuse because of its viscosity. This phenomenon was not happened in rotor blade without winglet, velocity for rotor model named winglet 1 was minimum in r/R=0, and continuously increased until r/R =1
For both model velocity was dropped in position r/R=1, this velocity reduction decreased with increasing distance. Velocity reduction probably because the probe hits the area inside tip vortex, This reduction can be explained by vortex stretching through the expansion of the wake. The strength per unit length remains constant but the diameter of the vortex spiral increased, then circulation per unit volume decrease. For rotor model without winglet this reduction end in Z/D=1. To observed tip vortex existence after this distance,the measurement should be done in a farther distance, but impossible to be done because the probe hit the strainer of the tunnel.
After data reduction scheme, radial velocity can be determined, but the curve was not shown here.The radial velocity was very small compared to axial and tangential velocity. As the distance farther radial velocity is smaller and almost uniform in every r/R position.
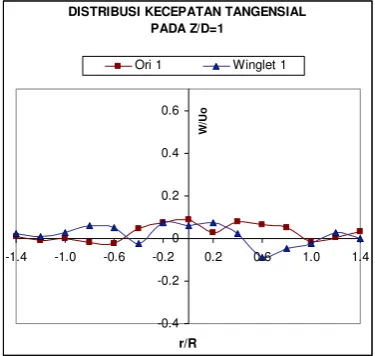
Tangential velocity for every Z/D position can be seen in this figure below :
DISTRIBUSI KECEPATAN TANGENSIAL PADA Z/D=0.125
-0.4 -0.2 0 0.2 0.4 0.6
-1.4 -1.0 -0.6 -0.2 0.2 0.6 1.0 1.4
r/R
W/
U
o
Ori 1 Winglet 1
DISTRIBUSI KECEPATAN TANGENSIAL PADA Z/D=0.25
-0.4 -0.2 0 0.2 0.4 0.6
-1.4 -1.0 -0.6 -0.2 0.2 0.6 1.0 1.4
r/R
W/
U
o
Ori 1 Winglet 1
DISTRIBUSI KECEPATAN TANGENSIAL PADA Z/D=0.5
-0.4 -0.2 0 0.2 0.4 0.6
-1.4 -1.0 -0.6 -0.2 0.2 0.6 1.0 1.4
r/R
W/
U
o
3.Velocity reduction for rotor blade with winglet in r/R=1 was higher than rotor model without winglet.
DISTRIBUSI KECEPATAN TANGENSIAL
PADA Z/D=1
-0.4 -0.2 0 0.2 0.4 0.6
-1.4 -1.0 -0.6 -0.2 0.2 0.6 1.0 1.4
r/R
W/
U
o
Ori 1 Winglet 1
ACKNOWLEDGMENT
Thanks to Ir. Sutrisno, MSME, Ph.D, Dr. Ir. Joko Sarjadi, Dr. Firman Hartono, ST, MT and everyone who has contributed to this research
NOTATION
Cα= pressure coefficient in pitch direction
Cψ= pressure coefficient in yaw direction
Cq= dynamic pressure coefficient
p = average pressure
Figure 5 Tangential velocity distribution in
Z/D position. p
1-p5 = pressure in each hole
ps = static pressure
For Z/D position = 0.125 and 0.25 tangential velocity in the area around the hub was high and decreased almost zero value as the distance increased. The flow behind the turbine was dominated by axial and tangential velocity, and radial velocity was relatively small.
pT∞ = total pressure
qp = dynamic pressure of the probe
u = axial flow velocity
v = radial flow velocity
V = total flow velocity
w = tangential flow velocity
α = pitch angle
ψ = yaw angle
CONCLUSION
ρ = fluid density
From this research we can conclude that :
1.The flow behind the turbine was
dominated by axial and tangential velocity, whereas radial velocity was very small.
2.When the probe is positioned in r/R=1 , a
REFERENCES
Anderson, J.D., 2001, Fundamentals of Aerodynamic, Third Edition McGraw-Hill
Book Company, Inc, United State of America.
Freris,L.L, 1990, Wind Energy Conversion System, Prentice Hall International(UK) Ltd,
Cambridge.
Handayani, S.U. dan Sutrisno, 2007, Penambahan Winglet untuk Meningkatkan Unjuk
Kerja Turbin Angin pada Kecepatan Angin Rendah, Prosiding Seminar SNTTM, Universitas Syiah Kuala, Aceh.
Hartono, F., 2007, Karakteristik Medan Aliran dan Studi Kestabilan Pembakaran
Non-Premixed pada Ruang Bakar Tubular dengan Aliran Putar, Disertasi Doktor, Jurusan Teknik Penerbangan, Institut Teknologi Bandung, 2007
Hau, E., 2006, Wind Turbines, Fundamentals, Technologies, Application, Economic,
Second Edition Springer-Verlag Berlin Heidelberg, Germany, hal. 79-100
Johansen, J. dan Sorensen, N.N., 2006, Aerodynamic Investigation of Winglets on Wind
Turbine Blade using CFD, Riso National Laboratory Information Service Department, Roskilde, Denmark.
Maughmer, M.D., 2001, The Design of Winglets for High Performance Sailplane, AIAA
Journal 2001-2406, 2001
Nangia, R.K, Palmer, M.E, Doe, R.H., 2006, Aerodynamic Design Studies of