12
th
Biennial Conference of
Pan Ocean Remote Sensing Conference
(PORSEC)
2014
"Ocean Remote Sensing for
Sustainable Resources"
04
–
07 November 2014, Bali-Indonesia
ii
12
thBiennial Conference of
Pan Ocean Remote Sensing Conference (PORSEC)
2014
"Ocean Remote Sensing for
Sustainable Resources"
04
–
07 November 2014, Bali-Indonesia
Scientific Committee:
Prof. Dr. Dan Ling Tang
Prof. Dr. Bonar P. Pasaribu
Prof. Dr. Made Sudiana Mahendra
Dr. Orbita Roswintiarti
Dr. Kristina Katsaros
Dr. Antony Liu
Dr. Masahisa Kubota
Editors:
Prof. Dr. Tasuku Tanaka
YAMAGUCHI Univ.
–
Japan
Dr. Gad Levy
NWRA
–
USA
Dr. James Gower
DFO
–
Canada
Dr. Ir. I Wayan Nuarsa
UDAYANA Univ.
–
Indonesia
Dr. Wikanti Asriningrum
LAPAN
–
Indonesia
Ir. Wawan K. Harsanugraha, M.Si
LAPAN
–
Indonesia
iii
12
thBiennial Conference of
Pan Ocean Remote Sensing Conference (PORSEC)
2014
"Ocean Remote Sensing for
Sustainable Resources"
04
–
07 November 2014, Bali-Indonesia
All papers in this book have been selected by the scientific committee.
All rights reserved. No part of this book may be reproduced, downloaded,
disseminated, published, or transferred in any form or by any means, except
with the prior written permission of, and with express attribution to the
author.
The publisher makes no representation, express or implied, with regard to the
accuracy of the information contained in this book and cannot any legal
responsibility or liability for any errors that may be made
.
iv
Preface
Since its establishment in 1990, the Pan Ocean Remote Sensing Conference
(PORSEC) has rapidly gained global status as one of the most prestigious
Remote Sensing Conference in the world, with a scope covering all world
oceans. PORSEC is an organization dedicated to helping developing nations
stimulate their science programs with focus on the applications of remote
sensing technology in Ocean Sciences. PORSEC has provided over a decade of
effort with scientists from over thirty countries participating in conferences
once every two years.
The Indonesian National University of Udayana, together with National
Institute of Aeronautics and Space (LAPAN), are privileged to host PORSEC
4, the Twelfth Bie ial Co fere e with the the e O ea Re ote “e si g
for “ustai a le Resour es i De pasar –
Bali, Indonesia during November
4th-7th, 2014.
The conference reviewed and discussed the state of ocean remote sensing and
will help scientists and students involved in ocean-atmosphere studies using
remote sensing techniques to benefit from interactions with the experts
participating from all over the globe. The conference also provide an
opportunity to showcase the research work carried out using remote sensing
techniques from various satellite missions and the applications of ocean
remote sensing for societal benefits.
The successful completion of the PORSEC 2014 Proceedings is the result of the
cooperation, confidence, and endurance of many people. All contributions are
greatly appreciated. It is impossible to overestimate the importance of their
efforts in helping us meet deadlines, their insights in editing, and their donation
of time.
Jakarta, March 2015
v
Local Organizing Committee
PORSEC 2014
Steering
:
Orbita Roswintiarti
National Institute of Aeronautics
and Space (LAPAN)
I Made Suastra
A.A. Raka Sudewi
Udayana University, Indonesia
Udayana University, Indonesia
Responsible Person
:
Rokhis Khomarudin
National Institute of Aeronautics
and Space (LAPAN)
Made Budiarsa
Udayana University, Indonesia
Chair Person
:
Made Sudiana Mahendra
Udayana University, Indonesia
Syarif Budhiman
National Institute of Aeronautics
and Space (LAPAN)
Co-Chair Person
:
Maryani Hartuti
National Institute of Aeronautics
and Space (LAPAN)
Takahiro Osawa
Udayana University, Indonesia
Budiarsa Suyasa
Udayana University, Indonesia
Hamidah Yunus
Udayana University, Indonesia
Members
:
Winanto
National Institute of Aeronautics
and Space (LAPAN)
Ketut Budiartawan
Udayana University, Indonesia
Noer Syamsu
National Institute of Aeronautics
and Space (LAPAN)
Gathot Winarso
vi
I Wayan Gede Astawa Karang
Udayana University, Indonesia
Nyoman Arto Suprapto
Udayana University, Indonesia
Teguh Prayogo
National Institute of Aeronautics
and Space (LAPAN)
Hanggar Prasetyo Kadarisman
Udayana University, Indonesia
Ety Parwati
National Institute of Aeronautics
and Space (LAPAN)
Rossi Hamzah
National Institute of Aeronautics
and Space (LAPAN)
I Gede Nyoman Konsumajaya
Udayana University, Indonesia
Abd.Rahman As-Syakur
Udayana University, Indonesia
I Ketut Budiartawan
Udayana University, Indonesia
Kuncoro Teguh Setiawan
National Institute of Aeronautics
and Space (LAPAN)
Ketut Sukadana
Udayana University, Indonesia
Anang Dwi Purwanto
National Institute of Aeronautics
and Space (LAPAN)
Ahcmad Supriyono
National Institute of Aeronautics
and Space (LAPAN)
I Made Sukawijaya
Udayana University, Indonesia
Komang Arya Purwanto
Udayana University, Indonesia
I Wayan Budiada
Udayana University, Indonesia
Yennie Marini
National Institute of Aeronautics
and Space (LAPAN)
Anneke K.S. Manoppo
vii
Paper and Proceeding
Coordinator:
Wawan K. Harsanugraha
National Institute of Aeronautics and Space (LAPAN)
Members:
I Wayan Nuarsa
Udayana University, Indonesia
Wikanti Asriningrum
National Institute of Aeronautics
and Space (LAPAN)
Sartono Marpaung
National Institute of Aeronautics
and Space (LAPAN)
Emiyati
National Institute of Aeronautics
and Space (LAPAN)
Kuncoro Teguh Setiawan
National Institute of Aeronautics
and Space (LAPAN)
Yennie Marini
National Institute of Aeronautics
and Space (LAPAN)
Anneke K.S. Manoppo
National Institute of Aeronautics
and Space (LAPAN)
Nanin Anggraini
National Institute of Aeronautics
and Space (LAPAN)
Syifa Wismayati Adawiah
National Institute of Aeronautics
and Space (LAPAN)
Hamdi Eko Putranto
National Institute of Aeronautics
and Space (LAPAN)
Udhi Catur Nugroho
National Institute of Aeronautics
and Space (LAPAN)
I Made Karsika
Udayana University, Indonesia
Putu Ari Ardiswana
viii
CONTENTS
A.
ORAL PRESENTATIONS
1 Habitat Model Development of Pacific Saury (Cololabis Saira) Using Satellite Remotely Sensed Data in the Northwestern North Pacific
Achmad Fachruddin Syah, Sei-Ichi Saitoh, Irene Alabia, and Toru Hirawake
1-12
2 Cost-Effective Approach to Estimate Unreported Data: Rebuilding History of Lift-Net Fishing in Kwandang Waters
Andhika Prima Prasetyo, Duto Nugroho, Lilis Sadiyah, and Rudy Masuswo Purwoko
13-20
3 The Use of Image Rotations on Multispectral-Based Benthic Habitats Mapping
Pramaditya Wicaksono
21-30
4 The Utilization of Landsat-8 for Mapping the Surface Waters Temperature of Grupuk Bay - West Nusa Tenggara: with Implications for Seaweeds Cultivation
Bidawi Hasyim, Syarif Budiman, Arlina Ratnasari, Emiyati, and Anneke Manoppo
31-40
5 Multispectral Satellite Data for Mapping of Coral Reef Death Due to El Niño Southern Oscillation (ENSO) in Western Sumatra
Munawaroh and Nurul Ihsan Fawzi
41-46
6 Spatial-Temporal Variability of Satellite-Derived Phytoplankton Size Classes in the South China Sea
Hai Jun YE, Dan Ling TANG, and R.P.P.K. Jayasinghe
47-58
7 Morphological Characteristics of Antarctic Coast Based on the Laser Altimetry
Jieun Kimand Jaehyung Yu
59-62
8 Investigation of Coastal Sediment Spectrums Behavior Based on Moisture Content and Mineralogy; a Case Study of South Korea
Haein Shin and Jaehyung Yu
63-66
9 40 Year Record of Antarctic Coastal Change from 1960s to 2000s Based on the Remote Sensing Monitoring
Jaehyung Yu and Yongshik Jeon
67-70
10 Performance Multimodel Climate-Sytem Historical Forecast Project (CHFP) in Characterize Feature and Impact of El Nino Modoki
Ida Bagus Mandhara Brasika and Nurjanna Joko Trilaksono
71-78
11 Shallow Sounding Bathymetric Using Multibeam Echosounder and Topographic Laser Scanner
Nursugi, Tri Patmasari, dan Khafid
79-86
12 Impacts of Human Activities on the Evolution of Estuarine Wetland in the Yangtze Delta from 2000 to 2010
Lei Zhang Bingfang Wu Kai Yin·Xiaosong Li· Kun Kia· Liang Zhu
87-102
13 New Land Accretion from 2000-2003 at Segara Anakan Lagoon, Southcoast of West and Central Java
I Wayan Lugra, Deny Setyady, I.N. Astawa, G.M. Hermansyah, and P.H. Wijaya
103-114
14 Spatial Dynamics and Distribution of Live Coral, in Outer Zone, Spermonde Archipelago, Indonesia
Nurjannah Nurdin, Khaerul Amri, Abd. Rasyid Djalil, Ilham Jaya, Agus, and M. Akbar A.S.
115-126
)
ix
ApplicationsIn Fisheries and Aquaculture Management
Vittorio Barale, Jean Dusart, Michael Assouline, and Alberto Lorenzo-Alonso
16 Influence of the Asia Monsoon on the Red Sea Basic Ecosystem Dynamics
Vittorio Baraleand Martin Gade
137-150
17 Three Dimensional Reconstruction of Rain Rates from X – SAR Measurements Using Tomography
Marco Moscatelli and Gad Levy
151-162
18 Application of Multibeam Data for Characterizing Seabed Geology at Morotai Strait
Taufan Wiguna and Muhammad Irfan
163-170
19 Wave Characteristics of Indonesian Waters for Sea Transport Safety and Planning
Mia Khusnul Khotimah and Roni Kurniawan
171-186
20 Remote Sensing Applied to the Analysis of Spatial and Temporal Patterns of Dengue Incidence Based on Ecological and Socio-Economic and Demographic Factors in Sri Lanka
Sumiko Anno, Keiji Imaoka, Takeo Tadono, Tamotsu Igarashi, Subramaniam Sivaganesh, Selvam Kannathasan, Vaithehi Kumaran, and Sinnathamby Noble Surendran
187-194
21 Bigeye Tuna (Thunnus Obesus) Hotspots in the Eastern Indian Ocean Off Java
Mega Syamsuddin, Sei-Ichi Saitoh, and Toru Hirawake
195-200
22 Comparison of Sun Glint Correction Methods for Casi-1500 Data in Shallow Waters
Joo-Young Jeon, Sun-Hwa Kim, Chan-Su Yang, and Kazuo Ouchi
201-208
23 The Study on the Development of Satellite Data Processing System
Chen Yuanwei
209-216
24 Comparative Study of Phytoplankton Bloom in Indonesian Waters Using Aqua-Modis Satellite Data
Rion S. Salman dan Ayufitriya
217-224
25 Spaceborne SAR Imaging of Coastal Ocean Phenomena in the China Seas
Xiaofeng Li and Feng Sha
225-228
26 Monthly Sea Surface Salinity Variation in Aru and Arafura Sea By Using Aquarius Satellite Image Data
Yuwana Setiabudi Sriraharjoand Susanna Nurdjaman
229-234
27 Business Process Analysis for High Resolution Remote Sensing Data Acquisition and Distribution
Andie Setiyoko and Rubini Jusuf
235-240
28 Using Satellite Remote Sensing and Catch Data to Characterize Potential Fishing Zones for Skipjack Tuna in Bone Bay-Flores Sea During Northwest Monsoon
Mukti Zainuddin, Safruddin, M. Banda Selamat, Adam Malik, and Sei-Ichi Saitoh
241-250
29 Analysis of Total Suspended Solid Using Landsat 8 Imagery (Study of Case: Sampit Bay, Indonesia)
Anang Dwi Purwanto and Syarif Budhiman
251-256
30 Monitoring Volcanic Activity of the Nishinoshima Island from Spaceborne SAR
Tadashi Sasagawa
257-260
31 Modeling Sensor Proton Magnetometer in Small Satellite
Sofian Rizal
261-266
32 Variability of Chlorophyll-a Distribution and Its Relation to the Wind Patterns in Lombok Waters
Anneke K.S. Manoppo, Muhammad Riandy, Emiyati, Bidawi Hasyim, and Syarif Budhiman
C
x 33 An Evaluation of Theuse of SRTM Data to the Accuracy of Local Geoid Determination: A
Case Study of Yogyakarta Region, Indonesia
Bagas Triarahmadhana and Leni S. Heliani
273-280
34 Ocean Front Application on Fishing Ground Identification in the Sourthern Taiwan Strait
Yi Chang, Ming-An Lee, Tzu-Huang Chang, and Cheng-Hsin Liao
281-286
35 The Effect of Different DEM Accuracyon the Orthoimage Generation
Jali Octariady, Djurdjani, and Heri Sutanta
287-292
36 Blue Carbon Stock of Mangrove Ecosystem in Nusa Penida, Bali
Mariska A. Kusumaningtyas, August Daulat, Devi D. Suryono, Restu Nur Afi Ati, Terry L., Kepel, Agustin Rustam, Yusmiana P. Rahayu, Peter Mangindaan, Nasir Sudirman, and Andreas A. Hutahaean
293-300
37 Distribution and Sources of Oil Slicks in the Middle Adriatic Sea
Mira Morović, Andrei Ivanov, Marinko Oluić, Žarko Kovač, and Nadezhda Terleeva
301-308
38 New Mangrove Index as Degradation/Health Indicator Using Remote Sensing Data: Segara Anakan and Alas Purwo Case Study
Gathot Winarso, Anang D. Purwanto, and Doddy M. Yuwono
309-316
39 The Improvement of the Sustainable Aquaculture Model for Kelp and Scallop in Southern Hokkaido, Japan Using Satellite Remote Sensing, GIS and OGCM
Yang Liu, Sei-Ichi Saitoh, I. Nyoman Radiarta, and Toru Hirawake
317-322
40 Satellite Detection of Giant Colonies of PhaeocystisGlobosa in Coastal Waters off Viet Nam
Montes-Hugo M.A., Doan-Nhu H., and Nguyen-Ngoc L.
323-328
41 MCS Detection Using Lightning Recording and Satellite Imagery
I Putu Dedy Pratama, Pande Komang Gede Arta Negara, Pande Made, and Rony Kurniawan
329-336
42 Analysis of Cloud Removal Method on Sea Area Using Landsat-8 Multi-Temporal
Danang Surya and Candra Yudi Prabowo
337-340
43 Accuracy Estimation and Validation of Offshore Wind Speed by Using Terra SAR-X
RyotaroAbo, Katsutoshi Kozai, Teruo Ohsawa, and Koji Kawaguchi
341-344
44 Suomi National Polar-Orbiting Partnership Satellite Data Processing System to Produce Sea Surface Temperature
Budhi Gustiandi and Andy Indradjad
345-354
45 Bio-Physical Coupling in the Bay of Bengal – A Remote Sensing Perspective
Benny N. Peter, Mridula K.R., Mazlan Hashim, and Nadzri Reba
355-362
46 Analysis of Monthly Mean Surface Currents for Bali Waters Using OSCAR
Subekti Mujiasih and A. Rita Tisiana Dwi Kuswardani
363-372
47 Sea Surface Chlorophyll Fronts in the Taiwan Strait
Yi-Sin Fang, Tzu-Huang Chang, and Yi Chang
372-376
48 Shoreline Change Analysis of Gulf of Cambay Using GIS
Vivek Gouda and Robinu Rose Mathew
377-380
49 Seasonal and Inter-Annual Variability of the Coccolithophore Blooms in the Barents and the Black Seas from Satellite Data
Oleg Kopelevich, Sergey Sheberstov, Vladimir Burenkov, and Svetlana Vazyulya
381-390
50 Observed the Indian Ocean Dipole 2011 from Satellite and In-Situ In West Java Sea Waters
Jonson Lumban-Gaol, Bonar P. Pasaribu, Djisman Manurung, Risti Endriani Arhatin, Sripujiati, and Marisa Meiling
391-394
51 Satellite Altimetry and Hydrologic Modeling of Poorly-Gauged Tropical Watershed
Y. Budi Sulistioadi, Kuo-Hsin Tseng, C.K. Shum,Michael F. Jasinski, and Hidayat
C
xi 52 Harmful Algal Bloom Phenomenon in Lampung Bay Base on Red Tide Analysis Using
SPOT-4 Image
Emiyati, Ety Parwati, and Syarif Budhiman
405-408
53 Acoustic Emission and Laser Breakdown of Water with Different Salinity
Alexey V. Bulanov
409-414
54 Squid Habitat Hotspots in Pelagic Waters of Western and Central North Pacific: Roles of Eddies and Sub-Surface Features
Sei-Ichi Saitoh, Irene Alabia, Robinson Mugo, Hiromichi Igarashi, Yoichi Ishikawa, Norihisa Usui, Masafumi Kamachi, Toshiyuki Awaji, and Masaki Seito
415-420
55 Extraction Method Development in Land and Ocean Salinity
Wiweka
421-428
56 Indonesian Multi-Scale Grid System for Environmental and Oceanic Data
Akhmad Riqqi and Ivonne M. Radjawan
429-434
57 Mapping of Total Suspended Matter Using Landsat 8 in Coastal Areas of Lombok Island
Emiyati, Anneke K.S. Manoppo, and Syarif Budhiman
435-438
58 Trend Analysis of Mean Sea Level at South China Sea Using Mann-Kendall Method
Moehammad Ediyan Raza Karmel
439-446
59 Visualization System of Monthly Average Sea Surface Temperature Modis Using KML in Google Earth
Andy Indradjad and Yennie Marini
447-452
60 On the Use of Satellite-Measured Chlorophyll Fluorescence for Monitoring Coastal and Ocean Waters
Jim Gower
453-460
61 Global Sea Level Rise: the Case for a Dam on the Strait of Gibraltar
Jim Gower
461-468
62 Compatibility Test of Windsat Data over Indonesian Monsoon Path
I Ketut Swardika
469-476
63 Extraction Model of Dissolved Oxygen Concentration Using Landsat Remote Sensing Satelite Data. Case Study: Ringgung Coastal Waters
Muchlisin Arief
477-488
64 Oceanographic Characteristics Studies in North of Papua Waters Between 2010 to 2012 Using Modis Imagery
Amalia Hadiyanti and Retnadi Heru Jatmiko
489-496
65 Spatial Distribution and Interaction of Phytoplankton, Zooplankton and Fish Biomass at the North of Papua
A. Hartoko and Subiyanto
497-504
66 Temporal and Spatial Changes of the Coastline and Coastal Wetlands in the Red River Estuary, Vietnam from 1986 to 2013
Nguyen Tien Cong, Ngo DucAnh, and Nguyen Thi Thu Thuy
505-514
67 Development of Ocean Wave Spectrum Estimation from HF Radar
Yukiharu Hisaki Syah
515-520
68 A Numerical Simulation of Wave and Sediment Transport in the Balikpapan Bay, East Kalimantan, Indonseia
Idris Mandang, Ashadi A. Nur, and Arya M. Fitroh
521-526
69 Numerical Simulations in Coastal Hydraulics and Sediment Transport: Application to Mahakam Estuary, East Kalimantan, Indonesia
Ansorullah Jamal, Idris Mandang, and Pariwate Varnakovida
xii 70 The Effect of Different Atmospheric Correction on Bathymetry Extraction Using Landsat
Satellite Imagery
Kuncoro Teguh Setiawan, Yennie Marini, Achmad Supriyono, and Syarif Budhiman
533-538
71 Spatial Data Analysis and Remote Sensing for Observing Tsunami-Inundated Area
Abu Bakar Sambah andFusanori Miura
539-548
72 Development of Method for Extracting Low-Level Tropospheric Moisture Content from Ground Based GPS Derived Precipitable Water Vapor (PWV)
Aries Kristianto, Tri Wahyu Hadi, and Dudy Darmawan Wijaya
549-558
73 VIIRS Detection of Lit Fishing Boats
Christopher D. Elvidge, Mikhail Zhizhin, Kimberly Baugh, and Feng-Chi Hsu
559-562
74 The Assessment of Mangrove Ecosystem for Capture Fisheries Product
Dewayany Sutrisno, Yatin Suwarno, and Irmadi Nahib
563-568
75 Utilization of Satellite Remote Sensing Data for the Determination of Potential Fishing Areas and Its Validation in the Strait of Bali
Nyoman Dati Pertami and Komang Iwan Suniada
569-574
76 Spatial Distribution Analysis of Albacore Tuna (Thunnus Alalunga) Using Argo Float Sub-Surface Temperature Related to Indian Ocean Dipole (IOD) Impact in South Java Indian Ocean
Bambang Sukresno, Agus Hartoko, Budi Sulistyo, and Subiyanto
575-582
77 Sea Surface Temperature Measurement from TMI and Modis Data
Yennie Marini, Gathot Winarso, and Anneke K.S. Manoppo
583-588
78 Prediction of Coral Reef Damage Using Cellular Automata-Markov
Agus Aris, Nurjannah Nurdin, Vincentius P. Siregar, and Ibnu Sofian
589-596
79 Estimation of Sea Surface Temperature Distribution in Ekas Bay Using Landsat-8 Satellite Imagery
Muhammad Ramdhan
597-604
80 Coastal Characteristics of Indonesia and Its Relation to the Tsunami Hazard
M. Priyatna, M. Rokhis Khomarudin, and Dini Ambarwati
605-614
81 Evaluation of Multitemporal Landsat Satellite Images to Identify Total Suspended Solid (TSS) Alteration in Saguling Reservoir, West Bandung, Indonesia
Anjar Dimara Sakti, Soni Darmawan, and Ketut Wikantika
615-622
82 Sea Surface Temperature Variability in the Southern Part of Java Island and the Lesser Sunda: Corresponding to the Indian Ocean Dipole Mode (IODM)
I Gede Hendrawan, I Wayan Gede Astawa Karang, I Made Kertayasa, and I G.A. Diah Valentina Lestari
623-630
83 Laboratory Study of Cross-Polarized Radar Return at Gale-force Winds
Yu. Troitskaya, V. Abramov, A. Ermoshkin, E. Zuikova, V. Kazakov, D. Sergeev, and A. Kandaurov
631-636
84 Satellite Observation of Large-Scale Coastal Change: A Case Study from Cigu Lagoon, Taiwan
Tzu-Huang Chang, Yi Chang, Laurence Zsu-Hsin Chuang, and Ming-An Lee
637-642
85 Sea Surface Temperature and Sea Surface Chlorophyll in Relation to Bigeye Tuna
Fishery in the Southern Waters Off Java and Bali
Martiwi Diah Setiawati and Fusanori Miura
643-654
86 Mode 2 Internal Solitary Waves: Measurements of Surface Currents from Laboratory Experiments and Numerical Simulations, and the Results of a SAR Simulator
Donald P. Delisi, Jinsong Chong, Xiangzhen Yu, Thomas S. Lund, and David Y. Lai
C
xiii 87 TheClimateChangeImpactonCoralin WehIsland and Aceh Island Indonesia
A. Besse Rimba, Joseph Maina, and Fusanori Miura
663-670
88 Investigating the Effect of Rainstorm on Coastal Coral Reef Water -- A Case Study in Xuwen Coral Reef Coast Region, South China
Weiqi Chen, Xuelian Meng,Shuisen Chen, Liusheng Han, and Siyu Huang
671-682
89 Satellite Remote Sensing in Fishery Forecast in India: Past, Present, and Challenges
Aishwarya Narain
683-690
90 Identifying of Change of Mangrove Forest and Mining Areas at the Coastal of Karimun Besar Island
Tatik Kartika and Silvia Anwar
691-696
91 Basin Configuration Identification by Airborne Gravity in WesternTanjung, South Borneo
Ermin Retnowati, Dyah Pangastuti, Boko Nurdiyanto S., Arisauna M. Pahlevi, Gonata Pranajaya and Thomas Cafreza Atarita
697-704
92 A DASH7 Based Monitoring System for Mariculture Environment
Yuvin Ha, Sang-Hwa Chung, Yun-Sung Lee,Ik Joo Jeong, Sung-Jun Lee, Jung-hoon Cha, and Hyong-ki Yoon
705-712
93 Assessment and Mapping of Coastal Vulnerability to Sea Level Rise (Case Study at Semarang Coastal Area, Central Java)
Husnayaen, Takahiro Osawa, and Ida Ayu Astarini
713-722
94 Detecting the Affected Areas of Mount Sinabung Eruption Using Landsat-8 Based on Reflectance Change
Suwarsono, Hidayat, Jalu Tejo Nugroho, Wiweka, Parwati, and M. Rokhis Khomarudin
723-734
95 Detection of Seabed in Seribu Islands Seawaters
Sri Pujiyati, Kaisar Akhir, and Risti E. Arhatin
735-738
96 The Creation of Forest Base Probability Image in Coastal Area of East Kalimantan Indonesia Using Canonical Variate Analysis
Ita Carolita and Tatik Kartika
739-744
97 Satellite Data for Water Clarity Mapping in Indonesia Lake Water
Bambang Trisakti, Nana Suwargana and I Made Parsa
745-752
98 Study on Seasonal Variability in Internal Wave Signatures in the Lombok Strait Area Using SAR and Optical Sensor
I Wayan Gede Astawa Karang, Takahiro Osawa, Leonid Mitnik, and I Made Satria Wibawa
753-766
B.
POSTER PRESENTATIONS
01 Bathymetric Mapping of Shallow Water Surrounding Dongsha Island Using Quickbird Image
Li Dongling, Zhang Huaguo, and Lou Xiulin
769-774
02 Impacts of Typhoons on Hypoxia Off the Changjiang (Yangtze River) Estuary: Estimations from Satellite Data
Jianyu Chen, Zhihua Mao, Fang Gong, and Kui Wang
775-782
03 Investigation of Whitening Event Using Hyperspectral Data in the Coastal Region of Jeju Island, South Korea
Sun-Hwa Kim, Joo-Young Jeon, and Chan-SuYang
783-788
04 Vertical Structure in the North Pacific Subtropical Gyre Based on the Wind-Driven Circulation Theory
Rina Tajima, KunioKutsuwada, and Kunihiro Aoki
C
xiv 05 Design and Construction of a Remote Sensing-Based Harmful Algal Blooms Monitoring
System
Qiankun Zhu, Bangyi Tao, Hui Lei, and Jianyu Chen
797-802
06 The Propagation and Sources Analysis of the Internal Waves in the Northwestern South China Sea Based an Satellite Remote Sensing
Juan Wang, Jingsong Yang, Huaguo Zhang, Dongling Li, Lin Ren, and Gang Zheng
803-808
07 Acceleration Development Region Capture Fisheries Economy Oriented (A Case at Coast Southern District Garut West Java Province)
Atikah Nurhayatidan and Agus Heri Purnomo
809-816
08 Developing Fishing Grounds Prediction Model for Neon Flying Squid in the Central North Pacific Using Satellite Remote Sensing and Vessel Monitoring System
Yang Liu, Sei-Ichi Saitoh, Hiroki Takegawa, and Toru Hirawake
817-820
09 Construction of Long-Term Data Set of Sea Surface Wind Speed/Stress Vectors by Multiple Satellite Observations
Suguru Kameda and Kunio Kutsuwada
821-828
10 Evaluation of Offshore Wind Energy Resources by Using Scatterometer and Radiometer-Derived Wind Speeds and WRF
Katsutoshi Kozai, Tsuguhiro Morita, and Teruo Ohsawa
829-832
11 Monitoring the Impact of Sea Surface Temperature Increase on Coral Bleaching in Indonesian Waters
Rion S. Salman and Ayufitriya
833-838
12 Spectral Unmixing Applied to Meris Images of Berau Estuary Waters to Separate the Effects of Atmospheric Haze from Water Sediment
Widiatmaka, Wiwin Ambarwulan, Bambang Riadi, Irmadi Nahib, Syarif Budhiman, and Abdul Halim
839-848
13 Spatial Multi Criteria Land Evaluation and Remote Sensing for Area Delineation of Shrimp Pond Culture Revitalization in Mahakam Delta, Indonesia
Wiwin Ambarwulan, W. Verhoef, and C. Mannaerts
849-856
14 Settlement Pattern of Bajoe Tribe in Indonesia Based on Remote Sensing Data Satellite Observation
JakaSuryanta
857-862
15 Local Economic Wisdom for Sustainable Coastal Resources: Lemukutan, West Kalimantan
Suhana, Aninda W. Rudiastuti, and Gatot Rudiyono
863-870
16 Monitoring Changes on Mangroves Coasts Using High Resolution Satellite Images. A Case Study in the Perancak Estuary, Bali
Christophe Proisy, Rinny Rahmania, Gaëlle Viennois, Ariani Andayani, Sophie Baudel, Riza Fahran, Niken Gusmawati, Olivier Germain, Hugues Lemonnier, Nurman Mbay, Bambang Nugraha, Juliana Prosperi, Frida Sidik, Berni Subki, Suhardjono, Nuryani Widagti, and Philippe Gaspar
871-876
17 Research on 3D Simulation of FY-2E Infrared Satellite Cloud Image Based on Open GL
Liuo Jiano and Fan Xiangtao
877-880
18 A Method of Evaluating Island Exploitation Degree Based on Multi-Scale Analysis of Remote Sensing Indices
Zhang Huaguo, Li Lihong, Shi Aiqin, Li Dongling, and Lou Xiulin
12th Biennial Conference of Pan Ocean Remote Sensing Conference (PORSEC 2014)
04 – 07 November 2014, Bali-Indonesia
753
STUDY ON SEASONAL VARIABILITY IN INTERNAL
WAVESIGNATURES IN THE LOMBOK STRAIT AREA
USING SARAND OPTICAL SENSOR
I Wayan Gede Astawa Karang1,2,*), Takahiro Osawa2),
Leonid Mitnik3), and I Made Satria Wibawa4)
1)Department of Marine Sciences, Faculty of Marine Science and Fisheries, Udayana
University, Kampus Bukit Jimbaran 80361 Bali, Indonesia
2)Center for Remote Sensing and Ocean Scince (CReSOS), Udayana University,
PB Sudirman Street Denpasar 80232 Bali, Indonesia
3)V.I. Il'ichev Pacific Oceanological Institute FEB RAS, Vladivostok, Russian Federation 4)Department of Physics, Udayana University
*)E-mail: [email protected]
ABSTRACT
The distribution of internal waves in the Lombok Strait area has been studied by screening Advanced Land Observing Satellite Phased Array L-band Synthetic Aperture Radar (ALOS
PALSAR) images and Satellite Pour l’Observation de la Terre (SPOT) images for sea surface
signatures of internal waves. This paper describes the use of satellite imagery for internal wave frequency detection and presents the results from a survey that detected 322 internal wave occurrences with combined ALOS PALSAR and SPOT imagery over the period January 1996 to December 2011. The occurrence of internal wave signatures is correlated with the phase of the spring neap tidal cycle. The paper also discusses the spatial and temporal distribution of internal wave occurrences in the Lombok Strait area.
Keywords: ALOS PALSAR , internal waves, Lombok Strait, SPOT
1.
INTRODUCTION
Internal wave is one of the oceanic
phenomena that lead interest to
oceanographers because its implications and impact for the surrounding environment. In terms of physical, internal waves can cause vertical mixing that would change the structure of the sea water locally and globally. Indonesia seas consist of complex bathymetry and are located between two continents and
two oceans. From previous research,
Indonesian seas can be regarded as a mixer of Pacific Ocean water before the exit to the Indian Ocean trough Indonesian Throughflow (ITF) (Wyrtki, 1987; Miyama et al., 1995;
Godfrey, 1996; Gordon, 2005). Lombok Strait is one of the most important exit flows of
Indonesian Throughflow, where twenty percent amount of the water mass of the Pacific Ocean into Indian Ocean transferred by this strait (Murray and Arief, 1988). The importance of the Lombok Strait extends far beyond of its regional role. There is a large body of research work dealing with different aspects of Lombok Strait circulation and dynamics (Murray and Arief, 1988; Arief,
1992; Arief et al., 1996; Gordon, 2005;
Hautala et al., 2001; Potemra et al., 2002;
Atmadipoera et al., 2009) Satellite sensor imaging and numerical study have been revealed that the Lombok Strait is a narrow channel where the energetic internal waves occurred frequently (Jakson et al, 2004;
Jackson, 2007; Mitnik et al. 2000; Susanto et al, 2005; Ningsih et al, 2008; Mathews et al.
12th Biennial Conference of Pan Ocean Remote Sensing Conference (PORSEC 2014)
04 – 07 November 2014, Bali-Indonesia
754
Aperture Radar (SAR) and visible images show that the wave crests
1
line may reach 100 km or more (Mitnik et al.,
2000; Susanto et al., 2005; Karang et al.,
2011). By using numerical experiment indicates that the two dimensional internal wave structure can well be described by the solitary wave solutions to the Kartoweg-de Vries (KdV) equation (Korteweg and de Vries, 1985). The characteristics amplitude of internal solitary wave is about 39.45 m (Jaharrudin, 2004).
Of the study of the internal wave in the Lombok Strait, there are various results. Mitnik et al (2000) and Susanto et al. (2005) suggested that the internal wave occurrence were generated by the interaction of successive tidal flows with the sill south of the Lombok Strait. Visser (2004) has initiated the study using a mathematical approach that links theory of relationship instability Kelvin-Helmholzt with internal wave generation. He made observations on internal waves with a two layer approach of sea water and search the values of frequency, wavelength and velocity of flow dispersion relation equation with the basic principle of Kelvin-Helmholtz instability approach, which values the amplitude of the waves causes the price to be increased or decreases exponentially both spatially and temporally. Jaharrudin (2004) applied the asymptotic method to obtain solutions of higher-order KdV equation is done by modified the equations of motion of internal waves by using two methods, namely Lagrange and Hamilton methods. Assuming internal wave soliton characteristics, obtained estimates of wave amplitude solitons in northern Lombok Strait of 39.45 m at a depth of 1500 m. Pujiana (2004) and Ningsih et al.
(2008) concluded that the interaction of barotropic tidal currents with sill generating internal waves in the Lombok Strait. Recently, Matthews et al (2011) analyzed the statistics of satellite SAR images gathered over the
Lombok Strait region, and suggest that it is necessary to recognize two main classes of high-frequency nonlinear internal waves in the Lombok Strait region; Arc-like internal wave and irregular internal wave.
All the hypotheses have their own bases
and reasonableness. However, these
hypotheses must face to the same challenge, i.e., how to explain the seasonal variability of internal waves occurrence? It is the primary motivation for this study to look for other seasonal mechanisms, which are best suitable for description of internal wave behavior observed in the Lombok Strait, and give proper explanations to the seasonal variability of internal wave generation in the Lombok Strait. The main aim of this study is to
comprehensively describe the seasonal
variability of the internal wave occurrence in the Lombok Strait.
2. REASEARCH METODOLOGY 2.1 Study Area
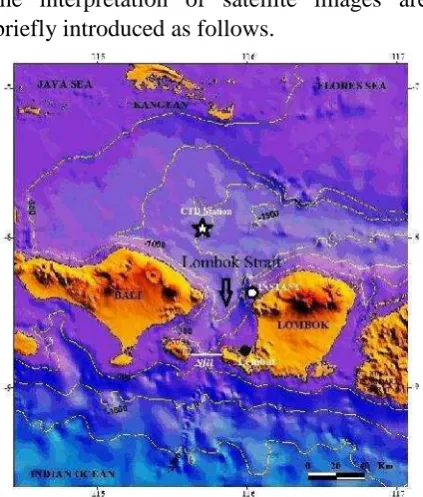
The Lombok Strait is located between the islands of Bali and Lombok (Figure 2.1), within the center of the strait are 8 S latitude and 116 E longitude. It connects with Flores Sea from the north and East
Indian Ocean from the south. As one of the outflow channels of ITF, the study area is vital to climate change, as a transit area of warm water from western Pacific Ocean and cold water from the eastern Indian Ocean. The zone of satellite data observation to be investigated is rectangular: from 7.260 to
9.830 S and 115.060 to 1160 E. The isobaths are also shown in Figure 2.1. One can see that the depth of satellite data locations range from 300 to 3300 m with sallow sill lies between small islands of Nusa Penida and Lombok.
12th Biennial Conference of Pan Ocean Remote Sensing Conference (PORSEC 2014)
04 – 07 November 2014, Bali-Indonesia
755
the interpretation of satellite images are briefly introduced as follows.
Figure 1. Map of the study area, with location of the sill in the south of part of channel is marked. The rectangular show the coverage area of the satellite images used in this study. The star mark shows the CTD location for the vertical structures used in this study. The white and black dot shows the INSTANT velocity observation and Lembar tide gauge station, respectively.
2.2 General Circulation Features of the Lombok trait
2.2.1 Vertical Structures
The vertical density structures of the upper ocean are an important factor for dynamics of internal waves. In order to determine the representative values of the parameters, which are used to describe such structures in the study area, we consulted the historical field measurement from nearest station. The temperature and salinity data measured in the upper 1500 m of depth for both of monsoons (Southeast monsoon and Northwest monsoon) by using Conductivity Temperature and Depth (CTD) instrument. The data were collected on a huge project by Arlindo Mixing Cruises in 1993 and 1994 (Arlindo Mixing Report, 1999) are shown in Figure 2. Based on temperature distribution, one can see that the upper ocean can roughly be divided into two layers; the upper layer with a temperature 29oC and the
lower layer with a temperature of 16oC. There is a thermocline or interface area between 50 and 150 m in depth, which is the decisive area for internal wave existence. Of course, the ocean water density is dependent not only the temperature but also the salinity.
2.2.2 Surface Circulation
The surface circulation in the study area is
subjected to the influence of the
AsianAustralian monsoon system that is characterized by six month reversals in the winds associated with the southeast and northwest monsoon (Figure 3). The peak of the southeast monsoon is in June-JulyAugust while the northwest monsoon peak is in
December-January-February. Figure 3
shows the condition of the sea surface slope during the southeast monsoon (September) and northwest monsoon (January). The sign and strength of the geostrophic current of the North-South direction are directly linked to the sea surface slope. For example, if the sea surface slope at Lombok higher than Bali (during southeast monsoon), then the flow is to the south. The effect of monsoon on the transport through the study area can be clearly found on research done by Susanto et al. (2007).
12th Biennial Conference of Pan Ocean Remote Sensing Conference (PORSEC 2014)
04 – 07 November 2014, Bali-Indonesia
756 Figure 2. Observed data of temperature (black line)
and salinity (gray line) distribution in the o o
Lombok Strait area (7.8 S, 115.6 E). The data derived from Arlindo Mixing Project: CTD station no 102 for southeast monsoon cruise (September, 1993) and CTD station no 105 Northwest Monsoon Cruise (January, 1994).
Figure 3. Schematic diagram of the water circulation within the Lombok Strait during the southeast monsoon (left) and northwest monsoon (right) (adapted from Susanto
et al., 2007).
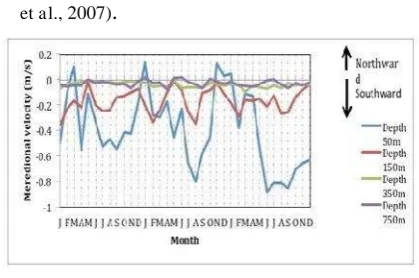
Figure 4. Seasonal and interannual variability of the velocity in the Lombok Strait area derived from INSTANT program
2.2.3 Tides
Apart from the net current velocity, for the local oceanography characteristics of great decisive for the ocean circulation are the
dynamics of tides. The tides in the Indonesian seas are largely produced by tidal wave propagation from the Pacific and Indian Ocean (Schiler et al., 2004; Karang et al., 2010). The barotropic M2 (semi diurnal tide with a period
12.4 hours) and K1 (diurnal tide with period
24.8 hours) tidal currents are relatively strong in Lombok Strait. The northern part of the Lombok Strait has mixed tides that have a pre dominantly diurnal cycle (Chong et al., 2000). However, the tide at the sill region is predominantly semi diurnal; tidal velocity there can exceed 3.5 m/s (Murray and Arief,
1988; Murray et al., 1990).
Nonlinear interactions between the semi diurnal and diurnal tidal components induce a strong tide with a period close to 14 days (Ffield and Gordon, 1996; Susanto et al., 2000; Susanto et al., 2005).
2.3. Multi Sensor Techniques
During 1996-2011, a satellite monitoring of the Lombok Strait area was conducted annually during the months of January to December. Over this period, images taken by SAR and visible images on all passes of ALOS PALSAR and SPOT satellites over the Lombok Strait area were obtained and processed. The basic satellites data for internal wave survey are complemented by other climatological data on the condition of the water properties such as wind speed, vertical temperature distribution, tides information, and sea surface high anomaly. This allows us to systematize the data and draw some conclusions on dynamics processes in the Lombok Strait area. Our approach to internal wave dynamics study is based on the following:
a. Satellite Data
12th Biennial Conference of Pan Ocean Remote Sensing Conference (PORSEC 2014)
04 – 07 November 2014, Bali-Indonesia
757
ALOS PALSAR and SPOT archived data from 1996 to 2011 in the
Lombok Strait area (115.06o-116.32oE, 7.26o-
9.83oS) were used for this study. The PALSAR images, covering a period of five years, from May 2006 to April 2011, were collected by the Japan Aerospace Exploration
Agency (JAXA, https://auig.eoc.
jaxa.jp/auigs/top/TOP1000 lnit.do) and the Japanese Earth Remote Sensing and Data Acquisition Center (ERSDAC, http://www. ersdac.or.jp). A total of 1013 scenes with different Granule ID were examined, of which 673 images were obtained by the Fine Mode and 340 images by the widerswath Scan SAR mode. A total of 90 images taken on different days with visible internal wave imagery were collected.
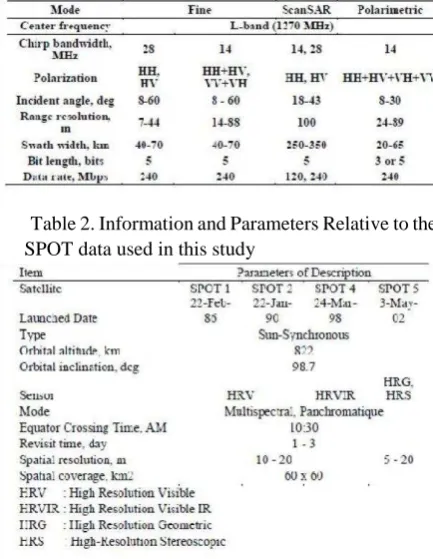
Table 1. PALSAR Characteristic
Table 2. Information and Parameters Relative to the SPOT data used in this study
Further data were derived from archives of visible band SPOT browse through data archived, from 1996 to 2011, maintained by the Center for Remote Imaging, Sensing and
Processing. (CRISP,
http://www.crisp.nus.edu.sg) of the National University of Singapore. A total 485 SPOT
image on different days was examined, and 232 images with visible internal wave imagery were collected. Example's images of internal wave signatures observed by SAR and SPOT in the Lombok Strait area are shown in the Figures 5 and 6. The parameters relative to the ALOS PALSAR is shown in Table 1. The information relative to the SPOT images used in this study are listed in the Table 2.
b. Climatological Data
• Near-surface Wind Speed (WS) is retrieved using data observed by the Special Sensor Microwave Imager (SSM/I) on the Defense Meteorological Satellites Program (DMSP) and Sea Winds on the Quick Scatterometer (QuickSCAT) satellite are used (Wentz 1997, Dunbar et al., 2006).
• Sea Surface High Anomaly (SSHA) is
retrieved using data observed by the topography experiment/poseidon (T/P) and Jason are used. The information and parameters relative to the WS and SSHA data used in this study are listed in Table 3.
• Thermal stratification at the north and south of the Lombok Strait is retrieved using data output from the SODA
assimilation model
(http://iridl.ldeo.columbia.du/SOURCES/. CARTON-GIESE/.SODA/).
12th Biennial Conference of Pan Ocean Remote Sensing Conference (PORSEC 2014)
04 – 07 November 2014, Bali-Indonesia
758 c. Data Analysis of the Satellite Observed
Internal Waves Dependency on the External Boundary Condition
The previous study (Mitnik et al, 2000;
Susanto et al., 2005; Jackson, 2007; Karang et al., 2011) suggested that the mechanisms of internal wave activity associate with changing times and environmental conditions. In the present study, a data analysis of the internal wave occurrence and external boundary condition was performed to determine the relationship between internal wave parameter and external boundary condition. Seasonal internal wave occurrence and characteristic of internal wave propagation that classified in
two types (Mathews et al., 2011);
circularinternal wave and irregular internal wave are the main aspects of internal wave distribution evaluated in this study. These parameters can be monitored from the satellite images using SAR and visible sensors. A question arises how the dependency between satelliteobserved internal wave parameter and external boundary condition. To address this question, we calculated the relationship between internal wave occurrence with the SSHA and WS by using Pearson Correlation. The correlation coefficient (r) and significant value (p<0.05) are used to judge the quality of relationship.
3. RESULTS AND DISCUSSION
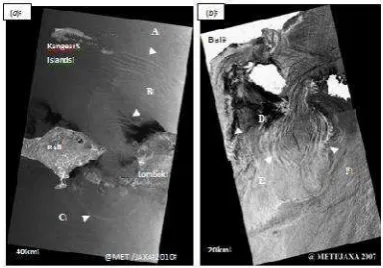
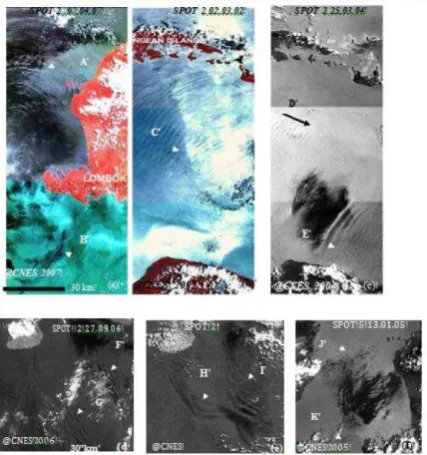
The well defined manifestations of internal waves observed by PALSAR and SPOT images data are depicted in Figures 5 (a)-(b) and 6(a)–(f). Figure 5 was acquired by the L-band, HH polarization PALSAR on board the Japanese ALOS satellite. Figure 6 was acquired by the optical sensor onboard the French SPOT satellites. All these images show packets of internal waves, which been tidally generated. This generation mechanism can be inferred from the number of packets that propagate to the northward. The distance between successive internal wave packets is related to the semi diurnal tidal period. The PALSAR image depicted in Figure 5 (a) show
a number internal wave packet propagating away from the sill. Three packets of internal waves are visible in the Lombok Strait area; two packets propagating north toward Kangean Islands and one packet propagating south toward the Indian Ocean. The separation of the solitary internal waves within these packets is about 78 km. Dark features (see Figure 5(a)-(b), Figure 6 (c)-(d), and Figure 6 (f) correspond to areas where the surface roughness is reduced due to the presence of surface active films both natural
(biogenic) damping the small-scale
roughness, or due to weak wind speeds or wave current interactions (Jackson & Apel,
2004).
Figure 5. (a) An example image that consists of circular-internal wave (A), (B), and (C) obtained from PALSAR ScanSAR Mode acquired on 29 August 2010. (b) An example image that consists of irregular features (D), (E), and (F) obtained from PALSAR Fine
Mode acquired on 09 October 2007
12th Biennial Conference of Pan Ocean Remote Sensing Conference (PORSEC 2014)
04 – 07 November 2014, Bali-Indonesia
759
surface wave spectrum, or the surface roughness, as well as the viewing geometry of the image determine the sun glitter radiance (Melsheimer and Kwoh,2001). However, the reflection from the sun is too strong causing no modulation of the sea surface roughness induced by the internal waves is detectable anymore. This can be seen on the right side of the image in the Figure 6 (b).
Figure 6. (a) A fragment (180 km x 60 km) of an SPOT
2 image showing circular- internal wave
propagating both northward (A) and the southward (B). (b) A fragment (180 km x 60 km) of an SPOT 2 image showing a packet of circular-internal wave (C). (c) A fragment (180 km x 60 km) of SPOT 2 image showing two packets of circular-internal wave (E) and (F). (d)
A fragment (60 km x 60 km) of an SPOT 2 image showing two packets irregular-internal wave (F) and (G). (e) A fragment (60 km x 60 km) of an SPOT 2 image showing two packets of irregular- internal wave (H) and (I). (f) A fragment (60 km x 60 km) of an SPOT 5 image showing embryo of circular- internal wave (J) and (K).
Circular and irregular shapes are common features of internal wave propagation for region interest (Mitnik et al, 2000; Susanto et al., 2005; Karang et al., 2011; Mathews et al.,
2011). The waves propagating northward into the Java Sea have always a quite regular circular shape while the ones propagating southward into the Indian Ocean have a very
irregular shape (Mitnik et al., 2000). The circular feature or Circular internal wave (see Figure 5(a), Figure 6(a)– (c), and Figure 3.2(f)) in the Lombok Strait is likely a soliton formed in the sill area by the succeeding tide. The irregular feature or irregular internal wave was first identified by Mitnik et al. (2000) in the region of the south of the Lombok Strait and linked by them to the presence of strong horizontal variations in the current field (Mathews et al., 2011). The following results (see Figure 5(b) and Figure 6(d)–(e)) shows that irregular internal waves also can be defined by SAR and optical sensors.
3.1 Statistical of Internal Wave
Occurrence
The dependence of the occurrence of internal wave signatures on the time of the year for the Lombok Strait area is depicted in Figure 7. The horizontal and vertical coordinate to denote the month and the statistical number of 322 internal wave by SAR and SPOT images, respectively. This plot shows that internal waves occurred within all months in a year by the maximum occurrence are found in late of south west monsoon from August to October. This is probably due to the strong current from north to the south occurred during south east monsoon. However, the low occurrence is distributed in June.
Figure 7. Monthly distribution of internal wave occurrence in the Lombok Strait area (1996– 2011)
12th Biennial Conference of Pan Ocean Remote Sensing Conference (PORSEC 2014)
04 – 07 November 2014, Bali-Indonesia
760
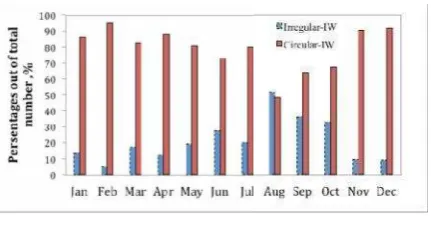
variability of internal wave type’s propagation
in the Lombok Strait area. The circular internal wave are frequently detected during the northwest monsoon (November– March) and transition period between monsoon (April-May) with a maximum frequency of 95%. The occurrence frequencies are slightly decreased in the southeast monsoon. In contrast, irregular internal wave activity frequently observed during the southeast monsoon. The high occurrence frequencies are distributed from August to October a reach a peak in August with a maximum frequency of 51.5%. The low occurrence frequencies are distributed in northwest monsoon from November to February with a minimum frequency of 5%. Other months appear to be transit periods.
Figure 8. Monthly distribution of internal wave types in the Lombok Strait area; circularinternal wave and irregular-internal wave. Frequency out of total number of internal waves observed
3.2 Statistical Analysis of External
Boundary Conditions for Internal Wave Multi Sensor Imaging
As mentioned above, the internal wave occurrence and distribution of their types shown in Figure 5 and 6 are derived from SAR and SPOT images. According to the SAR and visible imaging theories (Zheng et al., 2001a;
Hennings and Metzner, 1996), satellite observed internal wave occurrence can be affected by the magnitude of wind speed and dynamics of sea surface. However, the two conditions do not constitute immediate forcing to generate the waves (Zheng et al., 2007).
3.2.1 Sea Surface Height Anomaly (SSHA) Condition Statistics
The sea surface height anomaly (SSHA) data is the variability/anomaly of the sea surface height with mean sea state. Statistical distributions of monthly mean SSHA are derived from 10 years archived data maintained by remote sensing systems (REMSS) (ftp://.remss.com) (Swardika et al.,
2011). Statistical cells of 0.25o latitude by 0.25o longitude were used. We analyzed the
SSHA condition in both northern and southern part of Lombok Strait area. For the northern area, the cell centered at 7.5oS
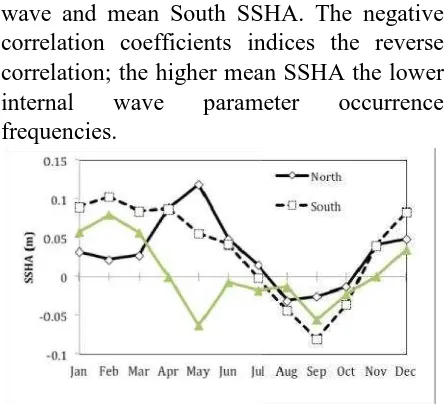
115.5oE is chosen. The cell centered at 9.5oS 116.25oE is chosen to represent the southern area. The statistical distribution of monthly SSHA mean is shown in Figure 9. One can see that, the monsoonal signal is clearly evident in sea surface height variability, particularly in the southern SSHA. During the northwest monsoon, the southern SSHA is higher than the northern SSHA; conditions are reversed during the southeast monsoon. Both the south and north SSHA have positive long term averages that indicate the asymmetry of the monsoon strengths; stronger winds occur in the northwest monsoon than compared to the southeast monsoon (Susanto et al., 2007). SSHA is more variable in the south compared to the north. This may be due to the larger expanse of open water on the southern Indian Ocean side compared to the internal Indonesian Seas of the northern side, where the presence of more islands and shallower coastal regions may reduce the wind strength. Interannual variability is also apparent in the SSHA variability (Susanto et al., 2007).
Based on statistical analysis, the results
showed both monthly internal wave
12th Biennial Conference of Pan Ocean Remote Sensing Conference (PORSEC 2014)
04 – 07 November 2014, Bali-Indonesia
761
wave and mean South SSHA. The negative correlation coefficients indices the reverse correlation; the higher mean SSHA the lower
internal wave parameter occurrence
frequencies.
Figure 9. Statistical distributions of monthly mean SSHA at the northern and southern areas of Lombok Strait. Statistical error means are less than 3%.
As external factors, however, the SSHA only decide the observable conditions; do not immediately generate the ocean internal waves. We have investigated the link between SSHA and thermocline depth variability in both northern and southern areas. Thermal stratification data is derived from the SODA assimilation model output. The SODA thermal data have a 0.5o longitude and by 0.5o latitude spatial resolution and we use the temperature data averaged within 8.25oS to 7.25oS and 115.25oE to 116.75oE. For the southern area, the temperature data averaged within 9.75oS to
8.75oS and 115.25oE to 116.75oE is used to represent the thermal stratification in the southern area. From the thermal stratification, the thermocline depth in the both area are determined. Thermocline depth is represented by the depth of the midthermocline 22oC
isotherm (Susanto et al., 2000). The variability of thermocline depth in the Lombok Strait is shown in Figure 10.
Figure 10 shows that there is seasonal variation of the thermocline depth in Lombok
Strait area. The seasonal thermocline
variability is stronger in southern than in northern part of Lombok Strait. One can see that out of phase relationship is found from
monthly distribution of thermocline depth to SSHA during the southeast monsoon. For the southern area, the shallow thermocline boundary is distributed from July to October with a shallowest boundary of 86 m in
September when SSHA is minimum.
However, shallow thermocline boundary in the northern area is distributed from March to May with shallowest boundary of 88 m in April. From these results, we can see that the peak of internal wave occurrence and shallow thermocline distribution occur at the same period. This result is consistent with Mityagina et al. (2010) in that internal waves generated during periods when the pycnocline/ thermocline profile very sharp and located at a shallow depth.
Table 4. Correlation Coefficient of the Satelliteobserved internal wave (IW) occurrence With the Monthly Mean Sea Surface High Anomaly
(SSHA)
Figure 10. Thermocline depth in the Lombok Strait area
3.2.2 Wind Condition Statistics
12th Biennial Conference of Pan Ocean Remote Sensing Conference (PORSEC 2014)
04 – 07 November 2014, Bali-Indonesia
762
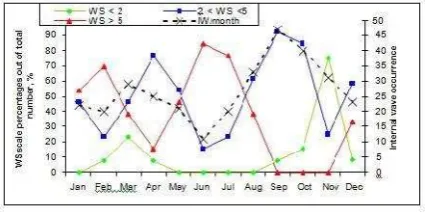
5.32 m s-1. In December or northwest monsoon, wind direction reverses and is north westernly with an average wind speed of 4.35 m s-1. Statistical distributions of monthly mean wind frequencies are derived from various satellites product (DMSP and QuickSCAT) to directly determine the role of the wind speed distribution in Lombok Strait area. Statistical cells of 0.25o latitude by 0.25o longitude were used. We used the wind speed data averaged within the box
9.75oS to 7.25oS and 115.25oE to 116.75oE. The results are shown in Figure 11. One can see the seasonal variability of wind scales. High frequencies of low wind speed (WS ≤5 m s-1) are distributed from August to October and reach a peak in September with a maximum freqency of 92.3%. The low frequencies are distributed in February, June, and July with a minumum frequency of 15.3%. The frequency distributions of high wind speed (WS >5 m s-1) are just antiphase with low wind speed. High frequencies are distributed from May to July with a maximum frequecy of 84.6% in June.
Figure 11. Statistical distributions of monthly mean wind scale frequencies in Lombok Strait area
The results of statistical analyses of relationship between internal wave parameters and wind speed distribution are shown in Table 3.2. One can see that, the highest correlation coefficient (0.758) and significant level p < 0.05 occur at wind speed 2 m s-1 ≤ WS≤ 5 m s-1, not at the lowest wind speed WS < 2 m s-1. The reason may be that at the lowest wind speed, there are no enough small waves generated on the sea surface (Zheng et al.,
2007). The negative correlation coeficients
mean that the process vary out of phase; that is, the higher wind speed the lower satellite observed internal wave occurences.
Table 5. Correlation coefficient of the satelliteobserved IW occurrence with the wind speed distribution
3.2.3 Dependence of Internal Wave Generation on the Phase of The Spring-Neap Tidal Cycle
The dependence of the occurrence of internal wave signatures on the phase of the spring-neap tidal cycle (period: 14 days) for the Lombok Strait area is depicted in Figure 3.8. The negative and positive value on horizontal axis denotes the date before and after spring tide, respectively. The images clearly show that around spring tide, internal wave generation is the highest, particularly one day before and after spring time. This confirmed to the previous research that the generation of internal waves in this area is influenced by tidal motion (Susanto et al,
2005).
Figure 12. Dependence of occurrence of internal waves on the phase of the spring-neap tidal cycle in the Lombok Strait
4. SUMMARY
12th Biennial Conference of Pan Ocean Remote Sensing Conference (PORSEC 2014)
04 – 07 November 2014, Bali-Indonesia
763
distribution of non linear internal waves in the Lombok Strait area. A survey of SAR and SPOT imagery acquired between January 1996 and December 2011 found 323 internal wave occurrences within a latitudinal band from 7.260 to 9.830S and a longitudinal band from 115.060 and 116.320E. The monthly internal wave occurrence shows that the high numbers of internal wave occurrence are distributed in southeast monsoon, August, September, and October, with a maximum number of 47 in September. The low occurrence of internal wave signatures is distributed in June. Because the visibility of internal waves on the satellite images depends on local environmental factors, there may be some external boundary conditions, such as wind speed and sea state, that will influence its appearance. The results show that seasonal variability of internal wave generation in the Lombok Strait has a good correlation with seasonal variation of
SSHA and wind speed by the maximum correlation coefficients (r) of -6.93 with a significant level (p < 0.05) and -8.37 with a significant level (p < 0.05) for SSHA and wind speed, respectively. The statistical test also shows that internal wave types (Circular internal wave and Irregular internal wave) has a good correlation with SSHA monthly for both of south and north area distribution of SSHA by the correlation coefficients (r) of 0.843 with a significant level (p < 0.05) and 0.611 with a significant level (p < 0.05) for both south and north SSHA, respectively. However, low correlation between internal wave types and wind speed distribution is found by the correlation coefficient (r) is less than 0.42 with significant level (p > 0.05) the relationship between the occurrence of internal waves and tidal motion are clearly seen, which is internal wave activity frequently observed around spring time, particularly one day after or before spring. Further dynamical analyses combined with in situ data are needed to clarify our investigations.
Acknowledgments
The authors would like to thank the JAXA, ERSDAC, and CRISP. We used the browser archives maintained by the ERSDAC and CRISP. This research was supported by the Beasiswa Unggulan, Bureau for Planning and International Cooperation, Ministry of National Education and Culture of the Republic of Indonesia.
References
Arief, D., 1992. Study on Low Frequency Variability In Current and Sea-Level in the Lombok Strait and Adjacent Region, Ph.D. dissertation, La. State Univ. Baton Rouge.
Arief, D., and S. P. Murray., 1996. Low Frequency Fluctuations in the Indonesian Throughflow Through Lombok Strait, J. Geophys. Res., 101, C5, 12,455-12,464. ARLINDO Mixing Report., 1999. A Study
of the Indonesian Seas Circulation and
Mixing. Available online on
http://www.ldeo.columbia.edu/res/fac/p h ysocean/proj_AM.html, accessed on 26 March 2012.
Atmadipoera, A., R. Molcard, G. Madec, S. E. Wijffels, J. Sprintal L., A.
Koch‐Larrouy, I. Jaya, and A.,
Supangat., 2009. Characteristics and
Variability of the Indonesian
Throughflow Water at the Outflow Straits, Deep Sea Res., Part I ,56(11), 1942–1954, doi:10.1016/j.dsr.2009. 06.004.
Chong, J. C., J. Sprintall, S. Hautala, W. L. Morawitz, N. A. Bray, and W. Pandoe., 2000. Shallow throughflow variability in the outflow straits of Indonesia, eophys. Res. Lett. 27, 1: pp. 125-128.
Dunbar , R.S., Lungu , T., Weiss, B., Stiles, B., Huddleston, J., Callahan, P.S., Shirtliffe ,G., Perry, K.L., Hsu, C., Mears, C.,
Wentz, F.and Smith, D., 2006.
12th Biennial Conference of Pan Ocean Remote Sensing Conference (PORSEC 2014)
04 – 07 November 2014, Bali-Indonesia
764
CA: NASA Jet Propulsion Laboratory). Ffield, A., and A. L. Gordon., 1996. Tidal
mixing signatures in the Indonesian Seas,
J. Phys. Oceanogr., 26, 1,924- 1,937.
Godfrey, J. S., 1996. The effect of the
Indonesian throughflow on ocean
circulation and heat exchange with the atmosphere: A review, J. Geophys.
Res.101, 12217-12238.
Gordon, A. L., 2005. Oceanography of the Indonesian Seas and their Throughflow,
Oceanography 18, 4, 14-27.
Hautala, S. L., J. Sprintall, J. T. Potemra, J. C. Chong, W. Pandoe, N. Bray, and A. G. Ilahude., 2001. Velocity structure and transport of the Indo-nesian Throughflow in the major straits restricting flow i nto t he Indian Ocean, J. Geophys. Res., 106(C9), 19,527 –
19,546.
Hennings, I and M. Metzner,, 1996. Sunglitter Radiance Modulation by Internal Waves, German Journal of Hydrography, 48:2, pp.121-132.
I Ketut Swardika, Tasuku Tanaka & Haruma Ishida., 2012. Study on the characteristics of the Indonesian Seas using satellite remote sensing data for 1998–2007,
International Journal of Remote Sensing, 33:8, 2378-2394.
Jackson, C. R., 2007. Internal wave detection using the Moderate Resolution Imaging Spectroradiometer (MODIS), J.
Geophys. Res., 112(C11012), 13.
Jackson, C. R., & Apel, J. R., 2004. Synthetic Aperture Radar (SAR) Marine
User’s Manual, NOAA NESDIS Office
of Research and Applications,
Washington DC.
Jaharuddin., 2004. ”Solitary Waves in
Lombok Strait and Morning Glory
Phenomena Numeric Simulation”, Ph.D
thesis, Institut Teknologi Bandung. Karang, I. W. G. A., Nishio, F., & Osawa, T.,
2010. Estimation of tidal energy
dissipation and vertical diffusivity in the Indonesian seas. Int. J. Remote Sens. Earth Sci., 7, 53-72.
Karang, I. W. G. A., Nishio, F., Mitnik, L & Osawa, T., 2011. Spatial-Temporal
Distribution and Characteristics of
Internal Waves in the Lombok Strait Area Studied by Alos-Palsar Images.
Earth Science Research., 1, 11-22. Karang, I. W. G. A., & Nishio, F., 2011.
Internal waves in the Lombok Strait revealed by ALOS PALSAR images. Proc. IEEE Intern Geosci.Remote Sensing Symp. IGARSS 2011.
Vancouver, Canada. pp. 253-256.
Korteweg, D.J. and de Vries, G., 1985. “On
the change of long waves advancing in a rectangular canal and a new type of long stationary waves”, Phil. Mag., 5, 422. Matthews, J. P., H. Aiki, S. Masuda, T. Awaji,
& Y. Ishikawa., 2011,
Monsoon regulation of Lombok Strait internal waves. J. Geophys. Res.,
116(C05007), 14.
Melsheimer, C., & Kwoh L. K., 2001. Sun Glitter in SPOT Images and the Visibility of Oceanic Phenomena.
Procced. 22nd Asian Conference on Remote Sensing, Singapore, Nov. 2001. Mitnik, L., W. Alpers, & H. Lim., 2000.
Thermal plumes and internal solitary waves generated in the Lombok Strait studied by ERS SAR. Pp. 1-9 in ERSEnvisat Symposium: Looking down to Earth in the New Millenium, 16-20 October 2000. Gothenburg, Sweden. SP461. European Space Agency, Publication Division, Noordwijk, The Netherlands.
Mityagina, M. I, O. Y. Lavrova, and S.S. Karimova., 2010, Multi-sensor survey of seasonal variability in coastal eddy and internal wave signatures in the north-eastern Black Sea, International J. of Remote Sensing, 31:17-18, 47794790. Miyama, T., T. Awaji, K. Akitomo, and N.
12th Biennial Conference of Pan Ocean Remote Sensing Conference (PORSEC 2014)
04 – 07 November 2014, Bali-Indonesia
765
transport variations in the Indonesian Seas, J. Geophys. Res. 100, 20517-2054. Murray, S.P., & D. Arief., 1988. Throughflow
into the Indian Ocean through the Lombok Strait, January 1985-January 1986. Nature, 333, 444-
447. http://dx.doi.org/10.1038/a0. Ningsih, N.S., Rachmayani, R. Hadi, S., &
Brodjonegoro, I.S., 2008. Internal waves dynamics in the Lombok Strait studied by numerical model. Int. J. Remote Sens. Earth Sci., 5, 17-33. Potemra, J. T. , S. L. Hautala, J. Sprintall, and
W. Pandoe., 2002. Interaction between the Indonesian Seas and the Indian Ocean in observations and numerical models, J. Phys. Oceanogr., 32(6), 1838 – 1854. Schiller, A., 2004. Effects of explicit tidal
forc ing in an OGCM on the water-mass structure and circulation in the Indonesian throughflow region, Ocean Modeling, 6, p.31–49.
Sprintall, J., S. E. Wijffels, R. Molcard, and I. Jaya., 2009. Direct estimates of the Indonesian throughflow entering the Indian Ocean: 2004-2006, J. Geophys.
Res., 114, C07001,
doi:10.1029/2008JC005257.
Sulaiman, A., 2004. Study of Internal Solitary Wave by Using Satellite Imagery and Mathematical Model. Proceedings of the Thirteenth
Workshop of OMISAR (WOM-13) on the Application and Networking of Satellite Data, Bali, Indonesia, 5 – 9 October 2004. Susanto, R. D., Mitnik, L., & Zheng, Q., 2005. Ocean Inte