OF Eucalyptus pellita IN INDONESIA
Budi Leksono1
ABSTRACT
The magnitude of the genotype-environment interaction (GEI) in seven six years old seedling seed orchards of Eucalyptus pellita established at three locations in Indonesia was examined by analyzing height and diameter. The seed orchard at each location consists of 121 families from three provenances of Papua New Guinea. The pooled sum of squares derived from analysis of variance of growth of the three provenances was used to estimate genetic parameters. These parameters were then used to calculate genetic gain as a result of both direct and indirect selections. The GEI across the three locations was very strong, while the results of pair-wise site analysis varied between the pairs of locations. The genetic correlations for pairs of locations were moderately high between South Sumatra and Riau; 0.68 for dbh and 0.85 for height, but were lower between South Kalimantan and the other locations (0.32 to 0.56). The gains resulting from direct selection were apparently greater than those resulting from indirect selection. The genetic gains achieved in South Sumatra and Riau would decrease by 24% as a result of transfer to other sites, while transfer from South Kalimantan to Sumatra Island (and vice versa) would reduce in the genetic gain by 60%. Hence, the breeding population in South Kalimantan should be developed separately from those in South Sumatra and Riau.
Keywords: Breeding population, direct and indirect selection, Eucalyptus pellita, genetic correlation, genetic gain
I. INTRODUCTION
The concept of genotype-environment interaction, or GEI, has been defi ned as the variation in relative performance of genotypes with environment (Burdon, 1977). The effects of GEI complicate tree breeding programs and may reduce the rate of genetic progress by selection. Heterogeneity among forest sites, due to variations in soil and/or climatic conditions, may cause GEI (Gwaze et al., 2001). Therefore, the magnitude of the GEI will affect the decisions on testing, selection and deployment. GEI has been studied for various pine species, including: Pinus radiata (Pederick, 1990; Johnson, 1992), P. caribaea (Woolaston et al., 1991), P. elliotii (Pswarayi et al., 1997) and P. taeda (Gwaze et al., 2001). The results of genetic correlation analysis suggest that the greatest gains are almost always result from selecting and replanting at the same site. However, the genetic loss as a result of selecting and planting
1 Center for Forest Biotechnology and Tree Improvement Research, Jl. Palagan Tentara Pelajar Km.
at different sites is generally small enough to suggest that selecting for general adaptations (using selections adapted to a wide range of sites) is a better strategy than regionalizing breeding operations (separate breeding populations or seed orchards, each focusing on “locally” adapted selections). However, if GEI is found to be important, two approaches can be applied: the breeding can focus on either the environments or the genotypes. The fi rst alternative aims to determine groups of environments within which GEI approaches zero; it thus aims to maximize the accuracy of selection and the precision of the estimated genetic parameters. In the second approach, genotypes may be classifi ed as stable or unstable and the latter removed from the breeding population, thus greatly reducing GEI (Raymond and Lindgren, 1990). Therefore, the breeder has to decide between a number of approaches for choosing source populations and selection zones for planting.
II. MATERIALS AND METHODS
A. Seedling Seed Orchard
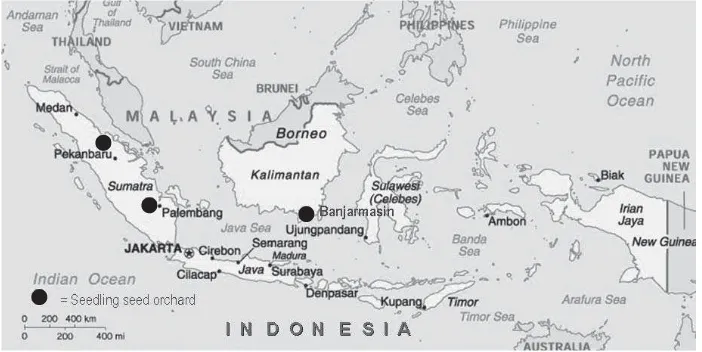
Data used in this study were obtained from seedling seed orchards of E. pellita in Indonesia: one location in South Kalimantan containing a single seed orchard and two locations in South Sumatra and Riau established in January 1995 and March 1996, respectively (Figure 1). At each of the sites in Sumatra there were three seed orchards, each with genetic materials derived from three different provenances in Papua New Guinea: South Kiriwo, North Kiriwo and Serissa Village. The seed orchard in South Kalimantan was established in January 1994, and the three provenances were established as a mixed population.
The layout of the seed orchards at the three locations was randomized complete
blocks. The number of families of South Kiriwo, North Kiriwo and Serissa Village
provenances were 48, 39 and 34, respectively. Families were usually represented by
initially planting fi ve trees in a row plot, with 10 replicates in South Kalimantan
and Riau, and 12 replicates in South Sumatra. In all cases spacing was 4 x 1.5 m. Site
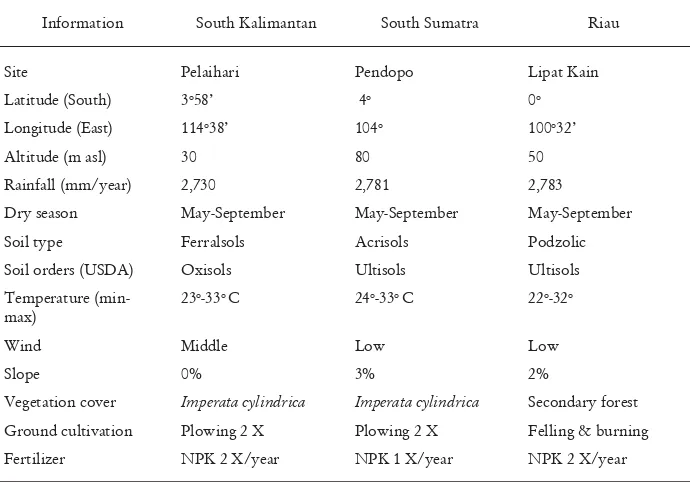
characteristics for the three locations are presented in Table 1.
Height and diameter were measured when the seed orchards were six years old. Prior to the measurements selections within family-plot based on growth and stem form criteria were conducted three times until the best tree in each plot remained. The data from the single retained tree in each plot were used in the analysis.
Table 1. Site characteristics of the seedling seed orchards of E. pellita at the three locations
Information South Kalimantan South Sumatra Riau
Site Pelaihari Pendopo Lipat Kain
Latitude (South) 3o58’ 4o 0o
Longitude (East) 114o38’ 104o 100o32’
Altitude (m asl) 30 80 50
Rainfall (mm/year) 2,730 2,781 2,783
Dry season May-September May-September May-September
Soil type Ferralsols Acrisols Podzolic
Soil orders (USDA) Oxisols Ultisols Ultisols
Temperature (min-max)
23o-33o C 24o-33o C 22o-32o
Wind Middle Low Low
Slope 0% 3% 2%
Vegetation cover Imperata cylindrica Imperata cylindrica Secondary forest
Ground cultivation Plowing 2 X Plowing 2 X Felling & burning
Fertilizer NPK 2 X/year NPK 1 X/year NPK 2 X/year
B. Data Analysis
Analysis of variance was undertaken using the individual tree data for height and diameter (dbh) in each seed orchard, using the linear model:
Yij = μ + Ri + Fj + εijk ...(1)
where, Yijis the individual tree data in the i-th replicate of the j-th family; μ is the overall mean; Ri, Fj and εijk are, respectively, the i-th replicate effect, the j-th family effect, and the error for Yij. The variance components at each location were estimated by pooling the sums of squares and the degrees of freedom for the three populations of seed orchard; and then comparing the respective pooled mean squares with their expected values. The pooled estimates were used to estimate genetic parameters (Woolaston et al., 1990). The individual tree heritability (hi2) was calculated using the
following formula (Williams and Matheson, 1994): hi2 = 2.5 σ2
f / [σ 2
f + σ 2
e ] ...(2) where, σf2and σ
e
2 are estimates of the variance component for family and error,
The cross-location data set was analyzed to estimate variance components for families and for the family-location interaction (GEI) and then to calculate genetic correlations between pairs of locations, using the following linear model:
Yijk = μ + Si + Rj(Si) + Fk + FSik + εijk ...(3)
where, Yijk is the j-th replication within the i-th site and the k-th family; μ and Si are the overall mean and the i-th site effect; respectively; Rj(Si), Fk,FSik and
ε
ijk, respectively, are the j-th replicate effect in the i-th site, the k-th family effect, the interaction of the i-th site and k-th family, and the error for Yijk. The variance components across-locations were also calculated by pooling the estimates for the three populations of the seed orchards.A ratio of the variance components was calculated between the family-site interactions (GEI) and the family variance components (
σ
2sf/
σ
2f).
Shelbourne (1972) suggested that the effects of GEI are “likely to be serious on gains from selection and testing” when the GEI component reaches 50% or more of the family variance component.The genetic correlation between locations x and y for the same trait [
r
g(xy)] was calculated using the following formula (Yamada, 1962; Burdon, 1977):rg (xy) = σ2 f / [σ
2 f + σ
2
fs ] ...(4) where, σf2and σfs2 are estimates of the variance component for family and family-site interaction across pairs locations, respectively.
The predicted genetic gain by indirect selection between two locations (Δgi) and by direct selection at a single location (Δgd) were calculated using the following formula (Falconer and Mackay, 1996; Burdon, 1977):
∆gi = ix .hx . hy .rgxy .σPy ...(5)
∆gd = iy . hy2 .σ
Py ...(6) where, ix and iy are selection intensity, i was assumed to be 1.0 for ease of calculation; hx and hy are the square root of heritability at locations x and y, respectively; and σPy is the phenotypic standard deviation of family means at location y.
III. RESULTS AND DISCUSSION
A. Genetic Parameter Estimation
genetic gain for the three locations cannot be optimal when selection is based on data from a single environment. This is because GEI reduces heritability and hence genetic gain. It is, therefore, necessary to create and maintain separate breeding populations (Barnes et.al., 1984).
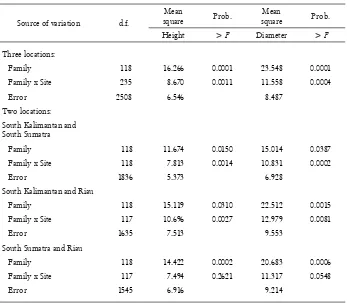
Table 2. Means squares for height and diameter from the ANOVA across locations
Source of variation d.f.
Mean
square Prob.
Mean
square Prob.
Height > F Diameter > F
Three locations:
Family 118 16.266 0.0001 23.548 0.0001
Family x Site 235 8.670 0.0011 11.558 0.0004
Error 2508 6.546 8.487
Two locations:
South Kalimantan and South Sumatra
Family 118 11.674 0.0150 15.014 0.0387
Family x Site 118 7.813 0.0014 10.831 0.0002
Error 1836 5.373 6.928
South Kalimantan and Riau
Family 118 15.119 0.0310 22.512 0.0015
Family x Site 117 10.696 0.0027 12.979 0.0081
Error 1635 7.513 9.553
South Sumatra and Riau
Family 118 14.422 0.0002 20.683 0.0006
Family x Site 117 7.494 0.2621 11.317 0.0548
Error 1545 6.916 9.214
In order to examine the differences in GEI between the three locations, pairwise site analysis were conducted. These show very clear differences in GEI between the pairs of locations. The GEI is highly signifi cant between South Kalimantan and the other locations (South Sumatra and Riau), but is not signifi cant between South Sumatra and Riau (Table 2). These fi ndings are consistent with ratios of GEI to family variance components (σ2
fs/σ 2
f), which, for both traits, is high between South
these seed orchards are likely to be of practical importance in selection and testing (Shelbourne, 1972).
Table 3. Variance components across locations and genetic correlation between pairs of locations for height and diameter [rg (xy)]
Across locations/Trait
Variance component Genetic
Family (σf2) Interaction
(σsf2)
Ratio (σsf2
/ σf2)
correlation [rg (xy)] Three locations
Height 0.306 0.269 0.880
Diameter 0.484 0.389 0.804
Two locations: South Kalimantan and South Sumatra
Height 0.211 0.287 1.362 0.423
Diameter 0.224 0.459 2.051 0.328
South Kalimantan and Riau
Height 0.260 0.420 1.614 0.383
Diameter 0.581 0.452 0.777 0.563
South Sumatra and Riau
Height 0.456 0.080 0.175 0.851
Diameter 0.608 0.291 0.478 0.677
rg (xy) was calculated using Eq. 4
are in the same order as the Ultisols, they are red to yellow in color and quite acidic, often with a pH of less than 5. In contrast, the Ferralsols in South Kalimantan are classifi ed as Oxisols, best known for their occurrence in tropical rain forests, and they have a red or yellowish color due to the high concentration of iron (III) and aluminum oxides, and hydroxides (Buol et al., 2003). This observation concurs with Shelbourne (1972) and Zobel and Talbert (1984), who suggested that, although there are many causes of GEI, in general they are generally more closely related to edaphic factors than to climatic factors.
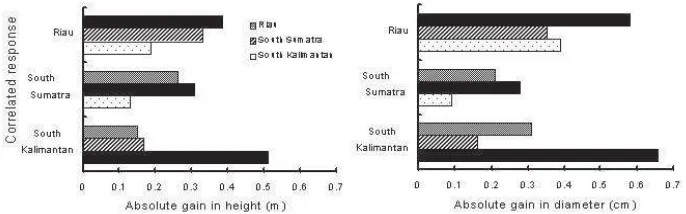
B. Predicted Genetic Gains and Practical Implication
The genetic gains from indirect selection predicted by Eq. (5) and direct selection, Eq. (6), comparing pairs of locations, are shown in Table 4 and Figure 2. The predicted genetic gain at each location is the result of direct selection, and those of the correlated response when it is applied at other locations are indirect selections. The genetic gains by direct selection appeared to be greater than those associated with indirect selection. With respect to direct selection, the genetic gains for diameter and height in South Kalimantan were 13-32% greater than those in Riau, and 64-137% greater than those in South Sumatra. The differences in the genetic gains for both traits may be due to the higher heritability in South Kalimantan than that at the other locations (Table 4). Except in South Sumatra, the genetic gains for diameter were greater than for height.
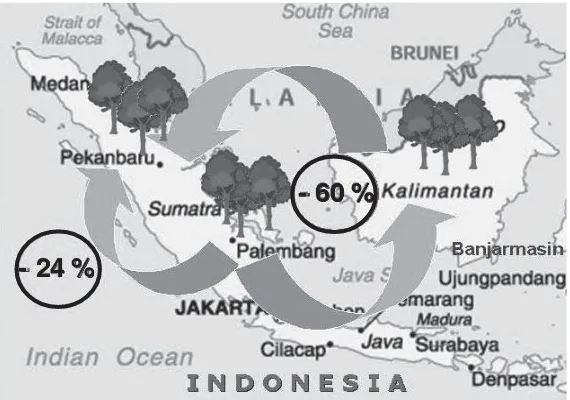
The relative ratios of genetic gains, comparing indirect selection with direct selection, were 76% between South Sumatra and Riau. In contrast, the average ratio between South Kalimantan and the other locations was 40% (Table 4). Thus, the genetic gains obtained by direct selection in South Kalimantan would be reduced by 60% if the selected entries were transferred to the other locations, and vice versa, while the reductions in genetic gain resulting from such transfers between South Sumatra and Riau would be only 24% (Figure 3).
Table 4. Expected gain and ratio of gain by selection between pairs of locations
Correlated response
Phenotypic SD (σp)
Herita bility
(hi2)
Selection
South
Kalimantan South Sumatra Riau
Height:
South Kalimantan 2.297 0.22 0.510 (100.0) 0.169 (33.21) 0.152 (29.87)
South Sumatra 2.267 0.14 0.131 (42.35) 0.310 (100.0) 0.262 (84.71)
Riau 2.851 0.14 0.189 (49.01) 0.330 (85.50) 0.386 (100.0) Diameter:
South Kalimantan 2.739 0.24 0.658 (100.0) 0.162 (24.59) 0.310 (47.18)
South Sumatra 2.048 0.14 0.091 (33.76) 0.277 (100.0) 0.209 (75.58)
Riau 3.437 0.17 0.389 (67.13) 0.351 (60.59) 0.580 (100.0)
Note: hi2 (individual heritability) was calculated using Eq. 2, Absolute gains were calculated
using Eqs. 5 and 6, Gain predictions by direct selection at the location (∆gd) are underlined and ratios of gains by indirect selection (%) are given in parentheses.
- 24 %
- 60 %
Figure 3. Seed transfer and reduction of genetic gain by selection between pairs of locations
1992; Pswarayi et al., 1997; Gwaze et al., 2001). Such results suggest that selection for generally adapted populations is possible for these species, without incurring any signifi cant losses in genetic gain. However, the results from the current study identifi ed very strong GEI, both when comparing the three sites together and as pairs (Table 2). Moreover, the effects of GEI from the pair-wise site analysis predicted a serious loss of genetic gain if the seeds from Kalimantan orchard were transferred to Sumatra and vice versa (Table 4). These fi ndings suggested that the genetic gains could be maximized by breeding within regions or by grouping locations with similar environments; a ratio between GEI and family components lower than 0.5 would be appropriate within such group. This would provide a better approach to choosing source populations and selecting planting zones.
Although, several private companies concerns are undertaking tree improvement programs for E. pellita in Indonesia, they do not collaborate and each has a limited range of testing sites. Thus, the expected gains at other locations have not yet been confi rmed. However, the plantation establishment program in Indonesia is being conducted at national scale, focusing particularly on Sumatra and Kalimantan, so the results reported herein could be applied in the form of guidelines to control seed transfer for E. pellita, thus minimizing the loss of genetic gain due to GEI.
IV. CONCLUSION
The magnitude of GEI in the seedling seed orchards of E. pellita, indicated by the ratio of variance components between GEI and family, and genetic correlations between pairs of locations suggests that the effect of GEI is of practical importance when the results of selections are used on other islands. Calculated losses in genetic gain as a result of inter-island transfer (from Kalimantan to Sumatra and vice versa) were generally high; reductions of approximately 60%. In contrast, the loss of genetic gains resulting from transfer on a single island, Sumatra, was only 24%. Therefore, to maximize the effi ciency of selection between different locations and to minimize losses in genetic gain, the breeding population in South Kalimantan should be developed separately from those in South Sumatra and Riau.
ACKNOWLEDGEMENT
REFERENCES
Barnes, R.D., J. Burley, G.L. Gibson and J.P. Garcia de Leon. 1984. Genotype-environment interactions in tropical pines and their effects on the structure of breeding populations. Silvae Genetica 33: 186-198.
Buol, S.W., R.S. Southard, R.C. Graham, and P.A. Mc.Daniel. 2003. Soil genesis and classifi cation (5th ed.). The Iowa State University Press, Ames. 494p.
Burdon, R.D. 1977. Genetic correlation as a concept for studying genotype-environment interaction in forest tree breeding. Silvae Genetica 26: 168-175. Falconer, D.S. and T.F.C. Mackay. 1996. Introduction to quantitative genetics (4th
ed.) Longman Group, England. 480p.
Gwaze, D.P., J.A. Wolliams, P.J. Kanowski and F.E. Bridgwater. 2001. Interaction of genotype with site for height and stem straightness in Pinus taeda in Zimbabwe. Silvae Genetica 50: 135-140.
Harwood, C.E., D. Alloysius, P.C. Pomroy, K.W. Robson and M.W. Haines. 1997. Early growth and survival of E. pellita provenances in a range of tropical environment, compared with E. grandis, E. urophylla and A. mangium. New Forest 14: 203-219.
Johnson, G.R. 1992. Family-site interaction in Radiata pine families in New South Wales. Silvae Genetica 41: 55-62.
Pederick, L.A. 1990. Family-site interactions in Pinus radiata in Victoria, Australia and implications for breeding strategy. Silvae Genetica 39: 134-140.
Pswarayi, I.Z., R.D. Barnes, J.S. Birks and P.J. Kanowski. 1997. Genotype-environment interaction in a population of Pinus elliotii Engelm. var elliotii. Silvae Genetica 46: 35-40.
Raymond, C.A. and D. Lindgren. 1990. Genetic fl exibility-A model for determining the range of suitable environments for a seed source. Silvae Genetica 39: 112-120.
Shelbourne, C.J.A. 1972. Genotype-environment interaction: Its study and its implications in forest tree improvement. Proc. IUFRO Genetics-SABRAO Joint Symposia, Tokyo, 1972.
Williams, E.R. and A.C. Matheson. 1994. Experimental design and analysis for use in tree improvement. CSIRO Information Service, Victoria, Australia. Woolaston, R.R., P.J. Kanowski and D.G. Nikles. 1991. Genotype-environment
interaction in Pinus caribaea var hondurensis in Queensland, Australia. Silvae Genetica 40: 224-232.
Yamada, Y. 1962. Genotype by environment interaction and genetic correlation of the same trait under different environment. Genetics 37: 498-509.
![Table 3. Variance components across locations and genetic correlation between pairs of locations for height and diameter [r]](https://thumb-ap.123doks.com/thumbv2/123dok/2460059.1271049/7.468.50.397.158.407/table-variance-components-locations-genetic-correlation-locations-diameter.webp)