1
w w w . m a i p a r k . c o m
LAPORAN
STATISTIK
ASURANSI
Gempa Bumi
Indonesia
Per 31 Desember 2011
Indonesian Earthquake Insurance Statistic
As at 31 December 2011
i
Dengan Hormat,
Sesuai dengan tujuan pendirian MAIPARK,
MAIPARK selalu berupaya untuk memberikan
pelayanan yang terbaik bagi Industri Asuransi
Umum di Indonesia khususnya mengenai
statistik dan pengetahuan risiko gempa bumi.
Dukungan dari seluruh perusahaan asuransi
umum sangat berarti bagi kami dalam upaya
pengembangan Laporan Statistik ini.
Kami berharap Laporan Statistik ini dapat
memberikan manfaat tidak hanya bagi
perusahaan yang menangani asuransi gempa
bumi, namun juga bagi industri asuransi umum
di Indonesia.
Hormat kami,
Dear Sir / Madam,
In line with the purpose of MAIPARK
establishment, MAIPARK always strive to
provide the best service for General Insurance
Industry in Indonesia particularly regarding
statistic and knowledge of Earthquake risks.
Support from the General Insurance Industry
will be meaningful to us in order to improve this
Statistic Report.
We hope this Statistic Report will be beneficial
not only to the insurance companies which
write earthquake insurance but also to the
whole general insurance industry in Indonesia.
Sincerely,
Kata Pengantar
Foreword
ii
Hal.
Kata Pengantar ... i
Daftar Isi ………. ……….ii
Informasi Statistik ... v
Ikhtisar Statistik Asuransi Gempa Bumi
Indonesia Desember 2011 ...
A. Umum ... 1
B. Struktur Pasar ... 1
C. Premi Bruto ... 1
D. Jumlah Risiko ... 4
E. Incurred Claim ... 6
Exposure Asuransi Gempa Bumi Indonesia ...
Tabel 2.1. Exposure Per Cresta Zone ... 9
Tabel 2.2. Exposure Per Okupasi ... 11
Tabel 2.3. Exposure Per Interest ... 13
Tabel 2.4. Exposure Per Provinsi ... 15
Premi Bruto Asuransi Gempa Bumi Indonesia
... ….
Tabel 3.1. Gross Premium Per Cresta Zone ... 16
Tabel 3.2. Gross Premium Per Okupasi ... 18
Tabel 3.3. Gross Premium Per Provinsi ... 20
Jumlah Risiko Asuransi Gempa Bumi
Indonesia ...
Tabel 4.1. Jumlah Risiko Per Cresta Zone ... 21
Tabel 4.2. Jumlah Risiko Per Okupasi ... 23
Klaim Asuransi Gempa Bumi Indonesia ...
Tabel 5.1. Klaim Frekwensi Per Okupasi ... 25
Tabel 5.2. Klaim Frekwensi Per Cresta Zone ... 27
Tabel 5.3. Klaim Per Okupasi ... 29
Tabel 5.4. Klaim Per Cresta Zone ... 31
Page
Foreword ... i
Contents ………. ……….ii
Statistic Information ... v
Statistic Overview of Indonesian Earthquake
Insurance December 2011 ...
A. General ... 1
B. Market Structure ... 1
C. Gross Premium ... 1
D. Number of Risk ... 4
E. Incurred Claim ... 6
Indonesian Earthquake Insurance Exposure ...
Table 2.1. Exposure By Cresta Zone ... 9
Table 2.2. Exposure By Occupation ... 11
Table 2.3. Exposure By Interest ... 13
Table 2.4. Exposure By Province ... 15
Indonesian Earthquake Insurance Gross
Premium ...
Table 3.1. Gross Premium By Cresta Zone ... 16
Table 3.2. Gross Premium By Occupation ... 18
Table 3.3. Gross Premium By Province ... 20
Indonesian Earthquake Insurance Number of
Risks ...
Table 4.1. Number of Risk By Cresta Zone ... 21
Table 4.2. Number of Risk By Occupation ... 23
Indonesian Earthquake Insurance Claim ...
Table 5.1. Claim Frequency By Occupation ... 25
Table 5.2. Claim Frequency By Cresta Zone ... 27
Table 5.3. Claim By Occupation . ... 29
Table 5.4. Claim By Cresta Zone ... 31
Daftar Isi
iii
Profil Risiko dan Klaim ...
Underwriting Year
2007 -2011,
Seluruh Okupasi ... 33
Underwriting Year
2011, Seluruh Okupasi ... 34
Underwriting Year
2010, Seluruh Okupasi ... 35
Underwriting Year
2009, Seluruh Okupasi ... 36
Underwriting Year
2008, Seluruh Okupasi ... 37
Underwriting Year
2007, Seluruh Okupasi ... 38
Profil Risiko dan Klaim
Underwriting Year
2011 Per Okupasi ...
Okupasi Agrikultural ... 39
Okupasi Komersial ... 40
Okupasi Industrial ... 41
Okupasi Residensial ... 42
Profil Risiko dan Klaim
Underwriting Year
2010 Per Okupasi ...
Okupasi Agrikultural ... 43
Okupasi Komersial ... 44
Okupasi Industrial ... 45
Okupasi Residensial ... 46
Profil Risiko dan Klaim
Underwriting Year
2009 Per Okupasi ...
Okupasi Agrikultural ... 47
Okupasi Komersial ... 48
Okupasi Industrial ... 49
Okupasi Residensial ... 50
Profil Risiko dan Klaim
Underwriting Year
2008 Per Okupasi ...
Okupasi Agrikultural ... 51
Okupasi Komersial ... 52
Okupasi Industrial ... 53
Okupasi Residensial ... 54
Risk and Loss Profile ...
Underwriting Year 2007 -2011,
All Occupation ... 33
Underwriting Year 2011, All Occupation ... 34
Underwriting Year 2010, All Occupation ... 35
Underwriting Year 2009, All Occupation ... 36
Underwriting Year 2008, All Occupation ... 37
Underwriting Year 2007, All Occupation ... 38
Risk and Loss Profile Underwriting Year
2011 By Occupation
….
...
Agricultural Occupation ... 39
Commercial Occupation ... 40
Industrial Occupation ... 41
Residential Occupation ... 42
Risk and Loss Profile Underwriting Year
2010 By Occupation
….
...
Agricultural Occupation ... 43
Commercial Occupation ... 44
Industrial Occupation ... 45
Residential Occupation ... 46
Risk and Loss Profile Underwriting Year
2009 By Occupation
….
...
Agricultural Occupation ... 47
Commercial Occupation ... 48
Industrial Occupation ... 49
Residential Occupation ... 50
Risk and Loss Profile Underwriting Year
2008 By Occupation
….
...
Agricultural Occupation ... 51
Commercial Occupation ... 52
Industrial Occupation ... 53
iv
Profil Risiko dan Klaim
Underwriting Year
2007 Per Okupasi ...
Okupasi Agrikultural ... 55
Okupasi Komersial ... 56
Okupasi Industrial ... 57
Okupasi Residential ... 58
Peta
Distribusi Exposure Gempa Bumi Indonesia per
Provinsi,
Underwriting Year
2011, per 31
Desember 2011
……..
... 59
Distribusi Gempa Bumi Indonesia M > 5 dan
Claim
Incurred
2011
……
... 60
Distribusi Exposure Gempa Bumi Indonesia per
Provinsi,
Underwriting Year
2011, per 31
Desember 2011, Distribusi Gempa Bumi Indonesia
M > 5 dan
Claim Incurred
UY 2011
……….
61
Distribusi Gempa Bumi Indonesia
………
... 62
Lampiran
1.
Daftar Istilah ... 64
2.
Tarif Asuransi Gempa Bumi Indonesia
….
... 66
3.
Skala
First Loss
... 67
4.
Tabel jangka Waktu Pertanggungan
Kurang Dari Satu Tahun ... 68
5.
Tabel Indemnitas ... 69
Referensi
1.
Badan Pengawas Pasar Modal dan
Lembaga Keuangan (Bapepam-LK)
2.
Asosiasi Asuransi Umum Indonesia
(AAUI)
3.
Biro Pusat Statistik (BPS)
Risk and Loss Profile Underwriting Year
2007 By Occupation ...
Agricultural Occupation ... 55
Commercial Occupation ... 56
Industrial Occupation ... 57
Residential Occupation ... 58
Map
Indonesian Earthquake Exposure Distribution By
Province, Underwriting Year 2011, as at 31
December 2011.. ... 59
Indonesian Earthquake Distribution M > 5 and
C
lai I curred
………
..
…
.. ... 60
Indonesian Earthquake Exposure Distribution By
Province, Underwriting Year 2011, as at 31
December 2011 , Indonesian Earthquake
Distribution M > 5 and Claim Incurred 2011 ... 61
Indonesian Earthquake Distribution
... 62
Attachments
1.
Glossaries ... 64
2.
Indonesian Earthquake Insurance
Tariff ... 66
3.
First Loss Scale ... 67
4.
Short Period Table Less Than One Year
Period ... 68
5.
Indemnity Table ... 69
Refference
1.
Capital Market and Financial Institution
Supervisory Agency (Bapepam-LK)
2.
General Insurance Association of
Indonesia (AAUI)
v
1.
Statistik dibuat berdasarkan
Underwriting
Year
yang tercatat sampai dengan posisi
31 Desember 2011.
2.
Sesi Limit
2.1.
Limit Sesi atas setiap risiko (
any
one risk
) untuk gabungan kerugian
fisik dan gangguan usaha adalah
sebagai berikut :
2.1.1 Untuk daerah Jawa Barat,
Banten dan DKI : 5%
(lima prosen) dari jumlah
seluruh
pertanggungan
(
total
sum
insured
)
maksimum
USD
2,500,000.00 (dua juta
lima ratus ribu Dollar
Amerika)
atas
setiap
risiko, setiap perusahaan
asuransi atau penerbit
polis.
2.1.2 Untuk daerah Indonesia
lainnya 25% (dua puluh
lima prosen) dari jumlah
seluruh
pertanggungan
(
total
sum
insured
)
maksimum
USD
2,500,000.00 (dua juta
lima ratus ribu Dollar
Amerika) atas setiap risiko
setiap perusahaan
asuransi atau penerbit
polis.
2.2.
Yang dimaksud dengan setiap
risiko
(
anyone
risk
)
adalah
akumulasi
(
aggregate
)
jumlah
harga
pertanggungan
seluruh
risiko pada lokasi yang sama untuk
masing-masing
perusahaan
asuransi. Definisi setiap risiko atau
setiap lokasi ditentukan oleh
1.
Statistic
Report
is
based
on
Underwriting Year basis, which is
recorded as at 31 December 2011.
2.
Cession Limit
2.1.
Cession Limit of any one risk for the
combined material damage and
business interruption are as follows
:
Dollars) for any one risk, each
insurance company or policy
issuer
2.1.2. For other Indonesia areas are
25% (twenty five percent) of
total sum insured, maximum
of USD 2,500,000.00 (two
million five hundred thousand
U.S USD 2,500,000.00 (two
million five hundred thousand
U.S. Dollars) for each risk,
each insurance company or
policy issuer.
2.2.
Anyone risk is the accumulation
the fire underwriting policy.
vi
perusahaan
asuransi
dalam
underwriting
polis kebakaran.
2.3
Dalam hal penutupan secara
First
Loss Basis / Sub-limit
, jumlah yang
disesikan
sebagaimana
diatur
dalam butir 2.1 diatas, dikalikan
prosentase
First Loss Scale
.
2.4
Untuk risiko yang ditutup secara
ko-asuransi, jumlah maksimum
sesi dari semua anggota
ko-asuransi adalah sesuai dengan
ketentuan yang diatur dalam 2.1
diatas.
Sesi
masing-masing
perusahaan adalah proporsional
sebanding sahamnya dalam
ko-asuransi.
Dalam hal terdapat penutupan lain
selain polis ko-asuransi tersebut
pada obyek pertanggungan yang
sama, perusahaan asuransi tetap
dapat mensesikan risiko dimaksud,
dengan catatan jumlah seluruh
sesi
perusahaan
asuransi
bersangkutan
tidak
melebihi
ketentuan yang diatur pada butir
mengaplikasikan
Tarif
Premi
Standar Gempa Bumi Indonesia
(lampiran 2)
3.2. Penutupan
First Loss / Sub Limit
Basis
mengaplikasikan standar
First Loss Scale
(lampiran 3)
3.3. Perhitungan
premi
untuk
penutupan kurang dari 12 (dua
belas) bulan diberlakukan skala
premi jangka pendek (lampiran 4)
3.4. Untuk perhitungan
premi Business
Interruption
diberlakukan
Indemnity
Period Scale
(lampiran 5)
2.3
In First Loss Basis / Sub Limit
policies, the amount ceded is
stipulated in point 2.1 above, then
multiplied by the percentage of First
Loss Scale.
2.4
For risks which are covered by
co-insurance,
the
maximum
cession from all members of
coinsurance is stipulated in point
2.1 above. Each ceding company
cedes proportionally depending on
its co-insurance share.
If there are policies other than
co-insurance policy on the same
insured object, the insurer is still
able to cede such risk subject to
t
otal insurance company’s
cession
not exceeding the provision in
point 2.1
3.
Indonesian
Standard
Earthquake
Premium Tariff
3.1.
For the coverage of Full Value
Basis, apply Indonesian Standard
Earthquake
Premium
Tariff
(attachment 2).
3.2.
For the First Loss / Sub Limit Basis
coverage apply standard First Loss
Scale (attachment 3).
3.3.
Premium calculation for short
period coverage is based on Short
Period Scale (attachment 4).
vii
4.
Obyek Pertanggungan
4.1 Obyek pertanggungan yang dapat
disesikan
adalah
obyek
pertanggungan
asuransi
kebakaran berupa :
4.1.1. Kerusakan Fisik :
Bangunan
Pondasi
Penggalian dan
Sejenisnya
Persediaan Barang
Lain-lain
4.1.2 Gangguan Usaha :
Keuntungan Bruto
Upah
Kenaikan
Biaya
Operasional
Lain-lain
4.2 Penutupan
sebagaimana
dimaksud pada butir 4.1. adalah
yang ditutup secara langsung
(
direct business
) termasuk
ko-asuransi.
Penutupan
tidak
langsung (
indirect business /
r
easuransi) tidak dapat disesikan.
5.
Pelaporan Bordero
Pelaporan bordero dilakukan setiap
bulannya untuk semua risiko yang
ditutup pada bulan yang bersangkutan
dan sudah harus diterima
selambat-lambatnya pada akhir bulan berikutnya.
4.
Insured Object
4.1.
Insured object which can be ceded
is fire insurance object such as :
4.1.1.
Material damage :
Building
Foundation
Excavation and
the like
Stock
Others
4.1.2.
Business Interruption
Gross Profit
Wages
Increase in cost of
working
Others
4.2.
Insured object referred in point 4.1
is
direct
business,
including
coinsurance. Indirect business /
reinsurance cannot be ceded.
5.
Bordereaux Submission
1
A.
Umum
Perekonomian Indonesia pada tahun
2011, sebagaimana diukur dari pendapatan
Domestik Bruto (PDB), meningkat sebesar
15,6% dari Rp. 6.422,9 triliun ditahun 2010
menjadi Rp. 7.427,1 triliun di tahun 2011.
B. Struktur Pasar
Berdasarkan data Badan Pengawas
Pasar Modal dan Lembaga Keuangan
(Bapepam-LK) pada Buku Perasuransian
Indonesia Tahun 2011, terdapat 85 perusahaan
asuransi umum yang memiliki izin beroperasi di
Indonesia.
C. Premi Bruto
Sampai dengan 31 Desember 2011, premi
bruto asuransi gempa bumi
Underwriting Year
2007 adalah sebesar Rp. 4.860,2 miliar. Premi
bruto untuk
Underwriting Year
2008 tercatat
Rp
1.956,9
miliar,
sedangkan
untuk
Underwriting Year 2009 adalah Rp. 2.529,1
miliar. Untuk
Underwriting Year
2010 dan 2011
adalah Rp. 1.993,9 miliar dan Rp. 1.779,7
miliar. Angka
–
angka ini akan terus bergerak
naik terutama untuk
Underwriting Year
2010
dan 2011.
A. General
Indonesian economic in 2011, as
measured by Gross Domestic Product (GDP),
increased by 15.6% from Rp. 6,422.9 trillion in
2010 to Rp. 7,427.1 trillion in 2011.
B. Market Structure
Based on Capital Market data and
Financial Institution Supervisory Agency
(Bapepam-LK) in the Book of Indonesian
Insurance 2011, there are 85 general insurers
having operating licenses in Indonesia.
C. Gross Premium
As at 31 December 2011, earthquake
gross premium for Underwriting Year 2007 was
Rp.
4,860.2
billion. Gross premium for
Underwriting Year 2008 was recorded Rp
1.956.9
billion, while for Underwriting Year
2009 was Rp. 2,529.1
billion. For Underwriting
Year 2010 and 2011 were Rp. 1
,993.9
billion
and Rp
1,779.7
billion.
Those figures would
certainly increase especially for Underwriting
Year 2010 and 2011.
2
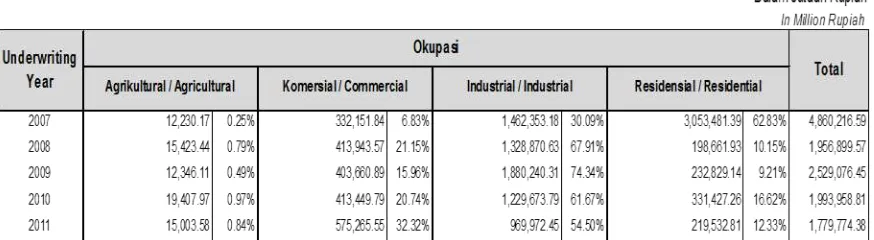
Dari
Underwriting Year
2007 sampai
Underwriting Year
2011, prosentase okupasi
Industrial selalu berada pada posisi
pendapatan tertinggi dibanding 3 (tiga) okupasi
lainnya (Agrikultural, Komersial, Residensial),
yaitu di atas 30% dari total premi.
Meskipun okupasi Komersial, Residensial
dan Agrikultural tidak memberikan kontribusi
premi sebesar okupasi Industrial, namun ketiga
okupasi tersebut memperlihatkan pertumbuhan
premi yang cukup signifikan. Hal ini terlihat
terutama pada premi okupasi Residensial
Underwriting Year
2009 yang meningkat
sebesar 17.2% dibanding
Underwriting Year
2008.
Tabel 1.1 di bawah ini menyajikan rincian
premi bruto berdasarkan jenis okupasi dari
Underwriting Year
2007 -
Underwriting Year
2011.
From
Underwriting
Year
2007
to
Underwriting Year 2011, Industrial occupation
always has the biggest percentage income
compared to 3 (three) remaining occupations
(Agricultural, Commercial, Residential), that is
30% from premium total.
Although occupation of Commercial,
Residential and Agricultural do not contribute
premium as much as Industrial occupation,
those three occupation show significant
premium growth. In this case, the premium
under Residential occupation in Underwriting
Year 2009 is increased by 17.2% compare to
Underwriting Year 2008.
The table 1.1 below presents the details of
gross premium based on occupation from
Underwriting Year 2007 to Underwriting Year
3
Jumlah Premi Bruto Asuransi Umum
Tahun 2011 berdasarkan Analisa Laporan
Publikasi Keuangan Perusahaan Asuransi
Umum dan Reasuransi yang diterbitkan oleh
Asosiasi Asuransi Umum Indonesia (AAUI)
mencapai Rp. 29,6 triliun tumbuh sebesar 18%
dibanding tahun sebelumnya yaitu sebesar Rp.
25,1 triliun. Sedangkan di periode yang sama,
jumlah
Premi
Asuransi
Gempa
Bumi
Underwriting Year
2011 tercatat sebesar Rp.
1,78 triliun.
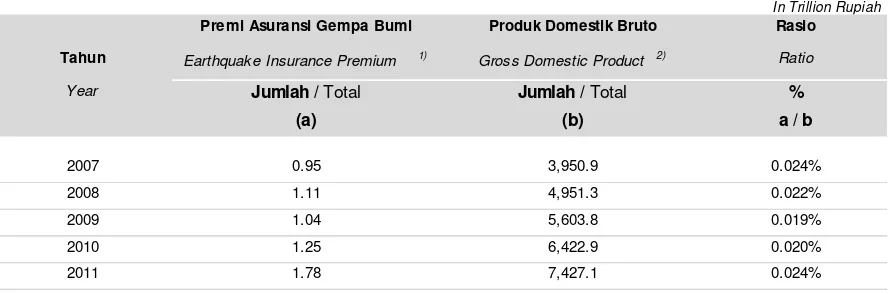
Kontribusi premi asuransi gempa bumi
terhadap Produk Domestik Bruto (PDB)
sebagaimana dicerminkan oleh rasio antara
premi bruto terhadap PDB pada Tahun 2011
sebesar 0,024 %.
Tabel 1.2 dibawah ini menggambarkan
rasio antara premi bruto asuransi gempa bumi
terhadap PDB Indonesia dari tahun 2007
sampai dengan tahun 2011
The gross premium collected by general
insurance in 2011 based on General Insurance
and
Reinsurance
Financial
Publication
Analyzing Report which is published by The
General Insurance Association of Indonesia
(AAUI) reached Rp. 29.6 trillion, increased by
18% compared to the previous year figure Rp.
25.1 trillion. At the same period, earthquake
gross premium for Underwriting Year 2011 was
Rp. 1.78 trillion.
The contribution of earthquake insurance
premium to Gross Domestic Product
(GDP) in
2011,
as measured by the ratio of
gross
premium to GDP in 2011 was 0.024%.
Table 1.2 below shows the ratio of gross
premium relative to Indonesian GDP from 2007
to 2011
.
Dalam Triliun Rupiah
In Trillion Rupiah
Premi Asuransi Gempa Bumi
Produk Domestik Bruto
Rasio
Tahun
Earthquak e Insurance Premium
1)Gross Domestic Product
2)Ratio
Year
Jumlah /
Total
Jumlah /
Total
%
(a)
(b)
a / b
2007
0.95
3,950.9
0.024%
2008
1.11
4,951.3
0.022%
2009
1.04
5,603.8
0.019%
2010
1.25
6,422.9
0.020%
2011
1.78
7,427.1
0.024%
Sumber / Sources
1) Data MAIPARK / MAIPARK data
2) Data BAPEPAM / BAPEPAM data
Tabel 1.2 Rasio Premi Bruto Asuransi Gempa Bumi Indonesia dan Produk Domestik Bruto 2007 - 2011
4
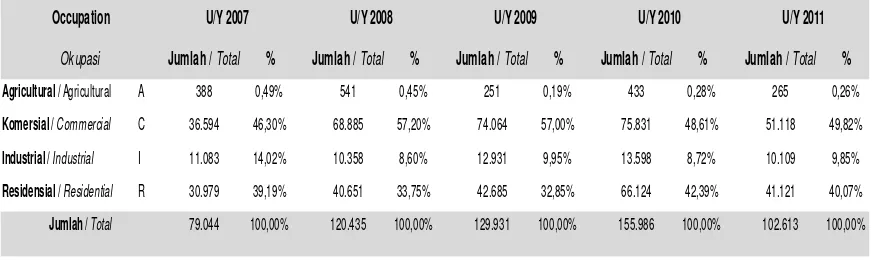
D. Jumlah Risiko
Tabel 1.3 dibawah ini menyajikan jumlah
risiko pada
Underwriting Year
2007 hingga
Underwriting Year
2011 yang tercatat sampai
dengan 31 Desember 2011.
D. Number of Risks
Table 1.3 below shows the number of
risks from Underwriting Year 2007 to
Underwriting Year 2011 recorded until 31
December 2011.
Tabel 1.3 Jumlah Risiko Berdasarkan Okupasi per 31 Desember 2011
Table 1.3 Number of Risk By Occupation as at 31 December 2011
Jumlah /
Total
%
Jumlah /
Total
%
Jumlah /
Total
%
Jumlah /
Total
%
Jumlah /
Total
%
Agricultural /
Agricultural
A
388
0,49%
541
0,45%
251
0,19%
433
0,28%
265
0,26%
Komersial /
Commercial
C
36.594
46,30%
68.885
57,20%
74.064
57,00%
75.831
48,61%
51.118
49,82%
Industrial /
Industrial
I
11.083
14,02%
10.358
8,60%
12.931
9,95%
13.598
8,72%
10.109
9,85%
Residensial /
Residential
R
30.979
39,19%
40.651
33,75%
42.685
32,85%
66.124
42,39%
41.121
40,07%
79.044
100,00%
120.435
100,00%
129.931
100,00%
155.986
100,00%
102.613
100,00%
U/Y 2010
U/Y 2011
Okupasi
Jumlah /
Total
5
Jumlah risiko terbesar untuk setiap
Underwriting Year
, dalam hal ini dari
Underwriting Year
2007 sampai dengan
Underwriting Year
2011 ada pada okupasi
Komersial, yaitu selalu berada pada rasio
diatas 46% dari total risiko. Kemudian diikuti
oleh okupasi Residensial sebesar 32%.
Jika terdapat asosiasi antara kontribusi
premi dengan banyaknya risiko maka belum
tentu asosiasi tersebut berbentuk linear dan
positif. Hal ini dibuktikan dengan apabila
melihat dari premi bruto tertinggi berada di
okupasi industrial sedangkan banyak risiko
tertinggi berada pada okupasi komersial.
The highest number of risks for each
Underwriting Year, in this case from
Underwriting Year 2007 to Underwriting Year
2011, is under Commercial occupation, which
is always on the ratio above 46% from the total
risk. Then, it is followed by Residential
occupation, that is 32%.
If there is any association between the
premium contribution and the number of risks
then the association is not necessarily linear
nor positive. This is proved which the highest
gross premium is on the industrial occupation
while the highest total risk is under commercial
occupation.
Grafik 1.1 Jumlah Risiko Berdasarkan Okupasi per 31 Desember 2011
6
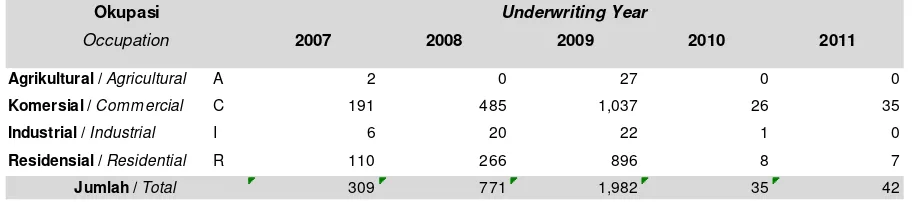
E. Incurred Claim
Berdasarkan table 1.4 di bawah ini
frekuensi klaim gempa bumi paling banyak
terjadi di
Underwriting Year
2009 yaitu
sebanyak 1.982 klaim dan didominasi okupasi
Komersial sebanyak 1.037 klaim. Hal ini
disebabkan oleh kejadian 2 (dua) gempa bumi
yang terbesar di 2009 yaitu Gempa Bumi
Pariaman pada tanggal 30 September 2009
dengan kekuatan 7,6 S.R dan Gempa Bumi
Tasikmalaya pada tanggal 2 September 2009
dengan kekuatan 7,0 S.R
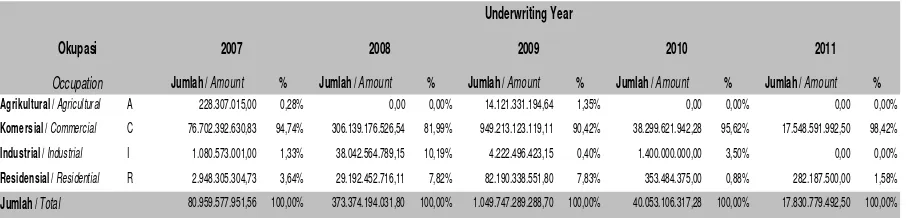
Dengan melihat Tabel 1.5 tampak bahwa
jumlah klaim terbesar juga berada pada
Underwriting Year
2009. Klaim yang terbesar
adalah pada okupasi Komersial, yaitu 90,42%
dari total klaim di
Underwriting Year
2009 atau
sebesar Rp. 949,2 miliar.
E. Incurred Claim
Based on table 1.4 below,
the highest
earthquake claim frequency occurred in
underwriting year 2009 is 1,982 claims and it
was dominated by Commercial occupation of
1,037 claims. It was caused by 2 (two) biggest
Earthquakes in 2009 namely Pariaman
Earthquake on 30 September 2009 with a
magnitude of 7.6 S.R and Tasikmalaya
Earthquake on 2nd September
2009
with a
magnitude of 7.0 S.R
Looking at table 1.5 below, it shows that
the largest claim is also in the Underwriting
Year 2009. The largest claim is under
Commercial occupation that is 90.42% of the
total claim in Underwriting Year 2009 or
Rp. 949.2 billion.
111111111111111111111111
2007
2008
2009
2010
2011
Agrikultural /
Agricultural
A
2
0
27
0
0
Komersial /
Commercial
C
191
485
1,037
26
35
Industrial /
Industrial
I
6
20
22
1
0
Residensial /
Residential
R
110
266
896
8
7
309
771
1,982
35
42
Table 1.4 Claim Frequency By Occupation as at 31 December 2011
Occupation
Jumlah /
Total
Tabel 1.4 Frekwensi Klaim Berdasarkan Okupasi per 31 Desember 2011
Underwriting Year
7
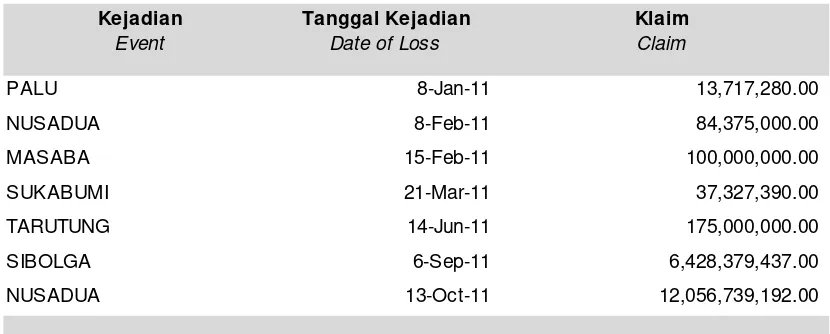
Tabel 1.6 di bawah ini menyajikan
beberapa kejadian Gempa Bumi Tahun 2011
yang tercatat sampai dengan 31 Desember
2011.
Klaim yang terbesar di tahun 2011 yaitu
sebesar Rp. 12,1 milyar, terutama disebabkan
oleh Gempa Bumi Nusa Dua yang terjadi pada
tanggal 13 Oktober 2011.
Table 1.6 below shows earthquake events
occurred in 2011 and the corresponding
incurred claims as at 31 December 2011.
The largest claim in 2011 that is Rp. 12.1
billion, mainly caused by Nusa Dua Earthquake
which occurred on 13 October 2011.
Table 1.5 Claim By Occupation as at 31 December 2011
Dalam Rupiah
In Rupiah
Jumlah /
Amount
%
Jumlah /
Amount
%
Jumlah /
Amount
%
Jumlah /
Amount
%
Jumlah /
Amount
%
Agrikultural /
Agricultural
A
228.307.015,00
0,28%
0,00
0,00%
14.121.331.194,64
1,35%
0,00
0,00%
0,00
0,00%
Komersial /
Commercial
C
76.702.392.630,83
94,74%
306.139.176.526,54
81,99%
949.213.123.119,11
90,42%
38.299.621.942,28
95,62%
17.548.591.992,50
98,42%
Industrial /
Industrial
I
1.080.573.001,00
1,33%
38.042.564.789,15
10,19%
4.222.496.423,15
0,40%
1.400.000.000,00
3,50%
0,00
0,00%
Residensial /
Residential
R
2.948.305.304,73
3,64%
29.192.452.716,11
7,82%
82.190.338.551,80
7,83%
353.484.375,00
0,88%
282.187.500,00
1,58%
80.959.577.951,56
100,00%
373.374.194.031,80
100,00%
1.049.747.289.288,70
100,00%
40.053.106.317,28
100,00%
17.830.779.492,50
100,00%
Occupation
2007
2008
2011
Jumlah /
Total
Underwriting Year
Tabel 1.5 Klaim Berdasarkan Okupasi per 31 Desember 2011
8
Tabel 1.6 Gempa Bumi di 2011 dan Incurred Claim per 31 Desember 2011
Table 1.6 Earthquak e in 2011 and Incurred Claim in as at 31 December 2011
in IDR
Kejadian
Tanggal Kejadian
Klaim
Event
Date of Loss
Claim
PALU
8-Jan-11
13,717,280.00
NUSADUA
8-Feb-11
84,375,000.00
MASABA
15-Feb-11
100,000,000.00
SUKABUMI
21-Mar-11
37,327,390.00
TARUTUNG
14-Jun-11
175,000,000.00
SIBOLGA
6-Sep-11
6,428,379,437.00
9
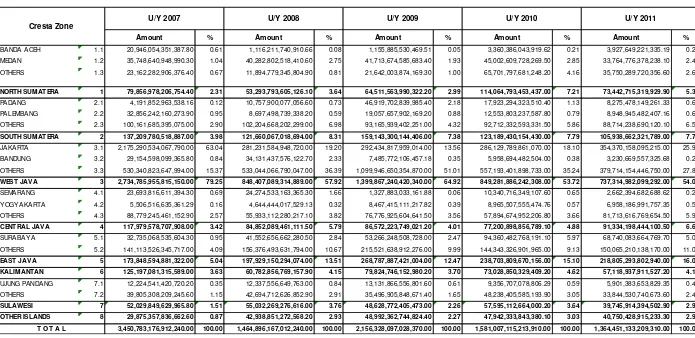
Tab le 2.1
in IDR
Amount
%
Amount
%
Amount
%
Amount
%
Amount
%
BANDA ACEH 1.1 20,946,054,351,387.80 0.61 1,116,211,740,910.66 0.08 1,155,885,530,469.51 0.05 3,360,386,043,919.62 0.21 3,927,649,221,335.19 0.29 MEDAN 1.2 35,748,640,948,990.30 1.04 40,282,802,518,410.60 2.75 41,713,674,585,683.40 1.93 45,002,609,728,269.50 2.85 33,764,776,378,238.10 2.47 OTHERS 1.3 23,162,282,906,376.40 0.67 11,894,779,345,804.90 0.81 21,642,003,874,169.30 1.00 65,701,797,681,248.20 4.16 35,750,289,720,356.60 2.62
NORTH SUMATERA 1 79,856,978,206,754.40 2.31 53,293,793,605,126.10 3.64 64,511,563,990,322.20 2.99 114,064,793,453,437.00 7.21 73,442,715,319,929.90 5.38
PADANG 2.1 4,191,852,963,538.16 0.12 10,757,900,077,056.60 0.73 46,919,702,839,985.40 2.18 17,923,294,323,510.40 1.13 8,275,478,149,261.33 0.61 PALEMBANG 2.2 32,856,242,160,273.90 0.95 8,697,498,739,338.20 0.59 19,057,657,902,169.20 0.88 12,553,803,237,587.80 0.79 8,948,945,482,407.16 0.66 OTHERS 2.3 100,161,685,395,075.00 2.90 102,204,668,202,299.00 6.98 93,165,939,402,251.00 4.32 92,712,332,593,331.50 5.86 88,714,238,690,120.10 6.50
SOUTH SUMATERA 2 137,209,780,518,887.00 3.98 121,660,067,018,694.00 8.31 159,143,300,144,406.00 7.38 123,189,430,154,430.00 7.79 105,938,662,321,789.00 7.76
JAKARTA 3.1 2,175,290,534,067,790.00 63.04 281,231,584,948,720.00 19.20 292,434,817,959,014.00 13.56 286,129,789,861,070.00 18.10 354,370,158,095,215.00 25.97 BANDUNG 3.2 29,154,598,099,365.80 0.84 34,131,437,576,122.70 2.33 7,485,772,106,457.18 0.35 5,958,694,482,504.00 0.38 3,230,669,557,325.68 0.24 OTHERS 3.3 530,340,823,647,994.00 15.37 533,044,066,790,047.00 36.39 1,099,946,650,354,870.00 51.01 557,193,401,898,733.00 35.24 379,714,154,446,750.00 27.83
WEST JAVA 3 2,734,785,955,815,150.00 79.25 848,407,089,314,889.00 57.92 1,399,867,240,420,340.00 64.92 849,281,886,242,308.00 53.72 737,314,982,099,292.00 54.04
SEMARANG 4.1 23,693,816,611,394.30 0.69 24,274,533,163,365.30 1.66 1,327,883,033,161.88 0.06 10,340,716,349,107.60 0.65 2,662,394,682,688.62 0.20 YOGYAKARTA 4.2 5,506,516,635,361.29 0.16 4,644,444,017,529.13 0.32 8,467,415,111,217.82 0.39 8,965,507,555,474.76 0.57 6,958,186,991,757.35 0.51 OTHERS 4.3 88,779,245,461,152.90 2.57 55,933,112,280,217.10 3.82 76,776,925,604,641.50 3.56 57,894,674,952,206.80 3.66 81,713,616,769,654.50 5.99
CENTRAL JAVA 4 117,979,578,707,908.00 3.42 84,852,089,461,111.50 5.79 86,572,223,749,021.20 4.01 77,200,898,856,789.10 4.88 91,334,198,444,100.50 6.69
SURABAYA 5.1 32,735,068,535,604.30 0.95 41,552,656,662,280.50 2.84 53,266,248,508,728.00 2.47 94,360,482,768,191.10 5.97 68,740,083,664,769.70 5.04 OTHERS 5.2 141,113,526,345,717.00 4.09 156,376,493,631,794.00 10.67 215,521,638,912,276.00 9.99 144,343,326,901,965.00 9.13 150,065,210,138,170.00 11.00
EAST JAVA 5 173,848,594,881,322.00 5.04 197,929,150,294,074.00 13.51 268,787,887,421,004.00 12.47 238,703,809,670,156.00 15.10 218,805,293,802,940.00 16.04
KALIMANTAN 6 125,197,081,315,589.00 3.63 60,782,856,769,157.90 4.15 79,824,746,152,980.20 3.70 73,028,850,329,409.20 4.62 57,118,937,911,527.20 4.19
UJUNG PANDANG 7.1 12,224,541,420,720.20 0.35 12,337,556,649,763.00 0.84 13,131,866,556,801.60 0.61 9,356,707,078,806.29 0.59 5,901,383,653,829.35 0.43 OTHERS 7.2 39,805,308,209,245.60 1.15 42,694,712,626,852.90 2.91 35,496,905,848,671.40 1.65 48,238,405,585,193.90 3.05 33,844,530,740,673.60 2.48
SULAWESI 7 52,029,849,629,965.80 1.51 55,032,269,276,616.00 3.76 48,628,772,405,473.00 2.26 57,595,112,664,000.20 3.64 39,745,914,394,502.90 2.91
OTHER ISLANDS 8 29,875,357,836,662.60 0.87 42,938,851,272,568.20 2.93 48,992,362,744,824.40 2.27 47,942,333,843,380.10 3.03 40,750,428,915,233.30 2.99
3,450,783,176,912,240.00 100.00 1,464,896,167,012,240.00 100.00 2,156,328,097,028,370.00 100.00 1,581,007,115,213,910.00 100.00 1,364,451,133,209,310.00 100.00
U/Y 2011
As At 31/12/2011
National Aggregate Exposure By Cresta Zone
T O T A L
U/Y 2010
10
64,511.56 159,143.30 1,399,867.24
86,572.22
268,787.89
79,824.75
48,628.77
48,992.36
114,064.79 123,189.43
849,281.89
77,200.90
238,703.81
73,028.85
57,595.11
47,942.33
73,442.72
105,938.66 737,314.98
91,334.20
218,805.29
57,118.94
39,745.91
40,750.43
North Sumatera
South Sumatera
West Java
Central Java
East Java
Kalimantan
Sulawesi
Other Islands
79,856.98 137,209.78 2,734,785.96
117,979.58
173,848.59
125,197.08
52,029.85 29,875.36
53,293.79 121,660.07 848,407.09
84,852.09
197,929.15
60,782.86
55,032.27
42,938.85
UY 2007
UY 2010 UY 2011
UY 2009
11
Amount % Amount % Amount % Amount % Amount %
AGRICULTURAL A 10,580,159,646,652.70 0.31 13,194,147,990,981.40 0.90 10,856,848,215,437.60 0.50 16,268,352,338,553.60 1.03 12,621,876,929,140.20 0.93 COMMERCIAL C 253,908,303,842,386.00 7.36 302,538,899,438,658.00 20.65 324,692,407,328,662.00 15.06 299,233,871,244,403.00 18.93 413,968,616,030,868.00 30.34 INDUSTRIAL I 1,164,429,859,626,930.00 33.74 1,010,828,848,993,600.00 69.00 1,647,230,107,360,170.00 76.39 1,018,371,095,156,720.00 64.41 790,903,090,181,498.00 57.96 RESIDENTIAL R 2,021,864,853,796,270.00 58.59 138,334,270,588,994.00 9.44 173,548,734,124,096.00 8.05 247,133,796,474,229.00 15.63 146,957,550,067,807.00 10.77 3,450,783,176,912,240.00 100.00 1,464,896,167,012,240.00 100.00 2,156,328,097,028,370.00 100.00 1,581,007,115,213,910.00 100.00 1,364,451,133,209,310.00 100.00
T O T A L
U/Y 2009
U/Y 2010
U/Y 2011
in IDR
U/Y 2007
U/Y 2008
Tab le 2.2
Occupation
As At 31/12/2011
12
( In Billion IDR )
Agricultural, 10,856.85 Commercial,
324,692.41
Industrial, 1,647,230.11
Residential, 173,548.73
Agricultural, 16,268.35
Commercial, 299,233.87 Industrial,
1,018,371.10
Residential, 247,133.80
Agricultural, 12,621.88
Commercial,
413,968.62 Industrial, 790,903.09
Residential, 146,957.55 Agricultural,
10,580.16 Commercial,
253,908.30 Industrial,
1,164,429.86 Residential,
2,021,864.85
UY 2007
Agricultural, 13,194.15 Commercial,
302,538.90
Industrial, 1,010,828.85
Residential, 138,334.27
UY 2008
UY 2009
13
Tab le 2.3
Amount
%
Amount
%
Amount
%
Amount
%
Amount
%
Building 2,782,627,782,669,920.00 80.64 663,443,517,245,253.00 45.29 755,087,719,250,823.00 35.02 721,147,201,035,219.00 45.61 645,091,789,291,634.00 47.28 Machinery 247,551,668,773,754.00 7.17 313,146,498,865,169.00 21.38 299,444,146,551,928.00 13.89 358,621,969,591,429.00 22.68 243,269,576,840,617.00 17.83 Others 206,383,844,772,498.00 5.98 227,801,990,683,564.00 15.55 192,205,473,456,859.00 8.91 176,534,261,726,599.00 11.17 148,790,004,416,389.00 10.90 Stock 122,621,030,278,696.00 3.55 155,874,425,828,692.00 10.64 778,288,922,070,560.00 36.09 199,289,822,952,644.00 12.61 184,771,017,918,928.00 13.54 Bussiness Interruption 91,598,850,417,374.80 2.65 104,629,734,389,558.00 7.14 131,301,835,698,199.00 6.09 125,413,859,908,018.00 7.93 142,528,744,741,747.00 10.45
T O T A L 3,450,783,176,912,240.00 100.00 1,464,896,167,012,240.00 100.00 2,156,328,097,028,370.00 100.00 1,581,007,115,213,910.00 100.00 1,364,451,133,209,310.00 100.00
National Aggregate Exposure By Interest
In IDR
Interest
U/Y 2009
U/Y 2010
U/Y 2011
As At 31/12/2011
14
500,000.00
1,000,000.00
1,500,000.00
2,000,000.00
2,500,000.00
3,000,000.00
UY 2007
UY 2008
UY 2009
UY 2010
UY 2011
Building
Machinery
Stock
Others
15
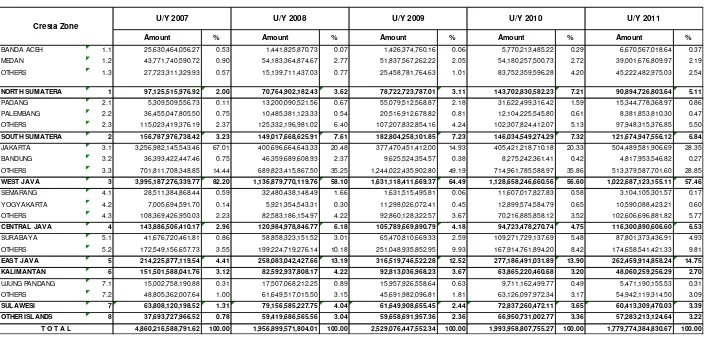
Tab le 2.4
In IDR
Amount % Amount % Amount % Amount % Amount %
01. NAD 24,848,119,975,155.60 0.72 4,290,317,187,979.25 0.29 2,191,738,657,461.15 0.10 45,868,116,636,337.70 2.90 6,031,392,349,185.37 0.44 02. SUMATERA UTARA 55,008,858,231,598.90 1.59 49,003,476,417,146.90 3.35 62,319,825,332,861.00 2.89 68,196,676,817,099.60 4.31 67,411,322,970,744.50 4.94 03. SUMATERA BARAT 10,606,914,063,855.00 0.31 17,730,941,861,464.60 1.21 51,917,437,693,956.40 2.41 21,275,297,058,233.40 1.35 14,378,030,644,306.00 1.05 04. RIAU 57,001,922,176,917.10 1.65 38,883,549,284,266.30 2.65 23,784,482,045,177.90 1.10 32,250,208,350,987.60 2.04 24,599,732,128,490.80 1.80 05. JAMBI 2,177,341,977,911.76 0.06 4,652,608,320,964.74 0.32 4,292,463,320,302.53 0.20 5,063,484,226,369.38 0.32 5,555,674,453,951.24 0.41 06. SUMATERA SELATAN 47,384,899,896,626.70 1.37 29,405,510,961,669.20 2.01 34,460,508,955,682.40 1.60 26,287,918,615,188.50 1.66 17,855,776,212,158.20 1.31 07. BENGKULU 2,139,275,170,388.85 0.06 2,862,294,888,811.73 0.20 2,847,609,545,360.79 0.13 2,964,790,289,622.14 0.19 3,018,217,237,932.95 0.22 08. LAMPUNG 16,433,971,046,896.60 0.48 23,640,683,001,428.80 1.61 22,118,441,327,422.80 1.03 16,428,927,745,846.20 1.04 20,291,657,327,134.70 1.49 09. KEP BANGKA-BELITUNG 2,174,244,456,466,570.00 63.01 241,498,135,217,603.00 16.49 23,549,031,664,472.10 1.09 2,948,546,101,903.38 0.19 1,419,646,923,059.98 0.10 10. KEPULAUAN RIAU 261,923,417,064,245.00 7.59 417,031,928,711,798.00 28.47 36,880,753,818,732.20 1.71 15,970,257,766,279.20 1.01 18,819,927,394,754.70 1.38 11. JAKARTA 298,208,678,775,623.00 8.64 164,499,619,779,406.00 11.23 278,626,801,999,284.00 12.92 286,129,789,861,070.00 18.10 354,370,158,095,215.00 25.97 12. JAWA BARAT 113,025,816,307,233.00 3.28 89,741,081,073,816.40 6.13 927,727,741,438,962.00 43.02 385,112,455,575,669.00 24.36 252,343,696,230,863.00 18.49 13. JAWA TENGAH 174,291,098,074,106.00 5.05 144,134,507,149,254.00 9.84 76,517,659,354,264.30 3.55 66,912,386,188,185.40 4.23 83,276,972,984,675.10 6.10 14. DIY 1,798,803,839,547.29 0.05 2,077,079,902,854.16 0.14 9,435,220,297,568.88 0.44 10,288,512,668,603.70 0.65 8,057,225,459,425.44 0.59 15. JAWA TIMUR 3,867,990,051,227.63 0.11 61,095,815,794,083.30 4.17 265,959,401,441,051.00 12.33 238,703,809,670,156.00 15.10 218,805,293,802,940.00 16.04 16. BANTEN 11,481,508,465,705.10 0.33 29,919,727,170,855.70 2.04 158,522,117,549,885.00 7.35 178,039,640,805,569.00 11.26 130,601,127,773,213.00 9.57 17. BALI 108,341,826,679,695.00 3.14 51,300,770,607,770.30 3.50 40,306,654,467,569.10 1.87 38,073,694,735,130.90 2.41 32,772,278,105,362.80 2.40 18. NUSA TENGGARA BARAT 21,049,754,666,960.70 0.61 28,856,280,053,897.80 1.97 3,503,081,962,155.78 0.16 2,854,939,365,449.17 0.18 2,050,102,030,426.78 0.15 19. NUSA TENGGARA TIMUR 3,462,405,534,461.99 0.10 1,914,075,420,361.50 0.13 765,808,171,864.34 0.04 878,693,027,056.44 0.06 1,052,401,973,128.50 0.08 20. KALIMANTAN BARAT 463,852,708,894.56 0.01 1,114,461,989,199.07 0.08 3,934,122,530,739.52 0.18 4,064,934,246,504.32 0.26 3,110,136,622,206.81 0.23 21. KALIMANTAN TENGAH 3,771,946,564,697.26 0.11 3,569,224,728,240.06 0.24 3,417,436,016,891.93 0.16 9,657,116,586,523.51 0.61 7,137,901,589,087.45 0.52 22. KALIMANTAN SELATAN 29,337,875,002,465.80 0.85 31,511,526,704,934.80 2.15 14,212,010,659,548.80 0.66 14,018,737,235,307.40 0.89 12,072,179,654,545.70 0.88 23. KALIMANTAN TIMUR 18,704,782,956,229.00 0.54 8,593,635,160,891.60 0.59 55,820,408,075,866.20 2.59 45,288,062,261,074.00 2.86 34,798,720,045,687.30 2.55 24. SULAWESI UTARA 336,568,304,138.57 0.01 1,236,932,031,231.48 0.08 7,082,184,740,469.35 0.33 7,282,692,958,892.90 0.46 8,445,322,042,594.93 0.62 25. SULAWESI TENGAH 947,500,020,420.67 0.03 876,448,961,036.77 0.06 1,200,465,351,863.90 0.06 1,246,100,454,379.68 0.08 1,107,836,596,487.78 0.08 26. SULAWESI SELATAN 3,827,071,507,150.59 0.11 6,848,975,601,540.73 0.47 20,170,912,862,299.80 0.94 17,173,572,014,393.30 1.09 16,905,325,139,690.40 1.24 27. SULAWESI TENGGARA 6,032,210,917,960.19 0.17 5,239,276,585,164.48 0.36 8,636,128,693,177.33 0.40 18,264,288,906,443.40 1.16 488,783,002,794.66 0.04 28. GORONTALO -3,483,350,960.00 0.00 63,220,721,283.90 0.00 10,823,890,398,347.70 0.50 11,972,569,182,919.00 0.76 11,949,994,451,981.20 0.88 29. SULAWESI BARAT 0.00 0.00 5,524,167,772.00 0.00 557,543,314,772.00 0.03 1,655,889,146,971.84 0.10 848,653,160,954.00 0.06 30. MALUKU -1,668,288,461.00 0.00 87,110,928,317.00 0.01 534,583,254,836.88 0.02 924,038,381,547.74 0.06 742,103,260,126.18 0.05 31. MALUKU UTARA 35,383,193,400.00 0.00 28,492,544,860.00 0.00 440,641,025,133.64 0.02 420,186,289,091.50 0.03 297,056,175,135.64 0.02 32. PAPUA BARAT 19,931,152,145.00 0.00 117,391,915,036.29 0.01 1,995,819,622,119.31 0.09 1,789,842,244,408.20 0.11 1,565,884,179,341.00 0.11 33. PAPUA 14,147,759,433.00 0.00 3,065,542,167,296.00 0.21 1,775,171,438,268.80 0.08 3,000,939,800,696.14 0.19 2,270,603,191,712.40 0.17 T O T A L 3,450,783,176,912,240.00 100.00 1,464,896,167,012,240.00 100.00 2,156,328,097,028,370.00 100.00 1,581,007,115,213,910.00 100.00 1,364,451,133,209,310.00 100.00
Province U/Y 2007 U/Y 2008 U/Y 2009 U/Y 2011
National Aggregate Exposure By Province
As At 31/12/2011
16
Tab le 3.1
in IDR
Amount
%
Amount
%
Amount
%
Amount
%
Amount
%
BANDA ACEH 1.1 25,630,464,056.27 0.53 1,441,825,870.73 0.07 1,426,374,760.16 0.06 5,770,213,485.22 0.29 6,670,567,018.64 0.37 MEDAN 1.2 43,771,740,590.72 0.90 54,183,364,874.67 2.77 51,837,567,262.22 2.05 54,180,257,500.73 2.72 39,001,676,809.97 2.19 OTHERS 1.3 27,723,311,329.93 0.57 15,139,711,437.03 0.77 25,458,781,764.63 1.01 83,752,359,596.28 4.20 45,222,482,975.03 2.54
NORTH SUMATERA 1 97,125,515,976.92 2.00 70,764,902,182.43 3.62 78,722,723,787.01 3.11 143,702,830,582.23 7.21 90,894,726,803.64 5.11
PADANG 2.1 5,309,509,556.73 0.11 13,200,090,521.56 0.67 55,079,512,568.87 2.18 31,622,499,316.42 1.59 15,344,778,368.97 0.86 PALEMBANG 2.2 36,455,047,805.50 0.75 10,485,381,123.33 0.54 20,516,912,678.82 0.81 12,104,225,545.80 0.61 8,381,853,810.30 0.47 OTHERS 2.3 115,023,419,376.19 2.37 125,332,196,981.02 6.40 107,207,832,854.16 4.24 102,307,824,412.07 5.13 97,948,315,376.85 5.50
SOUTH SUMATERA 2 156,787,976,738.42 3.23 149,017,668,625.91 7.61 182,804,258,101.85 7.23 146,034,549,274.29 7.32 121,674,947,556.12 6.84
JAKARTA 3.1 3,256,982,145,543.46 67.01 400,696,664,643.33 20.48 377,470,451,412.00 14.93 405,421,218,710.18 20.33 504,489,581,906.69 28.35 BANDUNG 3.2 36,393,422,447.46 0.75 46,359,689,608.93 2.37 9,625,524,354.57 0.38 8,275,242,361.41 0.42 4,817,953,546.82 0.27 OTHERS 3.3 701,811,708,348.85 14.44 689,823,415,867.50 35.25 1,244,022,435,902.80 49.19 714,961,785,588.97 35.86 513,379,587,701.60 28.85
WEST JAVA 3 3,995,187,276,339.77 82.20 1,136,879,770,119.76 58.10 1,631,118,411,669.37 64.49 1,128,658,246,660.56 56.60 1,022,687,123,155.11 57.46
SEMARANG 4.1 28,511,384,868.44 0.59 32,480,438,148.49 1.66 1,631,515,495.81 0.06 11,607,017,827.83 0.58 3,104,105,301.57 0.17 YOGYAKARTA 4.2 7,005,694,591.70 0.14 5,921,354,543.31 0.30 11,298,026,072.41 0.45 12,899,574,584.79 0.65 10,590,088,423.21 0.60 OTHERS 4.3 108,369,426,950.03 2.23 82,583,186,154.97 4.22 92,860,128,322.57 3.67 70,216,885,858.12 3.52 102,606,696,881.82 5.77
CENTRAL JAVA 4 143,886,506,410.17 2.96 120,984,978,846.77 6.18 105,789,669,890.79 4.18 94,723,478,270.74 4.75 116,300,890,606.60 6.53
SURABAYA 5.1 41,676,720,461.81 0.86 58,858,323,151.52 3.01 65,470,810,669.33 2.59 109,271,729,137.69 5.48 87,801,373,436.91 4.93 OTHERS 5.2 172,549,156,657.73 3.55 199,224,719,276.14 10.18 251,048,935,852.95 9.93 167,914,761,894.20 8.42 174,658,541,421.33 9.81
EAST JAVA 5 214,225,877,119.54 4.41 258,083,042,427.66 13.19 316,519,746,522.28 12.52 277,186,491,031.89 13.90 262,459,914,858.24 14.75
KALIMANTAN 6 151,501,588,041.76 3.12 82,592,937,808.17 4.22 92,813,036,968.23 3.67 63,865,220,460.68 3.20 48,060,259,256.29 2.70
UJUNG PANDANG 7.1 15,002,758,190.88 0.31 17,507,068,212.25 0.89 15,957,926,558.64 0.63 9,711,162,499.77 0.49 5,471,190,155.53 0.31 OTHERS 7.2 48,805,362,007.64 1.00 61,649,517,015.50 3.15 45,691,982,096.81 1.81 63,126,097,972.34 3.17 54,942,119,314.50 3.09
SULAWESI 7 63,808,120,198.52 1.31 79,156,585,227.75 4.04 61,649,908,655.45 2.44 72,837,260,472.11 3.65 60,413,309,470.03 3.39
OTHER ISLANDS 8 37,693,727,966.52 0.78 59,419,686,565.56 3.04 59,658,691,957.36 2.36 66,950,731,002.77 3.36 57,283,213,124.64 3.22
4,860,216,588,791.62 100.00 1,956,899,571,804.01 100.00 2,529,076,447,552.34 100.00 1,993,958,807,755.27 100.00 1,779,774,384,830.67 100.00
U/Y 2011
As At 31/12/2011
National Gross Premium By Cresta Zone
T O T A L
U/Y 2010
17
(in Billion IDR)
North Sumatera
South Sumatera
West Java
Central Java
East Java
Kalimantan
Sulawesi
Other Islands
78.72
182.80 1,631.12
105.79
316.52
92.81 61.65 59.66
143.70
146.03 1,128.66
94.72
277.19
63.87
72.84
66.95
90.89 121.67
1,022.69
116.30 262.46
48.06 60.41 57.28 97.13
156.79
3,995.19
143.89 214.23
151.50 63.81
37.69
70.76 149.02
1,136.88
120.98
258.08 82.59
79.16 59.42
UY 2007
UY 2008
UY 2009
UY 2010
18
Amount
%
Amount
%
Amount
%
Amount
%
Amount
%
AGRICULTURAL
A
12,230,174,370.98
0.25
15,423,437,524.11
0.79
12,346,111,502.87
0.49
19,407,969,923.17
0.97
15,003,577,144.25
0.84
COMMERCIAL
C
332,151,843,160.20
6.83
413,943,573,003.58
21.15
403,660,885,872.60
15.96
413,449,791,503.23
20.74
575,265,546,285.50
32.32
INDUSTRIAL
I
1,462,353,179,357.84
30.09
1,328,870,631,456.01
67.91
1,880,240,310,083.18
74.34
1,229,673,790,563.70
61.67
969,972,447,090.72
54.50
RESIDENTIAL
R
3,053,481,391,902.62
62.83
198,661,929,820.29
10.15
232,829,140,093.68
9.21
331,427,255,765.17
16.62
219,532,814,310.21
12.33
4,860,216,588,791.64
100.00
1,956,899,571,803.99
100.00
2,529,076,447,552.33
100.00
1,993,958,807,755.27
100.00
1,779,774,384,830.68
100.00
Table 3.2
Occupation
As At 31/12/2011
National Gross Premium By Occupation
T O T A L
U/Y 2009
U/Y 2010
U/Y 2011
in IDR
19
( In Billion IDR )
Agricultural, 12.35 Commercial,
403.66
Industrial, 1,880.24
Residential, 232.83
Agricultural, 19.41
Commercial, 413.45
Industrial, 1,229.67 Residential, 331.43
Agricultural, 15.00
Commercial, 575.27
Industrial, 969.97
Residential, 219.53
2010
Agricultural, 12.23
Commercial, 332.15
Industrial, 1,462.35 Residential,
3,053.48
UY 2007
Agricultural, 15.42 Commercial, 413.94
Industrial, 1,328.87
Residential, 198.66
UY 2008
UY 2009
UY 2010
20
Tab le 3.3
In IDR
Amount % Amount % Amount % Amount % Amount %
01. NAD 30,534,776,438.48 0.63 5,559,654,731.36 0.28 2,674,803,194.56 0.11 61,632,468,960.71 3.09 9,990,014,602.54 0.56 02. SUMATERA UTARA 66,590,739,538.44 1.37 65,205,247,451.07 3.33 76,047,920,592.44 3.01 82,070,361,621.52 4.12 80,904,712,201.10 4.55 03. SUMATERA BARAT 12,825,876,392.22 0.26 22,438,049,963.73 1.15 61,916,676,280.65 2.45 37,368,891,397.48 1.87 24,195,987,461.56 1.36 04. RIAU 63,529,552,609.67 1.31 44,868,384,699.52 2.29 25,439,350,087.28 1.01 32,475,042,134.48 1.63 24,704,526,856.54 1.39 05. JAMBI 2,444,590,155.16 0.05 5,424,551,066.59 0.28 4,719,256,967.70 0.19 5,064,526,980.57 0.25 5,338,974,667.32 0.30 06. SUMATERA SELATAN 53,697,673,385.59 1.10 36,535,486,066.22 1.87 39,090,997,357.17 1.55 27,524,370,722.33 1.38 18,096,608,777.54 1.02 07. BENGKULU 2,858,873,206.78 0.06 3,758,636,535.51 0.19 3,834,895,909.19 0.15 5,254,187,192.46 0.26 5,299,126,019.65 0.30 08. LAMPUNG 19,700,864,377.66 0.41 30,767,030,499.70 1.57 27,034,155,519.41 1.07 22,213,834,837.26 1.11 27,353,359,021.20 1.54 09. KEP BANGKA-BELITUNG 3,255,626,679,185.36 66.99 346,513,135,075.08 17.71 33,228,952,153.72 1.31 2,607,126,781.90 0.13 1,247,247,121.16 0.07 10. KEPULAUAN RIAU 315,431,699,184.02 6.49 535,334,622,482.40 27.36 44,531,817,183.19 1.76 13,526,569,227.80 0.68 15,439,117,631.15 0.87 11. JAKARTA 423,642,597,521.26 8.72 221,977,038,948.02 11.34 356,995,560,526.90 14.12 405,421,218,710.18 20.33 504,489,581,906.69 28.35 12. JAWA BARAT 137,517,289,876.21 2.83 127,259,261,481.65 6.50 1,038,715,456,140.64 41.07 489,951,113,432.94 24.57 340,672,155,528.25 19.14 13. JAWA TENGAH 214,756,136,863.71 4.42 190,054,777,259.77 9.71 92,679,374,734.35 3.66 79,951,823,978.45 4.01 104,072,890,036.22 5.85 14. DIY 1,969,245,916.58 0.04 2,427,089,706.17 0.12 12,483,772,980.38 0.49 14,771,654,292.29 0.74 12,228,000,570.39 0.69 15. JAWA TIMUR 4,303,141,014.54 0.09 76,171,797,759.37 3.89 312,763,087,162.93 12.37 277,186,491,031.89 13.90 262,459,914,858.24 14.75 16. BANTEN 13,777,769,853.95 0.28 38,913,393,363.94 1.99 185,897,093,377.04 7.35 233,285,914,517.44 11.70 177,525,385,720.18 9.97 17. BALI 131,788,977,729.38 2.71 72,047,234,580.44 3.68 49,131,530,013.44 1.94 52,048,900,830.25 2.61 45,172,657,862.78 2.54 18. NUSA TENGGARA BARAT 27,064,636,014.11 0.56 39,814,400,689.19 2.03 4,267,376,642.56 0.17 4,344,010,312.54 0.22 3,496,736,490.79 0.20 19. NUSA TENGGARA TIMUR 4,270,811,969.90 0.09 2,514,476,002.27 0.13 927,091,108.65 0.04 1,304,722,914.96 0.07 1,565,253,280.31 0.09 20. KALIMANTAN BARAT 549,668,593.49 0.01 1,293,091,568.11 0.07 4,249,335,117.35 0.17 3,622,420,039.63 0.18 2,663,353,302.44 0.15 21. KALIMANTAN TENGAH 4,715,081,625.19 0.10 4,656,123,231.57 0.24 3,636,902,395.29 0.14 8,206,410,381.89 0.41 5,886,840,722.90 0.33 22. KALIMANTAN SELATAN 36,013,929,768.74 0.74 47,707,174,315.46 2.44 16,869,048,946.46 0.67 12,419,142,451.92 0.62 10,495,516,494.02 0.59 23. KALIMANTAN TIMUR 22,823,100,314.35 0.47 13,415,326,271.66 0.69 64,843,768,137.64 2.56 39,617,247,587.24 1.99 29,014,548,736.93 1.63 24. SULAWESI UTARA 408,111,151.97 0.01 1,489,925,060.69 0.08 9,151,812,335.69 0.36 12,047,879,934.60 0.60 15,436,704,861.22 0.87 25. SULAWESI TENGAH 1,169,900,282.50 0.02 1,163,120,346.25 0.06 1,467,786,084.95 0.06 1,856,945,769.60 0.09 1,705,417,207.30 0.10 26. SULAWESI SELATAN 4,486,879,546.03 0.09 8,860,108,079.01 0.45 24,213,777,973.84 0.96 18,140,708,265.94 0.91 17,480,653,335.20 0.98 27. SULAWESI TENGGARA 7,640,950,476.42 0.16 6,837,191,590.35 0.35 9,795,307,065.70 0.39 20,207,273,780.63 1.01 704,257,969.22 0.04 28. GORONTALO -3,307,853.60 0.00 75,065,143.22 0.00 16,034,251,762.11 0.63 18,227,985,280.47 0.91 23,835,879,418.55 1.34 29. SULAWESI BARAT 0.00 0.00 6,947,185.20 0.00 670,826,724.60 0.03 2,356,467,440.87 0.12 1,250,396,678.54 0.07 30. MALUKU -1,804,177.54 0.00 104,838,940.76 0.01 680,805,112.24 0.03 1,696,037,935.56 0.09 1,275,074,159.34 0.07 31. MALUKU UTARA 42,376,774.76 0.00 34,296,851.94 0.00 554,263,273.90 0.02 714,168,122.14 0.04 503,518,020.56 0.03 32. PAPUA BARAT 23,290,824.97 0.00 138,153,246.09 0.01 2,362,121,618.35 0.09 2,641,540,584.74 0.13 2,247,578,310.42 0.13 33. PAPUA 16,480,231.35 0.00 3,533,941,611.69 0.18 2,167,273,072.00 0.09 4,201,350,302.57 0.21 3,022,395,000.45 0.17 T O T A L 4,860,216,588,791.65 100.00 1,956,899,571,804.00 100.00 2,529,076,447,552.32 100.00 1,993,958,807,755.25 100.00 1,779,774,384,830.70 100.00
Province U/Y 2007 U/Y 2008 U/Y 2009 U/Y 2011
National Gross Premium By Province
As At 31/12/2011