Factors That Affect Stock Prices At The Manufacturing Companies
Listed On The Indonesia Stock Exchange
Yunita Setya Purwaningtyastuti1, Kartika Hendra Titisari2, Siti Nurlaela3 123
Program Studi Akuntansi S1, Fakultas Ekonomi, Universitas Islam Batik Surakarta Jl. KH. Agus Salim No. 10, Surakarta 57147, Jawa Tengah, Indonesia
*E-mail : [email protected]
Abstract : This study examined the influence of liquidity (Current Ratio), profitability (Net Profit Margin, Earning Per Share, Return On Equity), solvency (Debt to Equity Ratio) against the stock price at manufacturing companies listed on the Indonesia stock exchange. The population of this research is all the manufacturing companies listed on the Indonesia stock exchange. The sample of this research as much as 84 manufacturing companies listed on the Indonesia stock exchange. Types of data used are secondary data derived from the Indonesia Capital Market Directory (ICMD). Results descriptive statistics shows that an increase in the stock price, which if viewed from the parameters of the stock price more done on the parameters of the Earning Per Share. Based on the correlation analysis shows the current ratio of negative effect variables significantly to the stock price, the Net Profit Margin effect significantly to stock prices, Debt to Equity Ratio of significant negative effect against the share price, While Earning Per Share and Return On Equity did not affect stock prices. Based on regression analysis, we find that variable Current Ratio, Net Profit Margin, Earning Per Share, Return On Equity, Debt to Equity Ratio effect significantly to stock prices.
Keywords : Liquidity; Profitability; Solvency; the Stock Price.
1.
INTRODUCTION
Capital market is one of the Alternatively financing for capital gain and costs are relatively cheap and as a place to invest in short term and long term. The capital market is one of the sources of economic progress as it can be a source of and alternatives for companies besides banks (Trisnawati, 2015).
The stock price is an indicator of the success of the management of the company. The better achievement of the company will increase the price of the shares of the company in question. Performance evaluation can be done using the analysis of the financial
statements. Analysis of financial
statements can be performed using financial ratios. Ratio-financial ratio used to describe the strengths and weaknesses of the price of shares in the capital market. Financial ratios in this
study include Liquidity Ratio is
represented by the current ratio (CR), the ratio of Profitability represented by net profit margin (NPM), earning per
share (EPS), return on equity (ROE), and Solvency Ratio represented by debt to equity ratio (DER).
Current Ratio (CR) is one of the liquidity ratios are used to measure the degree of liquidity of the company. The higher the CR company then deemed able to repay short-term obligations, raising the stock price. Research Ferawati (2017) stated that the Current Ratio effect significantly to the stock price, but the results of this research study results conflicted with Erari (2014) and-Ansari (2016) stated that the Current Ratio does not effect limited. Net Profit Margin ratio of profitability is one that is used to measure the net profit compared to sales. Research Affinanda (2015) stated that the Net Profit Margin effect significantly to the stock price, but contrary to the results of research (2013) and Lisnawati
Ferawati (2017) found empirical
evidence that Net Profit Margins have no effect significantly to stock prices.
EPS is considered the most fundamental and can describe the company's future earning prospects. Research results Meythi and Linda (2011) stated that the Earning Per Share is not significant effect against the stock price, but contrary to the results of
research (2015) and Trisnawati
Ferawati (2017) stated that the Earning Per Share effect significantly to stock prices. Return On Equity is the ratio to measure the net profit after tax of capital itself. Research Lisnawati (2013), Trisnawati (2015) and Al Qaisi; et al (2016) stated that the Return On Equity has no effect significantly to the stock price, but contrary to the results of the research Ferawati (2017) stated that the Return On Equity significantly influential against stock prices.
Debt to Equity Ratio (DER) is the ratio between the Fund's loan or debt compared with the capital in the company's ratio of development efforts. The lower the capital indicate DER used in the company's operations is getting smaller, so the risks borne by investors will also increasingly small and would be able to increase the price of the stock. The larger the DER study results conflicted with Sulia (2013) and Trisnawati (2015) stated that the Debt to Equity Ratio was not significant effect against the stock price.
This research aims to find out whether there is influence of partially CR, NPM, EPS, ROE, and DER against stock prices. This research is expected to deliver benefits as a source of information for the company to predict financial performance within a single company.
2.
METODOLOGY
Used is the kind of research quantitative research. The dependent variable in this study is the stock price. Independent variable in this study consists of Current Ratio, Net Profit Margin, Earning Per Share, Return On Equity, and Debt to Equity Ratio. Pda data source research is secondary data
i.e. financial reporting data
manufacturing companies, published by the Indonesia Capital Market Directory (ICMD) on the official website i.e.
Indonesia stock exchange
www.idx.co.id.
The population in this research is 144 manufacturing company. Sampling method of research using the method of purposive sampling. The criteria the company samples in this research: 1) Manufacturing companies listed on the Indonesia stock exchange period 2014-2015. 2) manufacturing company which publishes financial reports on an ongoing basis during the period of the study. 3) manufacturing companies that have positive earnings in the period of the study. The company that made the sample in this research are:
These studies are either 1 method of analysis) descriptive statistics. 2 Classic
Assumption Test) Test using a
Normality test the
Kolmogorov-Smirnov, by looking at the value of significance, if sig > 0.05, then it can be inferred the normal distributed data
Test multikoliniearitas by looking at the great value of the VIF (Variance
must be fulfilled is the absence of autocorrelation in regression model 3) multiple linear regression analysis with the following equation:
Y = a + b1X1 + b2X2 + b3X3 + b4X4 + b5X5 +
e
Description: Y = variable (Y)
a = the number of constants
b1, b2, b3, b4, b5 = a coefficient of the direction line
X 1 = free variable (X 1) X 2 = free variable (X 2) X 3 = free variable (X 3) X 4 = free variable (X 4) X 5 = free variable (X 5) e = Error
Feasibility test model (F Test) and see the significance, if there is then the < 0.05 significance influence between independent variables the dependent variables against.
Hypothesis test (test t) and see the significance, if the value of significance < 0.05 there are influences partially
between the dependent variables
independent of the variable.
3.
RESULT AND DISCUSSION
Based on the method of purposive sampling, samples obtained as many as 84 manufacturing companies listed on the Indonesia stock exchange 2014-2015 period, then the data is retrieved as many as 168 observational data.
3.1Test Result of Descriptive Statistics
Descriptive statistics are used to describe the characteristics of data variables in the study.
Tabel 1. Result Descriptive Statistics
Ratio N Mean Min Max Std. Deviasi
CR 168 24775.90 654 133500 24559.200
NPM 168 668.85 4 3276 663.760
EPS 168 54810.92 2 1762138 188012.289
ROE 168 1288.23 -151 14353 1928.069
DER 168 86.26 -493 799 114.187
Stock Price 168 978.18 5 22325 2611.535
Descriptive statistics of the results in the table above shows that the variable Current Ratio minimum of 654, maximum of 133.500, with the average (mean) 24,775.90 and the rate of std. Deviation of 24,559.20. The variable Net Profit Margin minimum 4, maximum of 3.276, with the average (mean) 668.85 and level std. Deviation of 663,760. Variable Earning Per Share minimum 2, maximum of 1,762,138, with the average (mean) 54,810.92 and
the rate of std. Deviation of
188,012.289. Variable Return On Equity value of minimum-maximum, of 151 14.353, with the average (mean) 1,288.23 and the rate of std. Deviation
of 1,928.069. Variable Debt to Equity Ratio the value of minimum-maximum, 493 of 799, with an average (mean) and rate of 86.26 std. Deviation amounted to 114,187. Variable stock price minimum 5, maximum of 22.325, with the average (mean) 978.18 and the rate of std. Deviation of 2,611.535.
3.2 A Classic Assumption Test Result
Test of Normality
Tabel 2. The Result of the test of Normality
Ket Asymp Sig (2.tailed) Std Description
Test (K-S) 0,565 0,05 Normal Distributed
Based on the table above, the test results showed that the normality of variables unstandarized residual value for sig 0.565 > 0.05 then it can be inferred the normal distributed data .
Multicollinearity Test
To know or no multicollinearity by looking at the value of VIF and Tolerance ", if the value is below 10 and the enormity of VIF Tolerance above 0.01 then it can be inferred that no symptoms of multicollinearity in the regression model.
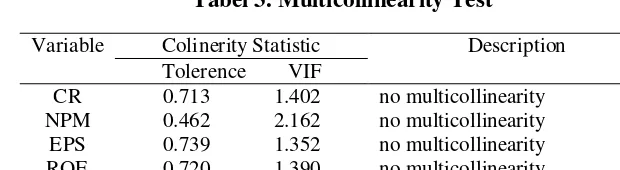
Tabel 3. Multicollinearity Test
Variable Colinerity Statistic Description
Tolerence VIF
CR 0.713 1.402 no multicollinearity
NPM 0.462 2.162 no multicollinearity
EPS 0.739 1.352 no multicollinearity
ROE 0.720 1.390 no multicollinearity
DER 0.853 1.173 no multicollinearity
The results of calculations indicate that multicollinearity all independent variable has a value of more than 0.01 tolerence (10%), meaning that there is no correlation between the free variables whose value is more than 95%. The results of the calculations also show that all variables have VIF is less than 10. So it can be concluded that there are no
symptoms of multicollinearity in
regression models are used.
Heteroskedastisitas Test
This test is used to find out or no Heteroskedastisitas can be done by looking at the magnitude of the value, if the significance niali sig > 0.05 then it can be inferred that no symptoms of Heteroskedastisitas.
Tabel 4. Test Result Heteroskedastisitas
Var thitung Sig. P value Conclusion
CR -1.282 0.202 P>0,05 No Heteroskedastisitas
NPM 2.920 0.056 P>0,05 No Heteroskedastisitas
EPS -0.958 0.339 P>0,05 No Heteroskedastisitas ROE -0.855 0.394 P>0,05 No Heteroskedastisitas DER -0.235 0.814 P>0,05 No Heteroskedastisitas
From the calculation results show
there is no disturbance of the
Heteroskedastisitas occurs in the
penduga model parameter estimation process, where there is no value thitung the sig. or p > 0.05. So overall it can be concluded that there is no problem of
Autocorrelation test
Tabel 5. Autocorrelation Test Result
D-W dL Du 4-du Criteria Ket
1,990 1,5219 1,7732 2,2268 1,7732<1,990<2,2268 Free Autocorrelation
The above autocorrelation test results show that the value of the D-W are free in the autocorrelation du < D-W < 4 – du <1.7732 < 1.990 < 2.2268, so it can be declared that there is no
disturbance autocorrelation in regression models. This means that the regression model is not affected by time series data retrieval.
Multiple Linear regression test
Tabel 6. Multiple Linear Regression Test Result
Coefficient thitung Sig.
Constants 36.528 37.810 0.000
CR -8.789 -3.692 0.000
NPM 0.007 6.559 0.000
EPS -2.903 -0.950 0.343
ROE 0.000 0.712 0.478
DER -0.017 -3.672 0.000
R2 0,609
F Statistic 19,070 0,000
From the results of the regression analysis can be composed of equations as follows :
Share Price = 36.528 – 8.789 (CR) + 0.007 (NPM) - 2.903 (EPS) + 0.000 (ROE) - 0,017 (DER)
The interpretation of these equations are as follows:
a = 36,528, is positive meaning that CR, NPM, EPS, ROE, and DER enhanced 1 unit change in the price
of shares in the listed
manufacturing firms in the year 2015 will BEI rose by one unit 36,528.
X1 =-8,789, is negative means that if variable CR improved one unit, then the prediction of stock price
manufacturing companies
registered in BEI year 2015 will be down by – 8,789 assuming other variables fixed
X2 = 0.007, is positive it means improved NPM variables one unit,
then the prediction of stock price
manufacturing companies
registered in BEI year 2015 will be up by 0.007 assuming other variables fixed
X3 =-2,903, is negative EPS increased variable means one unit change in
stock price manufacturing
companies registered in the year 2015 would drop BEI registration -2,903 assuming other variables fixed.
X4 = 0000, is positive it means variable ROE improved one unit change in the price of shares in the listed manufacturing firms BEI years 2015 of 0.000 assuming other variables fixed.
X5 =-0.017, is negative means that the variable DER one unit change
improved stock price
manufacturing companies
registered in BEI year 2015 will be down by -0.017assuming the other variables fixed
Test The Feasibility Of The Model(test F)
Tabel 7. A Model Feasibility Test Results (test F)
Model F hitung F tabel Sig Std Ket
Based on the above calculation shows that ƒ count of 19,070, meaning F count greater than F table (19,070 > 2,487). This means
that the model of influential stock price significantly to manufacturing companies registered in BEI 2014-2015 period.
Hypothesis Test (test t)
Tabel 8. Hypothesis Test Results (test t)
Ket thitung ttabel Sig. Std Description Influence Current Ratio against share price
Value thitung from the results
of the regression model of
calculation of Current Ratio above registration-3,692 greater than ttabel of 1,991 (-3,692 > 1,991) with the value of the sig 0.000 < 0.05, then Ho denied and Ha accepted means CR influential
stock price significantly to
negative. This means that the higher the Current Ratio the greater the company's ability to pay short-term obligations. The research is in line with the results of the research of Ferawati (2017), but not in line against share price
Value thitung from the results of the regression model calculations Net Profit Margin above of 6,559 greater than ttabel of 1,991 (6,559 > 1,991) with the value of the sig 0.000 < 0.05, then Ho denied and Ha accepted means of influential NPM significantly to stock prices. This means that the increasing value of Net Profit Margin then the
company's share price also
experienced an increase, otherwise
shares also decline. The research is in line with the results of the research of Affinanda (2015), but not in line with the research Lisnawati (2013) and Ferawati (2017) which States that the Net Profit Margin does not have an effect on stock prices.
The third hypothesis (H3) the influence of Earning Per Share against share price
Value of the thitung of the results of calculation of a regression model Earning Per Share above
registration-0960 smaller than
ttabel of 1,991 (-0,960 < 1,991) with the value of the sig 0343 > 0.05, then Ho accepted and rejected Ha means the EPS has no effect
against a significant stock
price.This means, the lower
Earning Per Share means
management have not managed to satisfy shareholders, the higher the
Earning Per Share increased
shareholders ' welfare. The research is in line with the research Meythi and Linda (2011), but not in line with the research Trisnawati (2015) and Ferawati (2017) stating that the Earning Per Share effect on stock prices.
The fourth hypothesis (H4) influence of Return On Equity against the share price
smaller than ttabel of 1,991 (-0.960 < 1,991) with the value of the sig 0.478 > 0.05, then Ho accepted and rejected Ha means ROE has no
effect significantly to stock
prices.This means that the lower the Return On Equity then the position
research Lisnawati (2013),
Trisnawati (2015) and Al Qaisi et al (2016), but not in line with the research Ferawati (2017) which States that the Return On Equity effect on stock prices.
The fifth hypothesis (H5) the influence of the Debt to Equity Ratio against share price
Value thitung from the results of the calculation of a regression model of the Debt to Equity Ratio above registration-3,672 greater than ttabel of 1,991 (-3,672 > 1,991) with the value of the sig 0,000 > 0.05, then Ho rejected and Ha received significant negative effect means DER against stock prices.This means that the larger the Debt to Equity Ratio indicates that capital structure more utilizing debt compared to the capital itself, rather the lower the Debt to Equity Ratio the higher the stock price of the company. The research is in line with research Wijaya et al (2014) and Affinanda (2015), but not in line with the research Sulia (2013) and Trisnawati (2015) stating that the Debt to Equity Ratio not berpengruh against stock prices.
Test Coefficient Determination(R2)
Tabel 9TestResults The Coefficient Of Determination(R2)
R Square Keberartian R Square Description
0.609 60.9% 39.1% variation of stock price
affected by other factors
From testing with multiple
regression analysis have been
implemented retrieved (R2) of 0.609%. 39.1% still around shows the variations in share prices that are affected by other factors not examined in this study.
4. CONCLUTION AND SUGGESTION
Of the purpose of this research is to know how the Current Ratio, Net Profit Margin, Earning Per Share, Return On Equity, and Debt to Equity Ratio against the stock price. Type of this research is quantitative research. Sampling method with the method of purposive sampling. The sample meets the criteria as much
as 84 manufacturing companies listed on the Indonesia stock exchange period 2014-2015 so obtained 168 data observations. Methods of data analysis used in the study include descriptive statistics, classic assumption test (test of
normality, test multicollinearity,
heterokedastisitas test, autocorrelation test), test the hypothesis (multiple linear regression analysis, test the feasibility of the model, t-test, analysis and the coefficient of determination R2). Based on the results of testing the hypothesis that the independent variables Current Ratio, Net Profit Margin, and the Debt to Equity Ratio effect significantly to the stock price, while Earning Per Share and Return On Equity have no effect significantly to the stock price.
research is recommended to increase the research variables. 3) for further research are recommended to add to the research period.
REFERENCE
Affinanda, Ade; Yuyetta, Etna Nur Afri;.
(2015). Pengaruh Rasio
Keuangan Terhadap Return
Saham Perusahaan Dalam
Indexs LQ45 Tahun 2010-2013. Journal of Accounting. Volume 4, Nomor 2. ISSN (Online):
2337-3806.
http://ejournal-s1.undip.ac.id/index.php/accoun ting , 1-11.
Budi, A. (2016). Analisis Pengaruh Current
Ratio dan Profit Margin
Terhadap Harga Saham di
Perusahaan Makanan dan
Minuman yang Terdaftar di Bursa Efek Indonesia. Jurnal FE. Universitas Medan Area.
http://ojs.uma.ac.id/index.php .
Erari, Anita;. (2014). Analisis Pengaruh Current Ratio, Debt to Equity Ratio, dan Return on Asset Terhadap Return Saham pada Perusahaan Pertambangan di
BEI. Jurnal Manajemen dan
Harga Saham Perusahaan
Manufaktur Sub Sektor
Makanan dan Minuman yang
Terdaftar di Bursa Efek
Indonesia periode 2012-2016. Jurnal Universitas Nusantara
PGRI Kediri.
http://simki.unpkediri.ac.id .
Kasmir;. (2010). Pengantar Manajemen
Keuangan. Edisi Kesatu.
Jakarta: Kencana Prenada Media Group.
Lisnawati, Iis;. (2013). Analisis Pengaruh Profitabilitas Terhadap Harga
Saham. Jurnal Akuntansi FE
Universitas Siliwangi.
http://docplayer.info/379695398
-Analisis-profitabilitas-terhadap-harga-saham.html .
Sulia;. (2013). Analisis Faktor-Faktor Yang Mempengaruhi Harga Saham. Jurnal Wira Ekonomi Mikrosil.
Volume 3 No. 01 .
Trisnawati, M. (2015). Analisis Pengaruh Current Ratio, Debt to Equity Ratio, Return On Equity, Net Profit Margin, dan Earning Per Share Terhadap Harga Saham
Studi Kasus Food and
Beverages yang Terdaftar di Bursa Efek Indonesia Pada Thun 2009-2012. Jurnal Universitas Dian Nuswantoro Semarang.
http://eprints.dinus.ac.id/17195 .
Usman, Marzuki; Riphat, Singgih; Ika, Syarif;. (1997). Pengetahuan
Dasar Pasar Modal. Jakarta:
IBI.
Wijaya, Henryanto; Iva; Darmawan, Harry;.
(2014). Analisis Faktor
Fundamental Terhadap Harga
Saham Pada Perusahaan
Manufaktur di BEI Periode 2009-2011. Jurnal Akuntansi.
Volume XVIII/02/Mei/2014.
ISSN1410-3591 .
http://www.idx.co.id/id-id/beranda/perusahaantercatat/la porankeuangandantahunan.aspx, diakses tanggal 7 November 2017. (n.d.).
Samrotun, Yuli Chomsatu; Kurniawati, Lintang;. (2015). Modul Statistik
Ekonomi II. Surakarta: Fakultas
Ekonomi Uniba Surakarta.
Sugiyono;. (2012). Statistika Untuk
Penelitian. Bandung: Alfabeta.
Sunyoto, Danang;. (2013). Metodologi
Penelitian. Edisi Kesatu.