PERCENT FAT MASS AND BODY MASS INDEX AS CARDIORESPIRATORY
FITNESS PREDICTORS IN YOUNG ADULTS
(Persentase lemak dan indeks massa tubuh sebagai prediktor kebugaran
kardiorespiratorik pada dewasa muda)
Mira Dewi
1, Lilik Kustiyah
1*, Mury Kuswari
21Departemen Gizi Masyarakat, Fakultas Ekologi Manusia (FEMA), Institut Pertanian Bogor, Bogor 16680 2Prodi Ilmu Gizi, Fakultas Ilmu-Ilmu Kesehatan, Universitas Esa Unggul, Jakarta 11510
ABSTRACT
The present study aimed to analyze the association between body fatness measures, i.e. body mass index (BMI) and percent fat mass (% FM) with cardiorespiratory fitness (CRF) in young adults. Seventy five undergraduate students aged 19-21 years were included in this cross sectional study. Body composition was assessed by tetra polar Bioelectrical Impedance Analysis method, and CRF was determined as VO2 max level by conducting Balke test and flexibility by sit-and-reach test. Regression tests were performed to assess the associations between the body fatness measures and CRF. The mean (SD) % FM and BMI were 25.6 (8.3) % and 22.4 (4.2) kg/m2, respectively. Both BMI and % FM were inversely associated
with VO2 max and flexibility. The associations of % FM with each CRF measure were stronger (% FM-VO2 max: R2=0.45, p<0.0001; % FM-flexibility: R2=0.16, p<0.0001) than those of BMI (BMI-VO
2
max: R2= 0.12, p=0.002; BMI-flexibility: R2=0.07, p<0.0001). Including gender as a variable predictor
greatly improved almost all associations. We suggest that %FM is a better predictor for VO2max than BMI. Further studies are needed to elucidate the relationships of body fatness measures adjusted for potential confounding factors with CRF measures other than VO2 max.
Keywords: body mass index, cardiorespiratory fitness, percent fat mass
ABSTRAK
Penelitian ini bertujuan untuk menentukan hubungan antara persentase lemak tubuh (PLT) dan indeks massa tubuh (IMT) dengan kebugaran kardiorespiratorik (KKR) pada dewasa muda. Penelitian menggunakan desain potong lintang dengan melibatkan 75 orang mahasiswa usia 19-21 tahun. PLT ditentukan dengan metode tetra polar Bioelectrical Impedance dan KKR ditentukan dengan VO2max
berdasarkan uji Balke dan fleksibilitas dengan uji sit-and-reach. Hubungan antara PLT dan IMT dengan
KKR dianalisis dengan uji regresi. Rata-rata (standar deviasi) dari PLT dan IMT berturut-turut adalah 25,6 (8,3)% dan 22,4 (4,2) kg/m2. Baik PLT maupun IMT berbanding terbalik dengan nilai VO
2 max
dan fleksibilitas. Korelasi antara PLT dengan kedua komponen KKR lebih kuat (PLT-VO2 max: R
2=0,45
p<0,0001; PLT-fleksibilitas: R2=0,16 p<0,0001) dibanding IMT (IMT-VO
2 max: R
2=0,12 p=0,002;
IMT-fleksibilitas: R2=0,07 p<0,0001). Memasukkan gender sebagai prediktor variabel memperkuat semua
korelasi kecuali antara PLT dan fleksibilitas. Diperlukan studi lebih lanjut untuk mempelajari hubungan antara komposisi tubuh termasuk faktor perancu potensial dengan fleksibilitas dan komponen KKR
lainnya.
Kata kunci: indeks massa tubuh, kebugaran kardiorespiratorik, persen lemak tubuh
*Korespondensi: Telp: +628121105698, Surel: lilik.kustiyah@gmail.com
INTRODUCTION
Obesity is considered as a major health problem due to its increasing prevalence and complications such as type 2 diabetes mellitus and cardiovascular diseases. Recent data showed that obesity prevalence among young adults va-ries between 10-40% (Hossain et al.2007). Ex-cess body fat, particularly visceral fat, as seen in obesity is an important risk of cardiovascu-lar diseases (Lim & Meigs 2013, Neeland et al. 2013). It is well recognized that body fat plays an important role in the cardiorespiratory health and is inversely associated with cardiorespiratory
fitness (CRF) (Aphamis et al. 2014, Gajewska et
al. 2015, Hsieh et al. 2014).
A common indicator for body fat that has been used in studies on the relationship between
body fat and CRF is body mass index (BMI), i.e.
body weight per height square (Hsieh et al. 2014, Hung et al. 2014, Mota et al. 2009). In com-parison to other methods of body composition assessment, BMI is easy to be assessed in most
people of all age groups, does not require specific
skill, and less costly. There have been studies that
showed the significant correlation between BMI
and CRF level (Gajewska et al. 2015, Hsieh et al.
2014, Hung et al. 2014). However, as in BMI the fat mass is roughly assessed by body weight, the relationship in certain groups of people may be weakened when BMI is used rather than body fat measures such as fat mass (FM) and % FM. For examples, Pribis et al. (2010)studied the relation-ship among college students and reported that in
males, CRF measured as VO2max was correlated
stronger with % FM than with BMI (R2=0.24 vs 0.11). Similarly, Tompuri et al. (2014) measured body sizes (weight and height), body composi-tion (FM, % FM and fat free mass (FFM)) and VO2 max of 38 children and found that FM, but
not body size, was significantly correlated with
-VO2 max (R2=0.41).
The CRF level and its relationship with
body fat vary across age groups and ethnicities (Duncan et al. 2009). To date, such relationship has not been extensively studied in Indonesian young adults. Therefore, the present study was aimed to analyze the association between BMI
and CRF, and between percent fat mass with CRF
in Indonesian young adults.
METHODS
Design, place, and time
This was a cross-sectional study. This study was conducted in Bogor Agricultural University,
Sample size and sampling procedure
Seventy five healthy female and male stu
-dents (19-21 years old) of the third year in Nu-tritional Science Program, Faculty of Human Ecology, Bogor Agricultural University were included as subjects. Students were invited to participate by class announcement. Those with history of cardiac and lung diseases and smoking were excluded.
Data collection and procedure
Body mass index. Body weight was mea-sured by a digital scale. Height was meamea-sured by a stadiometer in the standing position with the heels, hip, shoulders, and back of the head at-tached to the wall. BMI is calculated as weight (in kg)/height2 (in m2).
Percent fat mass. Body composition (FM, % FM and FFM) was assessed using a tetra po-lar Bioelectrical Impedance Analyzer (BIA).
Compared with magnetic resonance imaging and
dual energy X-ray absorptiometry, no systematic biases were found for % FM measured by this method (Bosy-Westphal et al. 2008).
VO2 max. VO2 max was determined by Balke test as described earlier (Balke 1963). After 10 minutes of warming up, the subjects were en-couraged to run as fast as possible for 15 minutes. The distance achieved was recorded to the near-est 10 meter. The VO2 max was then calculated using the following formula (Horwill 1991):
%VO2 max (ml/kg/min) = [((distance covered (m) /15) – 133) x 0.172] + 33.3
Flexibility. Flexibility was determined by sit-and-reach (SR) test developed by Wells and
Dillon (1952). This test specifically measures the flexibility of the lower back and hamstring. The subjects sat on the floor with their legs straight
ahead. The soles of the feet were attached to the
box. The ruler was placed on the floor between
the subject’s legs. With one hand placed on the other, the subject reached forward. The maximum distance reached was then measured in the nearest cm.
Data processing and analysis
Bivariate correlations were conducted between all predictors and outcome variables. Multiple regressions including body fat, gender and gender-body fat interaction as factors were conducted individually for each pair of body fat
RESULTS AND DISCUSSION
A total of 75 subjects, 54 females and 21 males, participated in this study. The descriptive characteristics of the subjects are presented in
Ta-ble 1. There were no significant differences found
between females and males in term of their age
and BMI. However, significant differences were
found between the two genders in all body
com-position variables and CRF measures (Table 1).
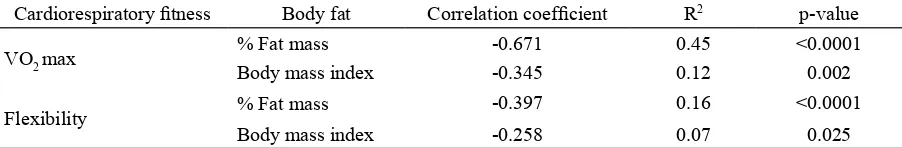
Bivariate correlations derived from the Pearson procedure are given in Table 2. Both % FM and BMI were negatively correlated with all
CRF measures, and the correlations were stron
-ger for % FM than BMI (R2=0.45 vs 0.12 for VO 2
max and 0.16 vs 0.07 for flexibility).
Multiple regressions including gender and its interaction with the corresponding body fat variable as factors were conducted to determine
if the significant correlations remain when gender
is taking into account. Interaction terms between body fat measures and gender in all models were
found not significant and therefore were dropped
from the model and the regression were conduct-ed with the rconduct-educconduct-ed model. Gender was found
not significant in % FM and flexibility associa
-tion model and so this factor was dropped from this model.
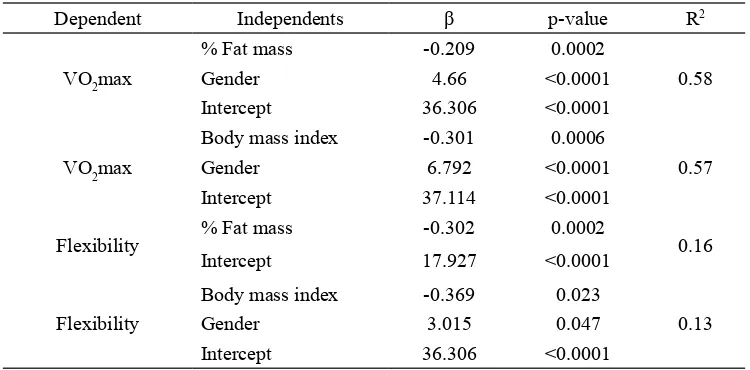
The associations between VO2 max and body fat measures that seem to be stronger for % FM than BMI became more equal when gen-der was taken into account. As much as 58% and
57% of the total variability in VO2 max was ex-plained by the % FM-gender and BMI-gender models, respectively. On the other hand, models that included body fat measures (% FM and BMI) explained only small proportion of variability in
flexibility (Table 3).
The present study sought to evaluate the relationships between two body fat measures, i.e.
BMI and % FM and CRF. The negative corre
-lations between body fat measures and CRF pa
-rameters as found in this study were as expected and similar to other reports (Aphamis et al. 2014, Gajewska et al. 2015, Moliner-Urdiales et al. 2011, Neeland et al. 2013, Tompuri et al. 2014, Wang et al. 2011, Wu et al. 2015, Koley 2006), showing consistency of the inverse relationship between the two variables.
In obese individuals, the oxygen
consump-tion per body mass unit is significantly reduced due to the excessive fat which influence the heart
function. Fat accumulation in muscle results in failure of the muscles to use oxygen effectively, and thereby reduces the VO2 max level (Chatter -jee et al. 2005). It is important to point out that only less than 10% of our subjects were obese and thus, our study suggested that the unfavor-able effect of body fat mass on VO2 max is appa-rent even within BMI category of less than obese. BMI does not accurately measure the body fat
and therefore the finding should be confirmed
with the more sophisticated method to measure body fat such as 2, 3 or 4 compartments model.
Characteristics Females
(n=54)
Males (n=21) Age (year) 19.94 + 0.53 20.00 + 0.63 % Fat mass 28.8 ± 5.62 17.28 ± 8.37** Fat mass (kg) 16.30 ± 6.68 11.23 ± 7.76** Fat free mass (kg) 38.43 ± 4.80 49.40 ± 4.25** Body mass index (kg/m2) 22.63 + 4.21 21.72 + 4.29
VO2 max (ml/kg/min) 30.30 ± 2.67 37.36 ± 4.44** Flexibility (cm) 9.1 ± 5.86 12.6 ± 6.83*
*significant at α = 0.05; **significant at α = 0.01
Table 1. Descriptive characteristics of subjects
Table 2. Bivariate correlations between % fat mass, body mass index, and cardiorespiratory fitness
measures
Cardiorespiratory fitness Body fat Correlation coefficient R2 p-value
VO2 max % Fat mass -0.671 0.45 <0.0001
Body mass index -0.345 0.12 0.002
Flexibility % Fat mass -0.397 0.16 <0.0001
Our study showed that in comparison to BMI, % FM had stronger correlation with VO2 max (R2=0.45 vs 0.12). However, the correlations were greatly improved, especially for BMI, and about equal when gender factor was included in the models (R2=0.58 for % FM and 0.57 for BMI). This suggests the importance of taking this fac-tor into account when studying such relationship. According to our model, within the same BMI or % FM, males would have higher VO2 max than females by 6.79 and 4.66 units, respectively.
The differential effect of genders on body fat measures and VO2 max relationship were shown in some studies. In a similar age group with this study, Pribis et al. (2010) reported stronger correlations between BMI and VO2 max, and also between % FM and VO2 max in women than in men (R2=0.17 vs 0.11 and 0.24 vs 0.17, respectively). Similarly, Dagan et al. (2013) showed that in adult men and women aged 50 + 8 years, the correlations between BMI and VO2 max were found stronger in women than men (R2=0.26 vs 0.08). In both studies, the mul-tiple regression models were run separately for males and females therefore a model including gender as a dichotomous variable was not com-pleted. We found that the interactions between
BMI and % FM, and gender were not significant
which means that the amount of unit decrease in VO2 max per one unit increase of both BMI or % FM was not affected by type of gender. Add-ing gender factor results in great improvement of the correlations between BMI and VO2 max but not as great for correlations between % FM and VO2 max; this fact suggests that % FM is a better proxy for VO2 max rather than BMI.
Other factors have been shown to affect
CRF such as physical activity (PA) level (Gu
-tin et al. 2005, Myers et al. 2015) and smoking status (Kendzor et al. 2015). We controlled the smoking status by excluding those who smoked, however, we did not include PA and this is one of the study weaknesses.
Flexibility of muscle was another measure
of CRF included in the present study. Our study suggest that flexibility was inversely correlated
with both % FM and BMI, and the correlation was stronger with % FM (R2=0.16, p<0.0001 vs R2=0.07, p=0.025, respectively). Gender was
found to be a significant factor for flexibility in
the model with BMI, but not in that with % FM. BMI and gender explained 13% of variability in
flexibility. Within the same BMI, males have 3 cm higher flexibility than the females.
There are only few studies on the relationship
between body fat measures and flexibility, and the
results seem to be vary across groups. Saghand and Gholami (2013) conducted a study in 450 female students aged 19-25 years and found a
positive weak correlation between flexibility
as assessed by SAR test and BMI, but not with % FM. In a study involving 102 female volley players around 15 years of age, Nikolaidis (2013) reported a weak positive correlation between
flexibility by SAR and BMI (r =0.22, p<0.05).
In elderly (>60 years of age), Silva et al. (2013) also showed a weak positive correlation between
flexibility and BMI (R2=0.03, p<0.05) in males
but not in females. In this study, flexibility was
measured by a method designed for elderly people, i.e. ‘pick up a pen’. Similar to our study, Miyatake et al. (2004) showed that the flexibility tends to be lower in women with overweight BMI and abdominal obesity, although the association
did not reach significance level. The present study
and others suggest that the relationship of both
Table 3. Associations between cardiorespiratory fitness and body fat measures
Dependent Independents β p-value R2
VO2max
% Fat mass -0.209 0.0002
0.58
Gender 4.66 <0.0001
Intercept 36.306 <0.0001
VO2max
Body mass index -0.301 0.0006
0.57
Gender 6.792 <0.0001
Intercept 37.114 <0.0001
Flexibility % Fat mass -0.302 0.0002 0.16 Intercept 17.927 <0.0001
Flexibility
Body mass index -0.369 0.023
0.13
Gender 3.015 0.047
body fat measures with flexibility was weaker
than with VO2 max. Yet, this has not been clearly elucidated and warrants further investigation.
Our study is among few studies that pro-vide information on the comparison between
dif-ferent body fat measures on CRF measures. This
knowledge is particularly important when con-sidering and interpreting different variables of
body composition in studies on CRF. In addition, our study also used two different CRF measures
and thereby contribute to the knowledge of how they responded to different body fat measures. However, our study has some limitations. First, the sample was relatively small and not random-ized. Second, the range of BMI and % FM of our subjects, although normally distributed, were relatively narrow and may not be representative to the age population. Third, we did not include other possible source of variability such as PA in
the models. Considering these limitations, the in -ference has to be taken carefully.
CONCLUSION
In conclusion, our study showed that %
FM and BMI were inversely correlated with CRF,
and gender was found to strengthen the correla-tion, especially with BMI. Body fat has greater effect on VO2 max than on flexibility. In healthy young adults such as our group, both % FM and
BMI can be used as predictors of CRF especially
for VO2 max. We suggested that %FM is a better predictor for VO2 max than BMI. Further studies are needed to elucidate the relationships of body fatness measures and potential confounding
fac-tors with CRF measures other than VO2 max.
REFERENCES
Aphamis G, Giannaki CD, Tsouloupas CN, Ioan
-nou Y, Hadjicharalambous M. 2014. The
relationship between physical fitness and
obesity among a sample of adolescents in cyprus. Int J Adolesc Med Health. http:// dx.doi.org/10.1515/ijamh-2014-0054
Balke B. 1963. A simple field test for the assess
-ment of physical fitness. Rep 63-6. Rep Civ Aeromed Res Inst Us 53:1-8.
Bosy-Westphal A, Later W, Hitze B, Sato T,
Kos-sel E, Gluer CC, Heller M, Muller MJ.
2008. Accuracy of bioelectrical impedance consumer devices for measurement of body composition in comparison to whole body magnetic resonance imaging and dual x-ray absorptiometry. Obes Facts
1(6):319-324. http://dx.doi.org/10.1159/000176061.
Chatterjee S, Chatterjee P, Bandyopadhyay A. 2005. Cardiorespiratory fitness of
obese boys. Indian J Physiol Pharmacol 49(3):353-357.
Dagan SS, Segev S, Novikov I, Dankner R. 2013. Waist circumference vs body mass index
in association with cardiorespiratory fit -ness in healthy men and women: a cross sectional analysis of 403 subjects. Nutr J 12(12). http://dx.doi.org/10.1186/1475-2891-12-12.
Duncan JS, Duncan EK, Schofield G. 2009. Ac
-curacy of body mass index (BMI) thres-holds for predicting excess body fat in girls
from five ethnicities. Asia Pac J Clin Nutr
18(3):404-411.
Horwill F. 1991. Obsession For Running - A
Lifetime In Athletics. London: Colin Da
-vies Printers.
Gajewska E, Kalinska K, Bogdanski P,
Sobies-ka M. 2015. Cardiorespiratory endur
-ance in relation to body mass in Polish rural children: Preliminary Report. Homo 66(3):278-285.
Gutin B, Yin Z, Humphries MC, Barbeau P. 2005.
Relations of moderate and vigorous
physi-cal activity to fitness and fatness in adoles
-cents. Am J Clin Nutr 81(4):746-750.
Hossain P, Kawar B, El Nahas M. 2007. Obe-sity and diabetes in the developing world a growing challenge. N Engl J Med 356 (3):213-215.http://dx.doi.org/10.1056/ NEJMp068177.
Hsieh PL, Chen ML, Huang CM, Chen WC, Li CH, Chang LC. 2014. Physical activity,
body mass index, and cardiorespiratory
fitness among school children in Taiwan: A Cross-Sectional Study. Int J Environ
Res Public Health 11(7): 275-285. http:// dx.doi.org/10.3390/ijerph110707275.
Hung TH, Liao PA, Chang HH, Wang JH, Wu
MC. 2014. Examining the relationship be
-tween cardiorespiratory fitness and body
weight status: empirical evidence from a population-based survey of adults in Tai-
wan.http://www.ncbi.nlm.nih.gov/pmc/ar-ticles/PMC4214098/.
Kendzor DE, Finley CE, Barlow CE, Whitehurst
TA, Businelle MS, Balasubramanian BA, Radford NB, Shuval K. 2015. The
asso-ciation of fitness with reduced cardiometa
abdominal subcutaneous adipose tissue with markers of cardiac and metabolic risk in obese adults. Obes (Silver Spring) 21(9):E439-447.http://dx.doi.org/10.1002/ oby.20135.
Nikolaidis PT. 2013. Body mass index and body fat percentage are associated with
de-creased physical fitness in adolescent and
adult female volleyball players. J Res Med Sci 18(1): 22-26.
Pribis P, Burtnack CA, Mckenzie SO, Thayer J.
2010. Trends in body fat, body mass
in-dex and physical fitness among male and
female college students. Nutrients 2(10): 1075-1085.http://dx.doi.org/10.3390/nu21 01075.
Saghand MR, Gholami M. 2013. The Relation-ship of BMI, fat percentage, and waist-hip
ratio to physical fitness factors in female
students. J Basic Appl Sci Res 3(3): 1273-1278.
Silva Nde A, Menezes TN, Melo RL, Pedraza DF.
2013. Handgrip strength and flexibility and
their association with anthropometric vari-ables in the elderly. Rev Assoc Med Bras 59(2):128-135.http://dx.doi.org/10.1016 /j.ramb. 2012.10.002.
Tompuri T, Lintu N, Savonen K, Laitinen T, Laaksonen D, Jaaskelainen J, Lakka TA.
2014. Measures of cardiorespiratory fit -ness in relation to measures of body size
and composition among children. Clin
Physiol Funct Imaging. http://dx.doi. org/10.1111/cpf.12185
Wang PG, Gong J, Wang SQ, Talbott E.O, Zhang B, He QQ. 2011. Relationship of body fat
and cardiorespiratory fitness with cardio
-vascular risk in Chinese Children. Plos
One 6(11):E27896.
Wu MC, Palomaki S, Heikinaro-Johansson P,
Huotari P. 2015. Cardiorespiratory per
-formance and physical activity in normal
weight and overweight finnish adolescents
from 2003 To 2010. Scientific world jour
-nal 33(6): 588-596. Wells K, Dillon E. 1952. The sit and reach. A test
of back and leg flexibility. Res Q Exerc
Sport (23):115-118.
Koley S. 2006. Association of cardio respiratory
fitness, body composition and blood pres
-sure in collegiate population of Amritsar, Punjab, India [Online]. The Internet Jour-nal Of Biological Anthropology.
Avail-able: https://Ispub.Com/Ijba/1/1/4403.
Lim S, Meigs JB. 2013. Ectopic fat and
cardio-metabolic and vascular risk. Int J Cardiol
169(3):166-76. http://dx.doi.org/10.1016/j. ijcard.2013.08.077.
Miyatake N, Takanami S, Kawasaki Y, Fujii M. 2004. Relationship between visceral fat
accumulation and physical fitness in Ja-panese Women. Diabetes Res Clin Pract
64(3): 173-179.
Moliner-Urdiales D, Ruiz JR, Vicente-Rodriguez G, Ortega FB, Rey-Lopez JP,
Espana-Romero V, Casajus JA, Molnar D, Wid
-halm K, Dallongeville J, et al. 2011. Associations of muscular and
cardiorespi-ratory fitness with total and central body
fat in adolescents: The Helena Study. Br J Sports Med 45(2):101-108. http://dx.doi. org/10.1136/bjsm.2009.062430.
Mota J, Ribeiro JC, Carvalho J, Santos MP,
Martins J. 2009. Cardiorespiratory fit
-ness status and body mass index change over time: A 2-year longitudinal study in elementary school children. Int J Pe-diatr Obes 4(4):338-342. http://dx.doi. org/10.3109/17477160902763317.
Myers J, Mcauley P, Lavie CJ, Despres JP, Arena
R, Kokkinos P. 2015. Physical activity and
cardiorespiratory fitness as major markers
of cardiovascular risk: their independent and interwoven importance to health status.
Prog Cardiovasc Dis 57(4): 306-314.http://
dx.doi.org/10.1016/j.pcad.2014.09.011.
Neeland IJ, Ayers CR, Rohatgi AK, Turer AT,