ESS
-
E
XTENSION OF
S
OCIAL
S
ECURITY
Fiscal Space for Social Protection and the SDGs:
Options to Expand Social Investments in 187 Countries
Isabel Ortiz
Matthew Cummins
Kalaivani Karunanethy
ESS Working Paper No. 48
INTERNATIONAL LABOUR OFFICE, GENEVA UNICEF, NEW YORK
Copyright © International Labour Organization 2017 Second edition 2017
Publications of the International Labour Office enjoy copyright under Protocol 2 of the Universal Copyright Convention. Nevertheless, short excerpts from them may be reproduced without authorization, on condition that the source is indicated. For rights of reproduction or translation, application should be made to ILO Publications (Rights and Permissions), International Labour Office, CH-1211 Geneva 22, Switzerland, or by email:
pubdroit@ilo.org. The International Labour Office welcomes such applications.
Libraries, institutions and other users registered with reproduction rights organizations may make copies in accordance with the licences issued to them for this purpose. Visit www.ifrro.org to find the reproduction rights organization in your country.
ILO Cataloguing in Publication Data
Fiscal Space for Social Protection and the SDGs: Options to Expand Social Investments in 187 Countries / Isabel Ortiz, Matthew Cummins, Kalaivani Karunanethy; International Labour Office. - Geneva: ILO, 2017
(Extension of Social Security Series No. 48)
International Labour Office Social protection Department
social protection / fiscal space / resource mobilization / public expenditures / tax / social spending / social investments / development policy / equity /
The designations employed in ILO publications, which are in conformity with United Nations practice, and the presentation of material therein do not imply the expression of any opinion whatsoever on the part of the
International Labour Office, UNICEF or UNWOMEN, concerning the legal status of any country, area or territory or of its authorities, or concerning the delimitation of its frontiers.
The responsibility for opinions expressed in signed articles, studies and other contributions rests solely with their authors, and publication does not constitute an endorsement by the International Labour Office, UNICEF or UNWOMEN, of the opinions expressed in them.
Reference to names of firms and commercial products and processes does not imply their endorsement by the International Labour Office, UNICEF or UNWOMEN, and any failure to mention a particular firm, commercial product or process is not a sign of disapproval.
ILO publications and electronic products can be obtained through major booksellers or ILO local offices in many countries, or direct from ILO Publications, International Labour Office, CH-1211 Geneva 22, Switzerland. Catalogues or lists of new publications are available free of charge from the above address, or by email: pubvente@ilo.org
Visit our web site: www.ilo.org/publns
The editor of the series is the Director of the Social Protection Department, ILO. For more information on the series, or to submit a paper, please contact:
Isabel Ortiz, Director Social Protection Department International Labour Organization
4 Route des Morillons
CH-1211 Geneva 22 Switzerland
Tel. +41.22.799.6226 • Fax: +41.22.799.79.62
Executive Summary
It is often argued that social protection is not affordable or that government expenditure cuts are inevitable during adjustment periods. But there are alternatives, even in the poorest countries. This working paper offers eight options that should be explored to expand fiscal space and generate resources to achieve the Sustainable Development Goals (SDGs), realize human rights and invest in women and children. These include:
1. Re-allocating public expenditures;
2. Increasing tax revenues;
3. Expanding social security coverage and contributory revenues;
4. Lobbying for aid and transfers;
5. Eliminating illicit financial flows;
6. Using fiscal and foreign exchange reserves;
7. Managing debt: borrowing or restructuring existing debt and;
8. Adopting a more accommodative macroeconomic framework.
All of the financing options described in this paper are supported by policy statements of the United Nations and international financial institutions. Governments around the world have been applying them for decades, showing a wide variety of revenue choices. As this paper demonstrates, examples abound:
Costa Rica and Thailand reallocated military expenditures for universal health. Egypt created an Economic Justice Unit in the Ministry of Finance to review
expenditure priorities.
Indonesia, Ghana and many other developing countries are using fuel subsidies to
develop social protection programmes.
A large number of countries are increasing taxes for social investments – not only on
consumption (generally regressive) but also on income, corporate profit, property, natural resource extraction. Bolivia, Mongolia and Zambia are financing universal old-age pensions, child benefits and other schemes from taxes on mining and gas.
Brazil used a financial transaction tax to expand social protection coverage. Ghana, Liberia and Maldives have introduced taxes on tourism.
Argentina, Brazil, Tunisia, Uruguay, and many others expanded social security
coverage and contributory revenues.
Algeria, Mauritius, Panama among others have complemented social security revenues
with high taxes on tobacco.
Other countries launched lotteries to supplement social spending, like China’s Welfare Lottery or Spain’s ONCE Lottery for the social inclusion of the blind.
A number of lower income countries are receiving North-South and South-South
transfers, like El Salvador and Guinea-Bissau, while other countries are fighting the large illicit financial flows such by cracking down on tax evasion.
Chile, Norway and Venezuela, among others, are using fiscal reserves to support social
Colombia launched the first Social Impact Bond in developing countries in 2017, an
innovative PPP; South Africa issued municipal bonds to finance basic services and urban infrastructure to redress financing imbalances after the Apartheid regime.
More than 60 countries have successfully re-negotiated debts, and more than
20 defaulted/repudiated debt, such as Ecuador, Iceland and Iraq, using savings from debt servicing for social programs.
A significant number of developing countries have used deficit spending and more
accommodative macroeconomic frameworks during the global recession to attend to pressing demands at a time of low growth, and to support socio-economic recovery.
Each country is unique, and all options should be carefully examined – including the potential risks and trade-offs associated with each opportunity – and considered in national social dialogue. Given the importance of public investments for human rights, jobs and social protection, it is imperative that governments explore all possible alternatives to expand fiscal space to promote national socio-economic development and the SDGs.
JEL Classification: F35, H12, H2, H5, H6, H62, H63, I38, O2, O23
Contents
Page
Executive Summary ... iii
Acknowledgements ... ix
1. Introduction: Fiscal space exists in all countries ... 1
2. Reprioritizing public spending ... 5
3. Increasing tax revenues ... 8
3.1. Consumption/sales taxes ... 9
3.2. Income taxes ... 10
3.3. Corporate taxes and taxes to the financial sector ... 11
3.4. Natural resource extraction taxes ... 12
3.5. Import/export tariffs ... 14
3.6. Other taxes ... 16
4. Expanding social security coverage and contributory revenues ... 19
5. Lobbying for aid and transfers ... 22
5.1. More North-South transfers: Official Development Assistance (ODA) ... 22
5.2. South-South transfers ... 25
6. Eliminating illicit financial flows... 28
6.1. Curtailing South-North transfers... 28
6.2. Fighting illicit financial flows ... 28
7. Using fiscal and foreign exchange reserves ... 31
7.1. Fiscal reserves ... 31
7.2. Central bank foreign exchange reserves ... 34
8. Managing debt: Borrowing and debt restructuring ... 38
8.1. Borrowing ... 38
8.2. Debt restructuring ... 41
9. A more accommodating macroeconomic framework ... 46
9.1. More accommodative fiscal policy ... 46
9.2. More accommodative monetary policy ... 49
10. Concluding: Social dialogue on fiscal space options ... 52
Bibliography ... 55
Annexes 1. Selected fiscal space indicators for 187 countries ... 63
List of tables
1. Matrix of fiscal space strategies, selected countries ... 3
2. Developing countries that lowered income tax rates for the top income brackets, 2014 ... 10
3. Aid concentration and neglect, 2008-12 ... 23
4. Net transfer of financial resources to developing economies, 1998-2010 ... 28
5. Exporting illicit capital and health spending in developing countries, latest year available ... 29
6. Sovereign Wealth Funds based on fiscal reserves, June 2014 ... 33
7. Foreign exchange reserve adequacy in selected developing countries, 2013 ... 36
8. Real fiscal deficits and health spending in 38 Sub-Saharan African countries, 2014 ... 47
9. Safe inflation thresholds for developing countries ... 50
10. Developing countries with low inflation rates, 2014 forecasts ... 51
List of figures 1. Total government expenditure in selected countries, 2014 ... 2
2. Taxes on goods/services and overall tax revenue by income groups, 2000-11 ... 9
3. Fiscal revenues from the mining sector in Zambia ... 14
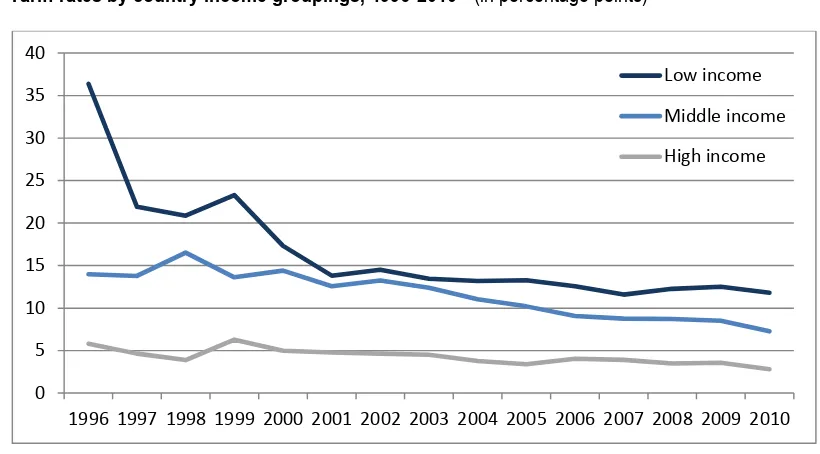
4. Tariff rates by country income groupings, 1996-2010 ... 15
5. Ratio of social security contributions to public social protection expenditure ... 19
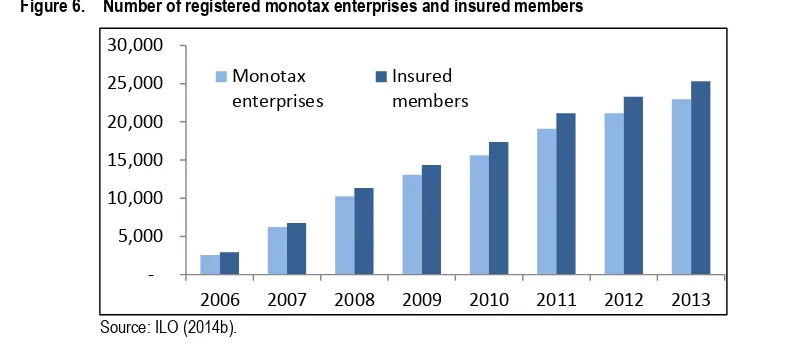
6. Number of registered monotax enterprises and insured members ... 21
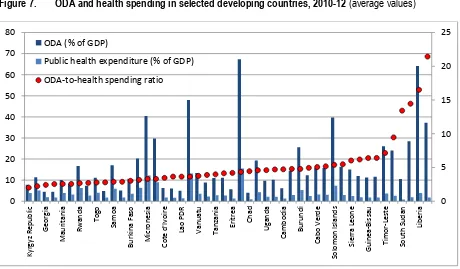
7. ODA and health spending in selected developing countries, 2010-12... 24
8. Use of ODA in Sub-Saharan Africa, 1999-2005... 25
9. Illicit Financial Flows (IFFs) versus Official Development Assistance (ODA), 2003-12 ... 29
10. Assets under management by Sovereign Wealth Funds, 2000-13 ... 32
11. Foreign exchange reserve accumulation by developing region, 1993-2013 ... 35
12. Public bonds by developing regions, 1980-2013 ... 38
13. Possible borrowing candidates, 2013 ... 39
14. Debt and health spending, 2011-13 ... 42
15. Poor country debt at a glance ... 43
16. Projected and actual fiscal deficits in developing countries, 2007-15 ... 48
17. Fiscal surplus and health spending, 2014 ... 49
List of boxes 1. Identifying fiscal space: How to use Annex 1 ... 4
2. Thailand: Reallocating military expenditures for universal social protection ... 6
3. Egypt: Reviewing Budget Priorities at the Economic Justice Unit of the Ministry of Finance ... 6
4. Indonesia, Ghana: Lessons from using fuel subsidies for social protection systems ... 7
6. Bolivia: Taxing hydrocarbons key for national social development ... 13
7. Zambia’s revenues from its recent mining fiscal regime ... 14
8. Algeria: Taxes on tobacco, alcohol and on pharmaceutical imports to achieve universal social protection………. ... 16
9. Spain: ONCE Lottery for the social inclusion of the blind and visually impaired ... 18
10. Brazil: Increasing coverage and collection of social security contributions ... 20
11. Monotax in Uruguay: Extending social protection to the informal economy ... 21
12. South-South bilateral cooperation in Guinea-Bissau ... 26
13. ALBA South-South regional transfers in El Salvador ... 27
14. Fighting tax evasion – The US Foreign Account Tax Compliance Act (FATCA) ... 30
15. When resources and poverty abound: The paradox of Timor-Leste ... 34
16. South Africa: Subnational Bonds Finance Basic Urban Infrastructure and Services ... 40
17. Colombia's Social Impact Bond: An innovative public-private partnership (PPP) ... 41
18. Iraq and Iceland: Debt repudiation ... 44
19. Debt audits: The case of Ecuador... 44
20. The need for an international debt work-out mechanism ... 45
Acknowledgements
Identifying fiscal space for the Sustainable Development Goals (SDGs) is increasingly recognized as a priority by UN agencies. This is why this paper is co-published by ILO, UNICEF and UNWOMEN, and translated into several languages.
The paper is a new update of the original Identifying Fiscal Space: Options for Social and Economic Development for Children and Poor Households in 184 Countries published by UNICEF in 2012, and later revisions.
Special thanks need to be given to Jose Antonio Ocampo (Professor at Columbia University and ILO Goodwill Ambassador for Social Protection), Anuradha Seth (Economist, UNWOMEN), Fabio Duran-Valverde (Head of Public Finance, Actuarial Services and Statistics, Social Protection Department, ILO), Anne Drouin (Director of the Global Programme on Employment Injury Insurance, ILO), Wolfgang Scholz (former Senior Economist, ILO), Christoph Ernst (Senior Economist, ILO) and Victoria Giroud-Castiella (Social Protection Officer, ILO) for their inputs and suggestions to this update.
1.
Introduction: Fiscal space exists in all countries
The argument that spending on social protection is unaffordable is becoming less common in international development forums. Finding fiscal space for critical economic and social investments is necessary for achieving the Sustainable Development Goals (SDGs), for sustained human development of children and women, and for realizing human rights, particularly during downtimes.
This paper presents eight financing alternatives, based on policy positions by the United Nations and international financial institutions, and shows that fiscal space for social protection and the SDGs exists even in the poorest countries. Of the eight options, six
increase the overall size of a country’s budget: (i) increasing tax revenues; (ii) expanding
social security coverage and contributory revenues; (iii) lobbying for increased aid and transfers; (iv) eliminating illicit financial flows; (v) borrowing or restructuring debt, and (vi) adopting a more accommodative macroeconomic framework. The other two options are about redirecting existing resources from one area to another, in this case social protection: (vii) re-allocating public expenditures and; (viii) tapping into fiscal and foreign exchange reserves.
Fiscal space is normally defined as the ‘room in a government’s budget that allows it to provide resources for a desired purpose without jeopardizing the sustainability of its
financial position or the stability of the economy’ (Heller, 2005) and “the financing that is available to government as a result of concrete policy actions for enhancing resource
mobilization” (Roy et al., 2007).
Today, at a time of fragile global recovery, austerity and slow growth, the need to create fiscal space has never been greater. Even the Managing Director of the International Monetary Fund (IMF), Christine Lagarde, has called repeatedly for the aggressive exploration of all possible measures that could be effective in supporting growth and development, making the best possible use of fiscal space 1. Given the significance of public
investments for human rights and the SDGs, it is indeed imperative that governments aggressively explore all possible alternatives to expand fiscal space to promote national socio-economic development with jobs and social protection.
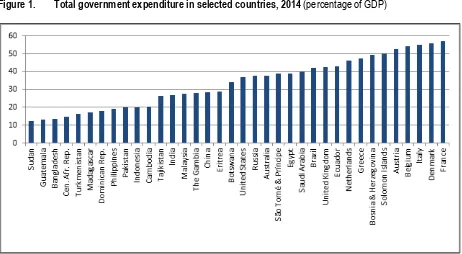
To start, it is important to understand that government spending and revenue choices vary widely. A fundamental human right principle is that States must utilize all possible resources to realize human rights; however, many countries do not, they keep government revenues and public expenditures at lower levels – it is important to understand that this is a public policy choice. For example, total public expenditure in Sudan was 12 per cent of GDP in 2014 and 13 per cent in Guatemala, compared to 28 per cent in China, 37 per cent in the US, 42 per cent in Brazil, and more than 55 per cent in Denmark and France (figure 1). Some States opt to expend more and others less.
1 For example, Financial Times, “Don’t Let the Fiscal Brakes Stall Global Recovery”, 15 August
Figure 1. Total government expenditure in selected countries, 2014 (percentage of GDP)
Source: IMF’s World Economic Outlook (October 2014).
As in spending decisions, there is a similar disparity in how governments raise resources for social and economic development. While some governments utilize all possible options, others do not. Indeed, many countries have succeeded in mobilizing significant resources for public investments during downturns. By utilizing all possible options to maximize fiscal space, these countries have achieved a virtuous circle of sustained growth which, in turn, generates further resources; they serve as inspiring examples to others who have been trapped in limited fiscal space, low social spending and weak economic growth.
This working paper is intended to serve as an introductory guide to identify possible financing options to introduce and/or scale up social protection systems and implement the Social Protection Floors Recommendation, 2012 (No. 202), as well as other SDGs that have impacts in the lives of women, children and other social groups. It is not meant to be exhaustive, nor does it attempt to provide a detailed description of the distinct risks and trade-offs that are associated with each of the options. As such, this paper should be viewed as an overview of fiscal space-enhancing opportunities that are to be further explored at the country level.
The structure is straightforward: each section describes one of eight options that are available to governments to generate additional resources for social protection, as summarized below:
i. Re-allocating public expenditures: this is the most orthodox option, which includes assessing on-going budget allocations through Public Expenditure Reviews (PERs) and other types of thematic budget analyses, replacing high-cost, low-impact investments with those with larger socio-economic impacts, eliminating spending inefficiencies and/or tackling corruption.
iii. Expanding social security coverage and contributory revenues: in existing social security systems, increasing coverage and therefore collection of contributions is a reliable way to finance social protection, freeing fiscal space for other social expenditures; social protection benefits linked to employment-based contributions also encourage formalization of the informal economy.
iv. Lobbying for aid and transfers: this requires either engaging with different donor governments or international organizations in order to ramp up North-South or South-South transfers.
v. Eliminating illicit financial flows: Given the vast amount of resources that illegally escape developing countries each year, estimated at ten times total aid received, policymakers should crack down on money laundering, bribery, tax evasion, trade mispricing and other financial crimes are illegal and deprive governments of revenues needed for social and economic development.
vi. Using fiscal and central bank foreign exchange reserves: this includes drawing down fiscal savings and other state revenues stored in special funds, such as sovereign wealth funds, and/or using excess foreign exchange reserves in the central bank for domestic and regional development.
vii. Managing debt – borrowing or restructuring existing debt: this involves active exploration of domestic and foreign borrowing options at low cost, including concessional, following a careful assessment of debt sustainability. For countries under high debt distress, restructuring existing debt may be possible and justifiable if the legitimacy of the debt is questionable and/or the opportunity cost in terms of worsening deprivations of vulnerable groups is high.
viii. Adopting a more accommodating macroeconomic framework: this entails allowing for higher budget deficit paths and/or higher levels of inflation without jeopardizing macroeconomic stability.
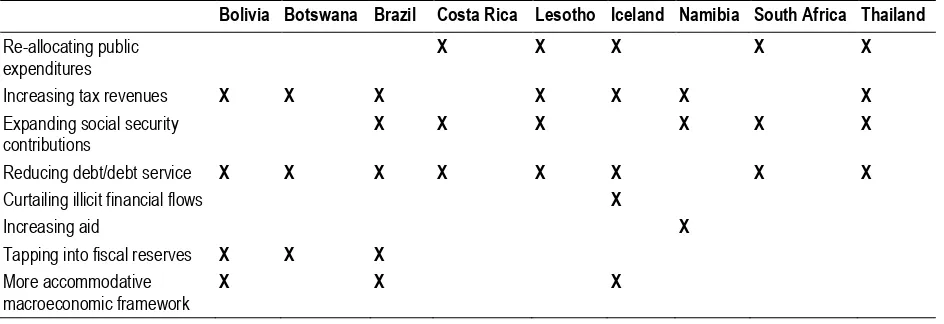
The uniqueness of each country requires that fiscal space options be carefully examined at the national level and alternatives fully explored in a social dialogue. Most countries adopt a mix of fiscal space policies as reflected in table 1. A good starting point for country level analysis may be a summary of the latest fiscal space indicators, which is provided in Annex 1 for 187 countries and offers a general overview of which funding possibilities may or may not be potentially feasible for a given country in the short run (see box 1).
Table 1. Matrix of fiscal space strategies, selected countries
Bolivia Botswana Brazil Costa Rica Lesotho Iceland Namibia South Africa Thailand
Re-allocating public
Curtailing illicit financial flows X
Increasing aid X
Tapping into fiscal reserves X X X
More accommodative macroeconomic framework
Box 1
Identifying fiscal space: How to use Annex 1
Annex 1 provides a snapshot of different fiscal space indicators for 187 countries and can be used to carry out a rapid analysis of resource options that may be available to a particular government. It is important to note that Annex 1 only serves as a starting reference point; it excludes the more systematic undertaking of implementing a new or expanding an existing social security system. It is critical to acquire the latest available figures, as well as projections, for relevant indicators and to perform in-depth analysis and outcome assessments for all possible scenarios. Moreover, such exercises should be carried out in consultation with key stakeholders, including worker and employer representations, as well as development partners.
The data below are extracted from Annex 1 and represent examples of two developing countries from different continents: Guatemala and Pakistan. Examination of their different fiscal space indicators reveals numerous possibilities to boost social and economic investments today.
Source: Annex 1 (all figures in percentage of GDP, unless otherwise noted, for 2014 or latest available).
i. In terms of government spending, countries can consider reallocating expenditures from areas with limited development returns to social and economic investments that benefit poor households. For instance, military expenditures in Pakistan is 3.5 per cent of then budget, more than all investments in education and health; examination of the budget is required to understand the distributional impacts of current allocations – including identifying higher impact investments – as well as to address spending inefficiencies, with special emphasis on tackling leakages and corruption (see Section 2).
ii. On tax revenue, Guatemala and Pakistan rank among the lowest levels of tax intake as a per cent of GDP among the 187 countries with comparable data. The revenue fiscal indicator thus indicates that tax codes and collection methods should be reviewed in both countries, which should also be accompanied by analysis of strengthening other revenue streams and identifying potential new ones. It is generally advisable to rely less on consumer taxes, which tend to be regressive (e.g. VATs), and expand other types of taxation – on corporate profits, financial activities, personal income, wealth, property, tourism, trade, etc.– without jeopardizing employment-generating investments (see Section 3). iii. Information on social security contributions is only available for Guatemala, 10 per cent of total social protection
expenditures is raised through contributions, a low level that shows that Guatemala could expand fiscal space though extending social security coverage and collection of social contributions, linked to policies on formalization of informal sector workers (see Section 4).
iv. At less than one per cent of GDP, levels of official development assistance (ODA) point to ample scope to lobby for increased aid and transfers in both Guatemala and Pakistan. As a first step, these governments could develop an enhanced aid strategy to operationalize a social protection floor and tailor it to bilateral partners. Both countries could also explore enhancing South-South development cooperation with strategic emerging donors to gain both financial and technical support (e.g. China or United Arab Emirates in the case of Pakistan; Brazil, Mexico or Venezuela in the case of Guatemala) (see Section 5).
v. The estimated size of illicit financial flows (IFFs) is significant in Guatemala (2.7 per cent of GDP), more than its total health expenditure. It might therefore be strategic to carry out an in-depth assessment of IFFs to identify changes in policies and public finance practices that could capture these resources and re-direct them toward productive socio-economic investments, including social protection (see Section 6).
vi. In terms of foreign exchange reserves, central banks in Guatemala and Pakistan do not appear to be holding excessive levels, and other fiscal space options should be prioritized; limited data inhibits an assessment of fiscal reserves (see Section 7 for an analysis on how reserves can be used to foster socio-economic development).
vii. Regarding debt, Guatemala’sannual service payments approach 2.4 per cent of GDP and Pakistan’s 3.3 percent, which equals and surpasses the total spent on health and strongly suggests that the governments could review strategies to lower payments through debt restructuring (see Section 8).
viii. Although Pakistan appears to have limited scope for increasing its budget deficit (nearly five per cent of GDP), levels in Guatemala were relatively tame during 2014 (two per cent), suggesting that there may be room to allow for an increasing degree of deficit spending to support additional investments in social protection (see Section 9).
ix. In terms of inflation, Guatemala’s 2014 levels amounted to 3.5 per cent, which is far below global norms and
demonstrates that there might be some room for expansionary monetary policy. For Pakistan, with inflation nearing 9 per cent, it would be prudent to analyze other options (see Section 9).
2.
Reprioritizing public spending
Rethinking sector-specific allocations within existing budgets is one strategy to increase social expenditures. The re-prioritization of public spending is usually a contentious and therefore difficult approach. To be successful, there must be strong political will. Opposition to restructuring comes obviously from the fact that no extra resources are considered available and, therefore, other sectors or subsectors must be reduced in order to allow for increased social investments – these sectors often represent important vested interests in a country. In other words, this approach presumes that the overall budget is fixed and changes of its structure must obey the rules of a zero-sum game, there are winners and losers and the latter resist to budget reallocations.
The literature on public choice and public finance describes how different interest groups within and outside of government compete to influence public policies and budget allocations (e.g. Buchanan and Musgrave, 1999). In cases where labor and social sector ministries are not able to garner support, the result may be reduced allocations for labor-related policies or social investments. Very often, both in developed and developing countries, the debate is manipulated by vested interests and/or ideological posturing – for instance arguing that social expenditures are causing unmanageable deficits while not mentioning military or other non-productive expenditures that are much larger. Various studies have highlighted the risks of pro-poor budget items being the most affected during fiscal consolidation and adjustment processes (e.g. Cornia et al., 1987, Hicks, 1991, ILO, 2014, Ortiz et al., 2015, Ravallion, 2002, 2004 and 2006).
Despite this is a difficult strategy to achieve larger social budgets, there are ways of prioritizing socially-responsive expenditures even when overall budgets are contracting. This re-prioritization requires, first and foremost, that governments have their budget priorities in place. The political and technical challenges of identifying sectors/subsectors that can be reduced to promote fiscal space can be overcome in case of political agreement on the following strategies (see Ortiz, 2008a, Scholz et al., 2000, for further details):
Re-prioritizing through Public Expenditure Reviews (PERs) and Social Budgets. These
are well-developed approaches to public financial management that bring evidence and rationality to public policy-making by showing the impacts of current budgetary allocations.
Replacing high-cost, low-impact investments. New public investments can be
re-examined; for example, the social impacts of many large infrastructure projects or rescue of banking systems tend to be limited however require large amounts of public resources. Budget items with large recurrent costs but small social impacts should also be re-considered, for example, Costa Rica and Thailand reduced military spending to finance needed social investments (boxes 2 and 3). Currently, many countries are phasing-out energy subsidies, such as in Ghana and Indonesia (box 4), a great opportunity to develop social protection systems. Social dialogue that includes relevant stakeholders and public debates one strategic tool to replace high-cost, low-impact interventions, which can help to minimize the possible influence of powerful lobbying groups on public policy-making.
Eliminating inefficiencies. Although linked to the previous point, deeper analysis of
compares to alternatives). Making sector allocations more efficient also involves strengthening supervision and inspection as well as reducing corruption.
Fighting corruption. Corruption can also be a significant source of fiscal space for
socio-economic development, estimated at more than 5 per cent of global GDP (US$ 2.6 trillion); the African Union estimates that 25 per cent of the GDP of African states, amounting to US$148 billion, is lost to corruption every year; yet the problem is pervasive worldwide, including in higher income countries – e.g. the US healthcare programs Medicare and Medicaid estimate that 5 to 10 per cent of their annual budget is lost as a result of corruption (OECD, 2014a). Despite some efforts to return assets stolen by corrupt officials and moved to offshore accounts, only about US $420 million has ever been returned (Grey et al., 2014). Strengthening transparency and good governance practices, as well as fighting illicit financial flows (see later section) can increase the availability of resources for social and economic development 2.
The international financial institutions such as the IMF often advise reducing inefficiencies since it avoids political tensions; however, it must be noted that expenditure reforms take time to advance and are unlikely to yield significant, immediate resources. While the re-prioritization of public sector spending may be a good starting point to expand fiscal space, other options should also be examined.
Box 2
Thailand: Reallocating military expenditures for universal social protection
The 1997 Asian financial crisis severely hit the Thai economy and society. With the backing of the 1997 Constitution, civil society calls to address neglected social policies led the government to adopt the Universal Health Care Scheme in 2001. Given that approximately a third of the population was excluded from health coverage at that time, most of which belonged to the informal agricultural sector without regular income, achieving universal coverage through contributory schemes alone was not possible, it needed budget support. Most of the improvements in public health were financed through reduced spending on defense (from around 25 per cent of total expenditures in the 1970s to 15 per cent during the 2000s) and lower debt service payments. The government included the Universal Health Care Scheme as part of a more general fiscal stimulus plan, other measures increased the amount of money in the hands of people with a high propensity to spend, including the creation of a People’s Bank, a debt moratorium for farmers and a village fund.
Source: Duran-Valverde and Pacheco (2012).
Box 3
Egypt: Reviewing Budget Priorities at the Economic Justice Unit of the Ministry of Finance
After the Arab Spring, an Economic Justice Unit was created at the Ministry of Finance, led by a Deputy Minister of Finance. The mission of the Economic Justice Unit is equitable fiscal policy. The unit reviews budget priorities, attending to three moral principles (participation, distribution, and redistribution) balanced with the 4 E’s (economy, efficiency, effectiveness and equity). One of the main measures after the Arab Spring was the adoption of the minimum wage for government employees, ten per cent of which are considered poor. Tax avoidance is considered a major source of social injustice in Egypt and the Economic Justice Unit supports increasing tax collection while improving public services, so that taxpayers feel a return from the use of these services. Social justice is not considered to be only about helping the poor, but about providing good universal services to everybody, including the middle classes that are very low income in a country like Egypt.
Source: American University in Cairo 2014 and Ministry of Finance of Egypt.
2 Specific strategies to address corruption are widely documented by international agencies and
Box 4
Indonesia, Ghana: Lessons from using fuel subsidies for social protection systems
Since 2010, reducing subsidies is a common policy considered by 132 governments in 97 developing and 35 high-income countries; predominately they are eliminating subsidies on fuel, but also on electricity, food and agriculture. The reduction of fuel subsidies is often accompanied by the development of a basic safety net as a way to compensate the poor, such as in Ghana and Indonesia. However, when fuel subsidies are withdrawn, food and transport prices increase and can become unaffordable for many households. Higher energy prices also tend to slow down economic activity and thus generate unemployment. The sudden removal of fuel subsidies and consequent increases in prices have sparked protests and violent riots in many countries, such as Cameroon, Chile, India, Indonesia, Kyrgyzstan, Mexico, Mozambique, Nicaragua, Niger, Nigeria, Peru, Sudan and Uganda. There are several important policy implications that must be taken into account:
• Timing: While subsidies can be removed overnight, developing social protection programs takes a long time, particularly in countries where institutional capacity is limited. Thus there is a high risk that subsidies will be withdrawn and populations will be left unprotected, making food, energy and transport costs unaffordable for many households.
• Targeting the poor excludes other vulnerable households: In most developing countries, middle classes are very low income and vulnerable to price increases, meaning that a policy to remove subsidies allowing only targeted safety nets for the poor may punish the middle classes and low income groups.
• Allocation of cost-savings. The large cost savings resulting from reductions in energy subsidies should allow countries to develop comprehensive social protection systems: fuel subsidies are large, but compensatory safety nets tend to be small in scope and cost. For example, in Ghana, the eliminated fuel subsidy would have cost over US$1 billion in 2013, whereas the targeted LEAP programme costs only about US$20 million per year (where did the rest of savings go?).
• Subsidy reforms are complex and their social impacts need to be properly assessed and discussed within the framework of national dialogue, so that the net welfare effects are understood and reforms are agreed to before subsidies are scaled back or removed
Concluding, the reduction of energy subsidies is an excellent opportunity to develop social protection systems for all, including floors, and other SDGs. Fuel subsidies are generally large and should allow governments to develop comprehensive universal social protection systems for all citizens, not just the poor.
3.
Increasing tax revenues
Increasing tax compliance and/or raising tax rates are potential strategies to mobilize additional public resources without necessarily sacrificing other spending priorities. However, new taxes improve government revenues only when well designed and executed 3. Aside from strengthening a country’s overall fiscal position, new tax revenue can potentially
support equity objectives, especially in situations of widespread disparities. For example, if income tax rates are increased among the richest groups of a country, additional revenues can be generated and invested in poor and vulnerable households, reducing poverty and inequality, and sustaining inclusive growth in the long run.
Most common taxes include: consumption or sales taxes (e.g. on goods and services or on any operation that creates value; typically applied to everybody), corporate taxes (applied to companies, including in the financial sector), income taxes (e.g. on persons, corporations or other legal entities), inheritance taxes (applied on bequest), property taxes (e.g. applied to private property and wealth), tariffs (e.g. taxes levied on imports or exports) and tolls (e.g. fees charged to persons traveling on roads, bridges, etc.).
In recent history, increasing progressive taxation from the richest income groups to finance social and pro-poor investments has been uncommon. This is largely the result of the wave of liberalization and de-regulation policies that swept across most economies beginning in the early 1990s. These led many countries to offer tax breaks and subsidies to attract foreign capital, as well as to scale back income taxes applied on wealthier groups and businesses to further encourage domestic investment. Moreover, to counter the revenue losses associated with these tax policies, many countries levied different consumption taxes.
The tax policy framework associated with liberalization and de-regulation continues to typify most governments today. Contrary to progressive, equity-based policies, many current tax regimes may be characterized as regressive in that they take a larger percentage of income from poor households than rich households. In particular, a large number of governments rely heavily on value-added taxes (VATs) for revenues, which tend to weigh most heavily on the poor since they spend a higher share of their income on basic goods and services when they are not exempted. In light of this reality, it is imperative that distributional impacts are at the forefront of tax policy discussions – across income groups, regions and other.
Given the urgency to increase fiscal space for equitable development many governments are working on increasing tax revenues. Efforts are being undertaken in developed as well as developing countries in order to close loopholes, develop collection capacities and broaden the tax base, including cracking down on corporate tax evasion, which has been estimated to result in annual revenue losses of US$189 billion for developing countries as a whole (Christian Aid 2008, EURODAD 2014).
The following considers six broad tax categories that governments can adjust to increase revenue streams, which include consumption/sales taxes, income taxes, corporate taxes, natural resource extraction taxes, import/export tariffs and other taxes that use more innovative approaches.
3 It is important, however, to carefully scrutinize the risks of reforms involving changes to tax rates.
3.1. Consumption/sales taxes
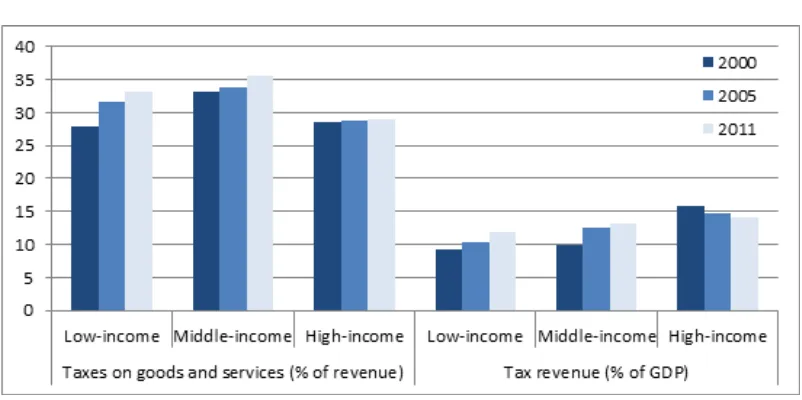
Many developing countries have introduced higher consumption or sales taxes, such as VATs, over the past decade. According to the World Development Indicators, between 2000 and 2011, the overall share of consumer-related taxes increased by five percentage points in low-income countries and by two percentage points in middle-income countries, on average, in terms of total revenue, while this share remained stable in higher income economies (figure 2). Within the cohort of developing countries, it also appears that these new taxes have been a source of a steady increase in overall tax revenues 4. While there is limited data
for developing countries prior to 2000, which likely hides much of the marked increase, available data show that the contribution of new consumption taxes to overall revenue led to increases from around 10 per cent of GDP in 2000 to 13 per cent in 2009 for middle-income countries, on average, with a two per cent increase for low-income countries.
Further, a recent review of IMF policy discussions in 616 country reports shows that 138 governments in 93 developing and 45 high income countries are considering raising VAT or sales taxes (ILO 2014a, Ortiz et al., 2015). If the distributional impact of such a change in tax policy is not properly addressed, there is the risk of worsening income inequality given the disproportionate weight that consumption taxes place on the bottom income quintiles of society. Contrary to progressive taxes, universal taxes on goods, especially on basic food and household items, are regressive since they do not discriminate between high-income and low-income consumers.
Given their negative social impacts, raising VAT or consumption taxes on products that common households consume is not a recommended policy option. Levying or increasing consumption taxes can only be a prudent policy objective and strengthen fiscal space if targeted to the products that the better-off consume disproportionately more. For example, it is possible to exempt necessary basic goods that many low-income families depend on while setting higher rates for luxury goods that are principally consumed by wealthier families (e.g. luxury cars). In this manner, progressively designed consumption taxes can increase public resources and protect the most vulnerable (see Schenk and Oldman, 2001 for discussion).
Figure 2. Taxes on goods/services and overall tax revenue by income groups, 2000-11 *
Source: World Development Indicators (2015).
* Tax revenue refers to transfers to the central government for public purposes and does not include social security contributions; taxes on goods/services include general sales and value added taxes, selective excises on goods, selective taxes on services, and taxes on the use of goods or property, among others.
4 This may reflect in part strengthened collection of existing taxes, the extent of which cannot be
Another type of consumption tax that can be used to increase fiscal space is excise tax, which is collected on goods such as beer, cigarettes and petroleum whose consumption creates negative externalities (e.g. the cost of the good does not factor in the negative side effects to third parties or society that result from its consumption). The advantage of increasing so-called “sin” taxes is that they may be more politically acceptable, especially if the revenue is directed toward social expenditure, their disadvantage is that by their nature they aim at reducing the underlying consumption. Based on current tax proceeds, WHO (2009a) estimates that a 5-10 per cent increase in the tobacco tax rate could net up to US$1.4 billion per annum in additional revenue in low-income countries and US$5.0 billion in middle-income countries; raising tobacco taxes by 50 per cent could cover nearly half of public health expenditures in a number of developing countries. Given the public health
spillovers and revenue potential associated with new or higher “sin” taxes, many
governments appear to be considering this option. Countries with high tobacco taxes include Algeria (box 8), Argentina, Bangladesh, Botswana, Brazil, Chile, Costa Rica, Ecuador, India, Indonesia, Madagascar, Mauritius, Nepal, Panama, Uruguay, Swaziland, Thailand, Venezuela and Zimbabwe (WHO, 2015).
3.2. Income taxes
In contrast to taxes on goods and services, income taxation is often progressive – that is, people in higher income brackets pay higher tax rates than those in the bottom. According to the World Development Indicators data, with the exception of countries in East Asia and the Pacific, developing countries have, on average, increased personal and corporate income taxes, as well as those levied on capital gains, since 2001. The rise in various income taxes is likely to have led to enhanced revenue streams for most developing country governments.
However, this progressive trend hides important disparities within income tax policies. In particular, a number of developing countries have reduced income tax rates on the wealthiest groups (table 2). In terms of individual income taxes, 34 of the 149 countries with data (or 22 per cent of the sample) had lowered the tax rates applied to the highest income earners in 2014 when compared to the 2010-13 period. Of the 146 countries that offer corporate income tax data, four had reduced the tax rate applied to the top income bracket in 2014 when compared to previous years. For these countries, expanding the income tax base through more efficient collection, especially through eliminating evasion, or by decreasing the income required to qualify for higher tax brackets, could increase available fiscal space over the short term.
Table 2. Developing countries that lowered income tax rates for the top income brackets, 2014
Individual income tax Corporate income tax
Antigua and Barbuda Mozambique Sierra Leone
Ecuador Netherlands Antilles Albania
Fiji New Zealand Germany
France Norway Israel
Source: Authors’ calculations using data from KPMG extracted on 6 February 2015.
Furthermore, there is an urgent need to introduce increasingly progressive income taxes to counter current trends in inequity. The large income inequalities that characterize most developing countries – especially middle-income countries – are being exacerbated during in recent years due to slow growth and persistently high unemployment, volatile food and fuel prices, and low government spending patterns, all of which have a disproportionate, negative impact on the bottom quintiles (Ortiz and Cummins, 2011:33-36). As a result, income taxes – which, among taxes, are the principal redistribution tool available to policymakers – should be examined on both fiscal space and equity grounds.
3.3. Corporate taxes and taxes to the financial sector
Increasing business taxes is another possible strategy to generate additional fiscal revenues. Developing countries across all regions except Latin America have decreased commercial tax rates between 2005 and 2014. Europe and Central Asia along with Sub-Saharan Africa underwent the largest reductions according to data from the World Bank (World Development Indicators, 2015). East Asia and the Pacific and Middle East and North Africa also lowered commercial tax rates by three per cent and six per cent respectively over the same time period 5.
The logic behind lowering corporate taxes and related license costs and fees was to encourage entrepreneurial risk-taking and generating new economic activity. However, the potential trade-off needs to be carefully balanced, to ensure that the short-term gains from increased business activity do not come at the expense of foregone essential investments for human and economic development. This may be particularly important in those countries that have undergone major reductions – e.g. Belarus, Georgia, Mauritania, Sierra Leone and Timor-Leste, all of which reduced commercial tax rates by more than 25 per cent between 2005 and 2010 –as well as those that have among the world’s lowest commercial tax rates
– e.g. Georgia, Kosovo, Lesotho, Macedonia, Vanuatu, Timor-Leste and Zambia, all of which had commercial tax rates under 17 per cent as of 2014 6.
The former logic is being questioned in many countries following the global financial crisis, particularly related to the financial sector. Different financial sector tax schemes may offer another possible revenue stream for stepped up social investments, provided that their impact on financial sector development is carefully evaluated. Many countries are considering special taxes on the profits and remuneration of financial institutions. For instance, Turkey taxes all receipts of banks and insurance companies, and, in the United
Kingdom and France, all bonus payments in excess of €25,000 were taxed by 50 per cent
(IMF, 2010a). Another example is a bank debit tax in Brazil, which charged 0.38 per cent on online bill payments and major cash withdrawals; before its discontinuation in 2008, it raised an estimated US$20 billion per year and financed healthcare, poverty alleviation and social assistance programs. And Argentina operates a 0.6 per cent tax on purchases and sales of equity shares and bonds, which, in 2009 accounted for more than ten per cent of overall tax revenue for the central government (Beitler, 2010).
At the international level, it has been estimated that applying a 0.005 per cent single-currency transaction tax on all four major currencies could yield up to US$33.0 billion per year for developing country assistance. And if applied more broadly to cover all financial transactions globally, a 0.01 per cent tax could raise over US$1.0 trillion annually (Leading Group on Innovating Financing for Development, 2010).
Taxing financial sector transactions is a feasible option to fund social protection (box 5). A tax on financial transactions has several advantages. In the first place, it is relatively easy to implement and monitor because it works within supervised banking institutions that use electronic transactions/records. Secondly, it covers everyone, even those who evade payroll contributions. Thirdly, it is a fiscal control instrument that allows cross-checks to be made with information on financial transactions throughout the economy. Fourthly, it is highly progressive and allows resources to be channeled directly from the formal economy to those who need social protection. This is especially important considering that most developing countries have a highly regressive tax structure, which relies primarily on indirect taxes. The introduction of a tax on financial transactions to finance social spending should be considered a viable option to increase fiscal space for social investments.
Box 5
Brazil: A financial transaction tax to finance public health and social protection
The Contribuição “Provisória” por Movimentação Financeira (CPMF) tax was levied in Brazil from 1997 to 2007. The contribution took the form of deductions from accounts held by financial institutions. The maximum value of the CPMF quota reached 0.38 per cent of the value of financial transactions. For accounting purposes and because the CPMF was designed mainly to finance social protection expenditure,
the mechanism was classified as a “social contribution.” During the period in which the tax was applied, 42
per cent of the revenue collected was used for the public unified health system, 21 per cent for social insurance, 21 per cent for Bolsa Família and 16 per cent for other social purposes. By 2007, total revenue from CPMF amounted to 1.4 per cent of GDP, enough to cover the total cost of Bolsa Família and other non-contributory social protection programs. Although pressures from the financial sector led to its rescinding in 2007, a financial transaction tax was re-instated in 2009 at much higher levels (6 per cent) in order to help curb liquidity in international markets and fast capital inflows/outflows that disrupted Brazil’s development. It was repealed once again in 2013, after leaving significant resources to the Brazilian government to implement social policies, a reason driving the ongoing calls from civil society to adopt financial transaction taxes as part of social justice.
Source: Duran-Valverde and Pacheco (2012) and Levinas (2014).
In addition to altering corporate tax rates, governments can also increase fiscal space by taking concerted actions to minimize tax evasion and/or aggressive avoidance of taxes on the part of large companies. Transnational corporations, in particular, commonly shift profits and losses around the world so that they are recorded in different jurisdictions in order to minimize overall tax liabilities. Such practices are difficult to track, but estimates suggest that total lost revenues could amount to US$50 billion per year among developing countries (Cobham, 2005). Proposals have been put forward to increase the transparency of transnational corporations and hold them accountable for their tax obligations, such as reporting profits, losses and taxes paid in each location where the company does business (see section 6 on illicit financial flows for details).
3.4. Natural resource extraction taxes
Developing countries that rely on non-renewable natural resources as a main source of wealth should consider ways of distributing effectively and equitably the mineral rent to the society to support social and economic development initiatives. There are also significant environmental and social externalities associated with natural resources, such as the impacts on local communities, which, if not adequately addressed, serve as a subsidy to extracting companies and further distort the true cost of development.
(diamonds), Brazil (oil), Indonesia (oil and gas) and Malaysia (forestry, tin, oil and gas) (Chang, 2007). In terms of the latter, ample care must be taken to find the right types of contracts, including licenses, joint venture, production-sharing arrangements, etc. (Radon, 2007) (box 6).
Box 6
Bolivia: Taxing hydrocarbons key for national social development
Natural resources, including gold, tin, petroleum and gas, are the main pillar of Bolivia’s wealth and key to the country’s national development. As a result of orthodox neoliberal policies in the 1980s, the majority of production was privatized, often through foreign companies. In the process, royalty taxes were cut down to 18 per cent, which led to extremely high profits for producers (82 per cent) and very low returns to the Bolivian population. The widespread dissatisfaction with this situation led to an activist campaign named
“Hydrocarbons are No Longer Ours.” After violent repression of this movement during the so-called “Gas
Wars”, President Sánchez de Lozada resigned, a national referendum led to a new regulation on the distribution of hydrocarbon wealth. The previous share of 82 per cent of oil revenues for the producers and 18 per cent for the state was equalized at a 50-50 split (and a reversed 82-18 split for the largest gas field). Renegotiation of former contracts led to an increase in oil and gas income for the state from US$558 million in 2004 to US$1.53 billion in 2006. Such significant revenue increases allowed the government to expand/sustain social policies such as Renta Dignidad (Dignity Rent), a non-contributory pension to all Bolivians over 60 years old, or the Bono Juancito Pinto, a cash transfer for all children in public elementary schools (from first through eighth grade), which offsets the costs of transportation, books and uniforms to increase school attendance.
Source: Duran-Valverde and Pacheco (2012), UNCTAD (2014a) and Vargas (2007).
While Norway’s approach of taxing oil profits and storing the revenues in the
Petroleum Fund (now called the Government Pension Fund Global) is perhaps the best-known case, developing countries offer several innovative examples of channeling natural resource revenue streams for social development. In Peru, for example, the government recently expanded taxes levied on the mining sector whose proceeds are being invested into health and education programs. The government is aware of the fact that the amount can every year vary substantially, because of mineral prices, operational costs and production levels 7 . Mongolia is financing a universal rights-based child benefit from taxation on copper
exports; when copper prices dropped with falling demand in 2009, Mongolia was advised by the international financial institutions to target its universal child benefit, the government refused to do so and it was a correct decision as in 2010/11 copper prices rose again.
Given the volatile nature of primary commodity prices, some governments have created
“stabilization funds” based on windfall taxes. Instead of spending all the revenue on social
and other development programs, governments have kept savings in years of bonanza for
“rainy days” when prices of commodity exports are lower, and hence ensuring that investments in social and economic development remain constant. Chile’s Copper Stabilization Fund, Iran’s Oil Stabilization Fund and Papua New Guinea’s Mineral
Resources Stabilization Fund stand as examples. During the recent economic downturn, a
number of countries have accessed these “rainy day” funds to finance stimulus measures and
increase social protection.
In many countries, however, the private sector takes the lead in exploiting natural resources. In these situations, the state is indirectly included in the rents since it receives a portion via taxes. This can include: (i) production-based taxation (per unit or ad valorem royalties, sales taxes, export and import duties, VAT, payroll tax, stamp duty, etc.); (ii) profit-based taxation (corporate income tax, resource rent taxes, taxes on windfalls, profit tax on dividends, royalty based on profit, etc.); and (iii) environmental taxes to compensate
7 See Peruvian Times, “Peru Organization Says New Mine Tax to Make Important Dent in Social
for negative environmental externalities caused by the activities of mining companies (e.g. Zambia in box 7).
Box 7
Zambia’s revenues from its recent mining fiscal regime
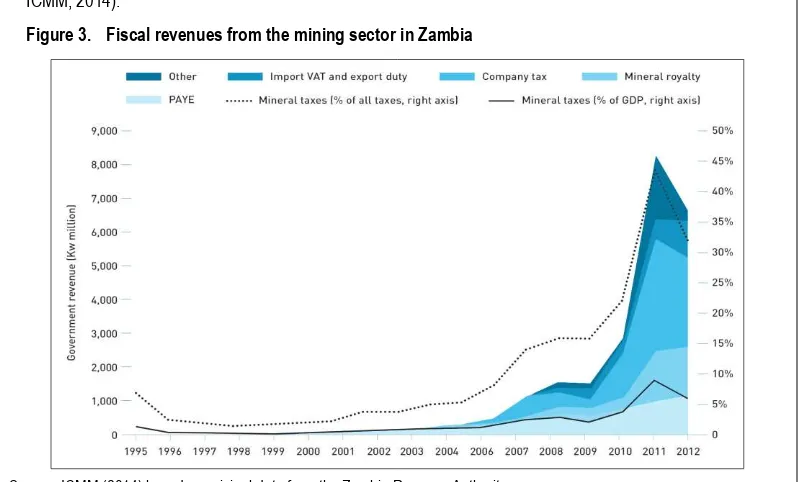
Zambia is another prominent example of a country having raised various taxes on mineral resources and thus significant revenues since 2005, as shown in figure 3. Zambia also introduced institutional reforms,
such as the creation of a large taxpayers’ office, and it gradually strengthened the revenue collection framework. Government revenues have improved considerably, from less than Kw 1.0 billion per year before 2008 to Kw 6.6 billion in 2012, which is over 30 per cent of total tax collection. Among mining countries (excluding petroleum) world-wide, Zambia’s mining receipts are the second highest after Botswana, but higher than revenues of the Chile, Democratic Republic of Congo or Guinea (Chamber of Mines of Zambia, ICMM, 2014).
Figure 3. Fiscal revenues from the mining sector in Zambia
Source: ICMM (2014) based on original data from the Zambia Revenue Authority.
3.5. Import/export tariffs
Tariffs have been a source of development finance for centuries. In the 1950s, import substitution industrialization policies used import tariffs to protect national industry, sometimes combined with tariffs on primary exports, with the goal to reduce foreign dependency, promote domestic markets and national development. These structuralist policies were abandoned in the 1980s with the structural adjustment programs. Current multilateral and bilateral free trade agreements have further limited/reduced tariffs, so this is hardly an option to expand fiscal space.
Indeed, developing countries have steadily reduced tariff rates since the 1990s, implying lowered capacity to generate revenues from trade. The financial implications of this trend are likely greater for low-income countries, which sliced tariffs by more than half from 36 to 12 per cent between 1996 and 2010, on average, compared to a seven per cent average cut in middle-income countries (figure 4). Some countries stood out, with India’s
average tariff rate falling from 71 to 13 per cent between 1994 and 2009 and Brazil’s from
Figure 4. Tariff rates by country income groupings, 1996-2010 * (in percentage points)
Source: World Development Indicators (2015).
* Values reflect unweighted average of applied rates for all traded products subject to tariffs.
Such declines in tariff revenue is associated with trade liberalization. In theory, the overall gains to free trade were supposed to outweigh the loss of tariff revenues, but, in practice, less developed countries tend to have limited ability to recover foregone revenues, which results in net revenue losses. For example, Baunsgaard and Keen (2005) find that while rich countries have been able to offset reductions in tariff revenues by increasing their domestic tax revenues, this has not occurred in most developing countries. Middle-income countries were found to recover only up to 60 cents of each dollar of tariff revenue lost, and low-income countries recovered no more than 30 cents.
Consequently, in many developing countries there may be a good rationale to examine current tariff levels, at least until domestic tax collection mechanisms are strengthened, to sustain or increase levels of revenue. In countries such as Brazil and India, there may be ample scope to raise tariffs since prevailing levels are far below the WTO-bound tariff rate ceilings agreed to in the 1995 Uruguay Round of trade negotiations (Gregory et al., 2010). Countries like Algeria impose high taxes to pharmaceutical imports if the same medicine is produced by at least three manufacturers in Algeria in quantities satisfying the market demand – a way to sustain jobs and national industry (box 8).
Moreover, for countries undergoing export-driven commodity booms, fiscal space could be enhanced for social investments by introducing or raising export tariffs. In many Latin American countries, for instance, special funds and laws have been created to govern the use of revenue derived from price increases in commodities exports (Gallagher and Porzecanski, 2009). One of the most well-known examples is Venezuela, where an increasingly progressive windfall tax is levied on oil exports to fund social development projects. To highlight the overall potential of commodity export taxes, a 2-5 per cent tax on oil exports from nine largest petroleum-exporting developing countries could generate anywhere from US$10 billion to US$26 billion in additional resources to support economic and social investments in 2016 8 .
8 Estimates reflect the 2013 average barrels per day of oil exported from Algeria, Angola, Iran, Iraq,
Kazakhstan, Mexico, Nigeria, Russia and Venezuela (combined total of 20.2 million barrels/day) along with the forecasted price oil in 2016 (US$70/barrel of WTI Crude Oil), as reported by the United States Energy Information Administration.
0 5 10 15 20 25 30 35 40
1996 1997 1998 1999 2000 2001 2002 2003 2004 2005 2006 2007 2008 2009 2010 Low income
Middle income
The above five broad tax categories (consumption/sales taxes, income taxes, corporate taxes, natural resource extraction taxes and import/export tariffs) can be introduced/adjusted increase government revenues. The optimal mix changes country to country: the advantages and disadvantages of each tax must be well understood (UNCTAD, 2014a-b and Commonwealth Secretariat, 2009) as well as the social impacts on different household groups assessed.
Box 8
Algeria: Taxes on tobacco, alcohol and on pharmaceutical imports to achieve universal social protection
Algeria has achieved near universal social protection coverage, financed mostly through social security
contributions. Social security contributions are 35 per cent of salaries; all employers must remit the workers’
contribution withheld at source at the rate of 9 per cent, together with the employers’ contribution at the rate of 26 per cent. Social security contributions fund pensions, family allowances, maternity, unemployment, work injury and health care for the majority of Algerians. However, additional funding is needed for social assistance and schemes to cover the informal sector. A way to supplement funding by the Algerian Government is through taxes on tobacco, alcohol and pharmaceutical imports.
- Taxes on Pharmaceutical Imports: On 30 November 2008, Algeria introduced measures restricting imports of drugs in order to protect jobs in the local pharmaceutical industry and increase tax revenues. A foreign-manufactured medicine cannot be imported if the same medicine is produced by at least three manufacturers in Algeria in quantities satisfying the market demand. A new order of 8 May 2011 provides a list of 257 imported medicine that are taxed upon entry because they are produced in sufficient quantities by national and foreign pharmaceutical companies in Algeria – a way to sustain jobs and national industry. - Taxes on Cigarettes and Alcohol: According to WHO, taxation on cigarettes was 50 per cent of the price
in 2014; in subsequent years, the Ministry of Finance introduced new legislation placing additional taxes on alcohol and all tobacco products, a way to raising funds as well as fighting unhealthy practices, such as drinking and smoking.
Source: Government of Algeria, WHO 2015.
3.6. Other taxes
A miscellaneous set of other taxes is presented in this section. Some are very important sources of income in the majority of world countries, such as property taxes; others are new alternative sources of development finance. Most of these involve taxing luxury activities or those that have negative social or environmental externalities (Atkinson, 2004).
Property and inheritance taxes: Higher real estate and inheritance taxes are a form of
progressive levies that require large landowners and wealthier generations to contribute more to government revenues. There are many advantages to such taxes, including fairness and evasion difficulties. In many developing countries, higher property taxes could transform into a robust source of funding for local governments. For example, a 2.5 per cent property tax in Thailand has been estimated to be able to finance all local government spending (Hall, 2010:41). According to the latest IMF country reports, many countries appear to be considering introducing or increasing property or real estate taxes in the current policy environment, including Costa Rica, Kosovo, Russia and St. Lucia. Land taxes are another example, which are a broader form of property tax applied to all land, not just buildings. Campaigns for land taxes have surfaced in many developing countries recently. In Latvia, for instance, a group of economists and other activists argued for the introduction of a land tax as an alternative to deep public spending cuts (Strazds, 2010), and there are similar discussions in parts of Southern Africa.
Airline and hotel taxes, taxes on tourism: Many developing countries have recently