Lampiran 1
ANGKET PENELITIAN
FAKTOR-FAKTOR YANG MEMPENGARUHI KEPUASAN KONSUMEN
PENGGUNA
HANDPHONE
MEREK SAMSUNG
DI GLORIA
CELL
SRAGEN
A.
INDENTITAS RESPONDEN
1.
Nama : ...
2.
Jenis kelamin Anda?
a. Pria
b. Wanita
3.
Usia Anda?
a. Kurang dari 20 tahun
b. Antara 21
–
30 tahun
c. Lebih dari 30 tahun
4.
Pendapatan anda perbulan
a. Kurang dari Rp. 1.000.000
b. Rp. 1.000.000
–
Rp. 2.000.000
c. Diatas Rp.2.000.000
5.
Merek ponsel yang anda gunakan:
a. CDMA = : ……….
b.
GSM = : ……….
6.
Rata-rata penggunaan pulsa per bulan
a. < Rp. 25.000
c. Rp. 50.000
–
100.000
B.
PETUNJUK PENGISIAN
Mohon diberikan jawaban dari setiap pertanyaan menurut pendapat Anda dengan
memberi tanda (X) pada setiap jawaban yang Anda Pilih.
1. Atribut Produk
No
Pernyataan
SS
S
N
TS STS
Desain
1
Anda membeli
handphone
ini karena memiliki
bentuk yang baik
2
Anda membeli
handphone
ini karena memiliki
desain yang menarik baik
3
Anda membeli
handphone
ini karena tertarik
dengan desainnya
Fitur
4
Anda membeli
handphone
ini karena memiliki
fitur yang lengkap dan menarik
5
Anda membeli
handphone
ini karena memiliki
fitur yang lebih baru dibanding lainnya
6
Anda membeli
handphone
ini karena fiturnya
selalu di-
update
oleh produsen
Garansi
7
Anda membeli
handphone
ini karena memiliki
garansi yang lebih lama
8
Anda membeli
handphone
ini karena mudah
mengklaim garansi
9
Anda membeli
handphone
ini karena jaringan
toko
yang
sudah
tersebar
luas
sehingga
memudahkan garansi
Berat
10 Anda membeli
handphone
ini karena ringan dan
mudah digunakan
11 Anda membeli
handphone
ini karena mudah
Warna
12 Anda membeli
handphone
ini karena warnanya
yang menarik
13 Anda membeli
handphone
ini karena warnanya
yang terkesan mewah
Resolusi layar
14 Anda membeli
handphone
ini karena memiliki
resolusi layar yang tinggi
15 Anda membeli
handphone
ini karena memiliki
warna lebih tajam
Memori
16 Anda membeli
handphone
ini karena memiliki
memori internal yang besar
17 Anda membeli
handphone
ini karena memiliki
tambahan memori eksternal yang besar
2. Kepuasan Pelanggan
No
Pernyataan
SS
S
N
TS STS
1
Anda merasa puas terhadap sistem operasi yang
digunakan produsen
handphone
2
Anda merasa puas terhadap tampilan dan
perfomance
handphone
3
Anda merasa puas terhadap daya tahan batery
handphone
4
Anda merasa puas terhadap fitur-fitur yang ada
pada
handphone
5
Anda merasa puas terhadap pelayanan garansi
Lampiran 2
Hasil Kuesioner Atribut Produk
Hasil Kuesioner Kepuasan Konsumen
No. Skor
Resp. 1 2 3 4 5 Total
1 3 5 4 3 4 19
2 4 4 3 3 4 18
3 4 5 4 3 4 20
4 5 4 5 4 5 23
5 4 4 4 3 4 19
6 4 5 3 4 5 21
7 3 3 4 3 5 18
8 4 4 4 5 5 22
9 4 5 4 4 4 21
10 5 4 4 4 5 22
11 4 4 5 4 4 21
12 5 4 4 5 4 22
13 4 4 3 4 4 19
14 4 3 3 4 3 17
15 4 4 3 4 4 19
16 4 5 5 5 4 23
17 5 4 4 3 3 19
18 4 4 5 5 4 22
19 5 4 5 4 5 23
20 5 5 5 4 4 23
21 5 4 5 4 4 22
22 4 5 5 5 5 24
23 5 5 5 5 5 25
24 4 4 5 4 5 22
25 4 5 5 5 5 24
26 4 3 3 3 4 17
27 4 4 4 3 4 19
28 4 4 4 4 3 19
29 5 4 3 4 3 19
30 4 4 5 5 4 22
31 4 4 3 4 4 19
32 4 5 4 4 4 21
33 4 3 3 3 3 16
34 5 5 4 4 5 23
35 4 5 5 5 5 24
36 4 3 3 4 4 18
37 5 5 4 5 5 24
38 4 3 3 4 5 19
39 5 5 5 5 4 24
40 5 5 5 4 4 23
41 4 4 4 3 5 20
42 5 4 3 3 4 19
43 4 4 5 4 4 21
44 4 5 5 5 4 23
45 4 4 4 4 5 21
46 5 5 5 4 4 23
47 4 4 5 5 5 23
49 5 4 4 4 4 21
50 4 4 3 5 5 21
51 4 5 4 4 5 22
52 4 3 3 4 4 18
53 5 5 4 4 5 23
54 5 5 5 5 4 24
55 4 3 4 3 4 18
56 5 5 5 5 5 25
57 5 4 4 4 3 20
58 5 5 5 5 5 25
59 4 5 5 5 4 23
60 5 4 3 4 4 20
61 4 4 4 3 4 19
62 4 4 3 3 3 17
63 5 3 3 4 4 19
64 5 5 4 5 4 23
65 4 4 4 3 4 19
66 3 5 4 5 5 22
67 4 5 5 4 5 23
68 4 5 5 5 4 23
69 5 5 4 3 5 22
70 4 5 5 5 5 24
71 5 5 5 5 5 25
72 4 4 5 5 4 22
73 5 5 5 4 5 24
74 5 5 4 5 4 23
75 3 3 4 5 5 20
76 3 4 4 3 5 19
77 4 4 4 5 4 21
78 5 4 4 5 5 23
79 3 5 5 4 4 21
80 5 4 4 5 5 23
81 5 5 4 5 4 23
82 4 5 4 5 5 23
83 4 4 5 4 4 21
84 4 4 4 5 4 21
85 5 5 3 4 5 22
86 3 3 4 4 4 18
87 5 4 4 5 5 23
88 5 4 5 5 5 24
89 5 5 4 5 4 23
90 4 4 4 4 3 19
91 4 4 3 5 5 21
92 3 4 3 4 4 18
93 5 4 5 4 4 22
94 4 5 3 4 5 21
95 4 4 5 5 4 22
96 4 5 4 4 4 21
97 4 4 5 4 5 22
98 3 5 4 3 4 19
99 3 3 4 4 3 17
Lampiran 3
Data Penelitian
No. Desain Fitur Garansi Berat Warna Resolusi Memori Kepuasan
1 13 12 13 9 8 8 7 19
2 13 12 12 8 8 7 6 18
3 14 13 12 8 9 8 7 20
4 15 13 14 9 7 9 8 23
5 13 15 12 9 7 7 7 19
6 14 13 13 9 8 8 9 21
7 13 13 11 8 6 8 8 18
8 14 13 14 9 8 9 9 22
9 13 13 13 7 8 8 7 21
10 14 12 13 8 8 9 8 22
11 14 14 13 8 9 8 8 21
12 14 12 14 8 7 8 8 22
13 14 11 13 7 7 7 6 19
14 14 13 11 6 7 6 8 17
15 14 11 12 8 8 7 8 19
16 15 15 14 9 8 9 10 23
17 15 13 13 8 7 8 8 19
18 15 14 13 8 8 8 8 22
19 15 14 14 10 9 9 9 23
20 13 15 14 8 9 9 8 23
21 13 15 13 8 8 8 8 22
22 14 14 13 9 9 8 9 24
23 14 14 15 9 9 10 9 25
24 13 14 13 8 8 8 9 22
25 15 14 15 10 8 10 9 24
26 12 13 11 6 7 6 6 17
27 12 13 12 8 6 8 9 19
28 13 13 12 8 9 8 8 19
29 12 15 12 8 9 8 8 19
30 15 13 14 8 9 8 9 22
31 12 13 12 7 7 7 6 19
32 13 13 13 8 9 8 9 21
33 12 12 12 6 8 6 6 16
34 14 14 12 9 9 9 7 23
35 13 15 15 10 9 10 7 24
36 11 12 11 7 9 7 7 18
37 14 13 14 9 8 9 9 24
38 13 12 12 7 8 7 7 19
39 13 11 15 10 9 10 9 24
40 13 15 13 8 9 8 9 23
41 13 14 12 7 8 7 7 20
42 13 14 11 6 7 6 7 19
43 13 13 13 8 8 8 9 21
44 13 15 15 10 9 10 8 23
45 12 13 13 8 8 8 8 21
46 13 14 13 8 9 8 8 23
47 12 14 13 9 10 9 9 23
49 12 12 13 8 8 8 7 21
50 12 14 13 8 8 8 9 21
51 13 12 14 9 10 9 10 22
52 12 11 12 8 8 8 7 18
53 14 14 13 9 9 9 8 23
54 13 15 15 10 10 10 8 24
55 11 12 11 8 9 7 8 18
56 14 12 14 9 8 10 10 25
57 12 12 14 9 8 9 7 20
58 13 11 15 9 10 10 10 25
59 13 14 14 9 9 9 9 23
60 11 14 13 8 8 8 8 20
61 14 11 13 7 7 7 6 19
62 14 13 11 6 7 6 8 17
63 14 11 12 7 8 7 8 19
64 15 15 14 9 8 9 10 23
65 15 13 13 8 7 8 8 19
66 15 14 13 8 8 8 8 22
67 15 14 14 9 9 9 9 23
68 13 15 14 9 9 9 8 23
69 13 15 13 8 8 8 8 22
70 14 14 13 8 9 8 9 24
71 14 14 15 10 9 10 9 25
72 13 14 13 8 8 8 9 22
73 13 11 15 10 9 10 9 24
74 13 15 13 8 9 8 9 23
75 13 14 12 7 8 7 7 20
76 13 14 11 6 7 6 7 19
77 13 13 13 8 8 8 9 21
78 13 15 15 10 9 10 8 23
79 12 13 13 8 8 8 8 21
80 13 14 13 8 9 8 8 23
81 12 14 13 9 10 9 9 23
82 13 15 13 9 10 9 9 23
83 12 12 13 8 8 8 7 21
84 12 14 13 8 8 8 9 21
85 13 12 14 9 10 9 10 22
86 12 11 12 8 8 8 7 18
87 14 14 13 9 9 9 8 23
88 13 15 15 10 10 10 8 24
89 15 13 14 9 7 9 8 23
90 13 15 12 9 7 7 7 19
91 14 13 13 9 8 8 9 21
92 13 13 11 8 6 8 8 18
93 14 13 14 9 8 9 9 22
94 13 13 13 8 8 8 7 21
95 14 12 13 9 8 9 8 22
96 14 14 13 9 9 8 8 21
97 14 12 14 8 7 8 8 22
98 14 11 13 8 7 7 6 19
99 14 13 11 8 7 6 8 17
Lampiran 4. Uji Validitas Angket Karakteristik Produk
Correlations
Cor relatio ns
1,000 ,328** ,230* ** ,157 ,099 ,522**
, ,001 ,021 ,118 ,327 ,000
100 100 100 100 100 100
,328** 1,000 ,454** ** ,111 ,127 ,537**
,001 , ,000 ,270 ,207 ,000
100 100 100 100 100 100
,230* ,454** 1,000 ** ,036 ,178 ,481**
,021 ,000 , ,721 ,076 ,000
100 100 100 100 100 100
,428** ,393** ,355** ,163 ,187 ,527**
,000 ,000 ,000 ,104 ,062 ,000
100 100 100 100 100 100
,145 ,286** ,200* ** ,056 ,373** ,527**
,151 ,004 ,046 ,583 ,000 ,000
100 100 100 100 100 100
,234* ,220* ,252* * -,058 ,090 ,512**
,019 ,028 ,011 ,567 ,374 ,000
100 100 100 100 100 100
,302** ,191 ,287** ** ,206* ,231* ,598**
,002 ,057 ,004 ,040 ,021 ,000
100 100 100 100 100 100
,182 ,132 ,021 ,193 ,068 ,488**
,070 ,190 ,837 ,054 ,504 ,000
100 100 100 100 100 100
,114 ,118 ,241* ,246* ,299** ,485**
,259 ,244 ,016 ,014 ,002 ,000
100 100 100 100 100 100
,165 ,259** ,254* ,170 ,196 ,539**
,101 ,009 ,011 ,091 ,051 ,000
100 100 100 100 100 100
,399** ,218* ,058 * ,208* ,235* ,524**
,000 ,029 ,564 ,038 ,019 ,000
100 100 100 100 100 100
,284** ,135 ,212* ,329** ,270** ,512**
,004 ,180 ,034 ,001 ,007 ,000
100 100 100 100 100 100
,110 ,135 ,158 ,413** ,239* ,491**
,275 ,182 ,116 ,000 ,017 ,000
100 100 100 100 100 100
,167 ,220* ,035 ,242* ,205* ,474**
,097 ,028 ,729 ,015 ,041 ,000
100 100 100 100 100 100
,262** ,279** ,199* ** ,354** ,204* ,525**
,008 ,005 ,047 ,000 ,042 ,000
100 100 100 100 100 100
,157 ,111 ,036 1,000 ,304** ,477**
,118 ,270 ,721 , ,002 ,000
100 100 100 100 100 100
,099 ,127 ,178 ,304** 1,000 ,489**
,327 ,207 ,076 ,002 , ,000
100 100 100 100 100 100
,522** ,537** ,481** ** ,477** ,489** 1,000
,000 ,000 ,000 ,000 ,000 ,
100 100 100 100 100 100
Pearson Correlation Sig. (2-tailed) N Pearson Correlation Sig. (2-tailed) N Pearson Correlation Sig. (2-tailed) N Pearson Correlation Sig. (2-tailed) N Pearson Correlation Sig. (2-tailed) N Pearson Correlation Sig. (2-tailed) N Pearson Correlation Sig. (2-tailed) N Pearson Correlation Sig. (2-tailed) N Pearson Correlation Sig. (2-tailed) N Pearson Correlation Sig. (2-tailed) N Pearson Correlation Sig. (2-tailed) N Pearson Correlation Sig. (2-tailed) N Pearson Correlation Sig. (2-tailed) N Pearson Correlation Sig. (2-tailed) N Pearson Correlation Sig. (2-tailed) N Pearson Correlation Sig. (2-tailed) N Pearson Correlation Sig. (2-tailed) N Pearson Correlation Sig. (2-tailed) N ITEM01 ITEM02 ITEM03 ITEM04 ITEM05 ITEM06 ITEM07 ITEM08 ITEM09 ITEM10 ITEM11 ITEM12 ITEM13 ITEM14 ITEM15 ITEM16 ITEM17 TOTAL
ITEM01 ITEM02 ITEM03 ITEM16 ITEM17 TOTAL
Correlation is s ignif icant at the 0.01 lev el (2-tailed). **.
Uji Validitas Angket Kepuasan Konsumen
Correlations
Cor relations
1,000 ,258** ,138 ,236* ,074 ,517**
, ,010 ,169 ,018 ,466 ,000
100 100 100 100 100 100
,258** 1,000 ,383** ,292** ,263** ,687**
,010 , ,000 ,003 ,008 ,000
100 100 100 100 100 100
,138 ,383** 1,000 ,396** ,217* ,695**
,169 ,000 , ,000 ,030 ,000
100 100 100 100 100 100
,236* ,292** ,396** 1,000 ,291** ,713**
,018 ,003 ,000 , ,003 ,000
100 100 100 100 100 100
,074 ,263** ,217* ,291** 1,000 ,562**
,466 ,008 ,030 ,003 , ,000
100 100 100 100 100 100
,517** ,687** ,695** ,713** ,562** 1,000
,000 ,000 ,000 ,000 ,000 ,
100 100 100 100 100 100
Pearson Correlation Sig. (2-tailed) N
Pearson Correlation Sig. (2-tailed) N
Pearson Correlation Sig. (2-tailed) N
Pearson Correlation Sig. (2-tailed) N
Pearson Correlation Sig. (2-tailed) N
Pearson Correlation Sig. (2-tailed) N
ITEM01
ITEM02
ITEM03
ITEM04
ITEM05
TOTAL
ITEM01 ITEM02 ITEM03 ITEM04 ITEM05 TOTAL
Correlation is s ignif icant at the 0.01 level (2-tailed). **.
Lampiran 5
Uji Reliabilitas Angket Karakteristik Produk
Reliability
****** Method 1 (space saver) will be used for this analysis ******
R E L I A B I L I T Y A N A L Y S I S - S C A L E (A L P H A)
Mean Std Dev Cases
1. ITEM01 4,2800 ,6044 100,0 2. ITEM02 4,2700 ,7366 100,0 3. ITEM03 4,1900 ,6308 100,0 4. ITEM04 4,1700 ,7115 100,0 5. ITEM05 4,1400 ,5864 100,0 6. ITEM06 4,3500 ,6571 100,0 7. ITEM07 4,2100 ,6711 100,0 8. ITEM08 4,2200 ,6289 100,0 9. ITEM09 4,1600 ,6624 100,0 10. ITEM10 4,0800 ,7873 100,0 11. ITEM11 4,2000 ,6030 100,0 12. ITEM12 4,1600 ,6775 100,0 13. ITEM13 4,1300 ,6614 100,0 14. ITEM14 4,0800 ,6769 100,0 15. ITEM15 4,0900 ,6681 100,0 16. ITEM16 4,1300 ,6765 100,0 17. ITEM17 4,1500 ,6416 100,0
N of Statistics for Mean Variance Std Dev Variables
SCALE 71,0100 33,4645 5,7849 17
Item-total Statistics Scale Scale Corrected Mean Variance Item- Alpha if Item if Item Total if Item Deleted Deleted Correlation Deleted ITEM01 66,7300 30,1789 ,4398 ,8136
ITEM02 66,7400 29,4267 ,4374 ,8135
ITEM03 66,8200 30,3511 ,3907 ,8162
ITEM04 66,8400 29,6307 ,4296 ,8140
ITEM05 66,8700 30,2355 ,4474 ,8133
ITEM06 66,6600 30,0044 ,4207 ,8145
ITEM07 66,8000 29,2727 ,5152 ,8088
ITEM08 66,7900 30,3090 ,3986 ,8157
ITEM09 66,8500 30,1894 ,3897 ,8163
ITEM10 66,9300 29,1769 ,4313 ,8142
ITEM11 66,8100 30,1757 ,4415 ,8135
ITEM12 66,8500 29,9066 ,4182 ,8146
ITEM14 66,9300 30,2072 ,3762 ,8171
ITEM15 66,9200 29,8521 ,4337 ,8137
ITEM16 66,8800 30,1875 ,3793 ,8169
ITEM17 66,8600 30,2428 ,3982 ,8157
Uji Reliabilitas Angket Kepuasan Konsumen
Reliability
****** Method 1 (space saver) will be used for this analysis ******
R E L I A B I L I T Y A N A L Y S I S - S C A L E (A L P H A)
Mean Std Dev Cases
1. ITEM01 4,2700 ,6333 100,0 2. ITEM02 4,3000 ,6742 100,0 3. ITEM03 4,1300 ,7475 100,0 4. ITEM04 4,1900 ,7344 100,0 5. ITEM05 4,3000 ,6276 100,0
N of Statistics for Mean Variance Std Dev Variables
SCALE 21,1900 4,7817 2,1867 5
Item-total Statistics Scale Scale Corrected Mean Variance Item- Alpha if Item if Item Total if Item Deleted Deleted Correlation Deleted ITEM01 16,9200 3,7511 ,5566 ,6415
ITEM02 16,8900 3,2100 ,6624 ,5470
ITEM03 17,0600 3,0671 ,6415 ,5557
ITEM04 17,0000 3,0303 ,6741 ,5377
ITEM05 16,8900 3,6342 ,7149 ,6166
Lampiran 6
Deskripsi Data
Descriptives
Des criptive Statistics
100 11,00 15,00 13,3100 ,9816 100 11,00 15,00 13,2600 1,2441 100 11,00 15,00 13,0300 1,1051
100 6,00 10,00 8,3100 ,9816
100 6,00 10,00 8,2400 ,9547
100 6,00 10,00 8,1900 1,0607 100 6,00 10,00 8,1400 1,0349 100 16,00 25,00 21,1900 2,1867 100
Desain Fitur Garansi Berat Warna Resolusi Memori
Kepuas an Kons umen V alid N (lis tw is e)
Lampiran 7
Uji Normalitas
NPar Tests
Des criptive Statistics
100 -2,2E-09 ,855085 -1,9594 2,2445 Unstandardiz ed Res idual
N Mean Std. Deviation Minimum Max imum
One -Sam ple Kolm ogorov-Sm irnov Te st
100 -2,197921E-09 ,855085 ,056 ,038 -,056 ,564 ,908 N
Mean
Std. Dev iation Normal Parametersa,b
A bs olute Positive Negative Mos t Ex treme
Dif f erences
Kolmogorov-Smirnov Z A sy mp. Sig. (2-tailed)
Unstandardiz ed Residual
Test dis tribution is Normal. a.
Lampiran 8
Uji Multikolinieritas
Regression
V ariables Entere d/Re m ove db
Memori, Fitur, Des ain, Warna,
Garansi, Berat, Resolus ia , Enter Model
1
V ariables Entered
V ariables
Remov ed Method
A ll requested v ariables entered. a.
Dependent V ariable: Kepuas an Konsumen b.
Model Sum m ary
,920a ,847 ,835 ,8870
Model 1
R R Square
Adjusted R Square
Std. Error of the Estimate
Predictors: (Constant), Memori, Fitur, Des ain, Warna, Garansi, Berat, Resolus i
a.
ANOV Ab
401,004 7 57,286 72,809 ,000a
72,386 92 ,787
473,390 99 Regression Residual Total Model 1 Sum of
Squares df Mean Square F Sig.
Predictors: (Constant), Memori, Fitur, Des ain, Warna, Garansi, Berat, Res olusi a.
Dependent Variable: Kepuas an Konsumen b.
Coe fficientsa
-6,372 1,791 -3,558 ,001
,286 ,105 ,129 2,739 ,007 ,755 1,325
,322 ,075 ,183 4,266 ,000 ,903 1,108
,730 ,164 ,369 4,446 ,000 ,242 4,139
-,369 ,178 -,166 -2,076 ,041 ,261 3,833
,415 ,121 ,181 3,421 ,001 ,592 1,689
,877 ,225 ,426 3,893 ,000 ,139 7,190
,300 ,107 ,142 2,802 ,006 ,649 1,540
(Cons tant) Desain Fitur Garansi Berat Warna Resolusi Memori Model 1
B Std. Error Unstandardiz ed
Coef f icients
Beta Standardi
zed Coef f icien
ts
t Sig. Toleranc e VIF Collinearity Statistics
Lampiran 9
Uji Heteroskedastisitas
Regression
V ariables Entere d/Re m ove db
Memori, Fitur, Desain, Warna,
Garansi, Berat, Resolus ia , Enter Model
1
V ariables Entered
V ariables
Remov ed Method
A ll requested variables entered. a.
Dependent V ariable: A BS_RES1 b.
Model Sum m ary
,206a ,042 -,030 ,530856 Model
1
R R Square
Adjusted R Square
Std. Error of the Estimate
Predictors: (Constant), Memori, Fitur, Des ain, Warna, Garansi, Berat, Resolus i
a.
ANOV Ab
1,150 7 ,164 ,583 ,768a
25,926 92 ,282
27,076 99 Regression Residual Total Model 1 Sum of
Squares df Mean Square F Sig.
Predictors: (Constant), Memori, Fitur, Des ain, Warna, Garansi, Berat, Res olusi a.
Dependent Variable: A BS_RES1 b.
Coe fficientsa
-,543 1,072 -,506 ,614
9,513E-02 ,063 ,179 1,521 ,132
1,595E-02 ,045 ,038 ,353 ,725
-2,47E-02 ,098 -,052 -,252 ,802 -,146 ,106 -,275 -1,375 ,173
5,732E-02 ,073 ,105 ,789 ,432
,122 ,135 ,248 ,905 ,368
-2,40E-02 ,064 -,048 -,376 ,708 (Cons tant) Desain Fitur Garansi Berat Warna Resolusi Memori Model 1
B Std. Error Unstandardiz ed
Coef f icients
Beta Standardi
zed Coef f icien
ts
t Sig.
Lampiran 10
Uji Hipotesis
Regression
Des criptive Statistics
21,1900 2,1867 100
13,3100 ,9816 100
13,2600 1,2441 100 13,0300 1,1051 100
8,3100 ,9816 100
8,2400 ,9547 100
8,1900 1,0607 100 8,1400 1,0349 100 Kepuas an Konsumen
Desain Fitur Garansi Berat Warna Resolusi Memori
Mean Std. Dev iation N
Cor relations
1,000 ,292 ,386 ,825 ,702 ,592 ,842 ,600 ,292 1,000 ,049 ,289 ,224 -,134 ,176 ,245 ,386 ,049 1,000 ,163 ,231 ,270 ,230 ,199 ,825 ,289 ,163 1,000 ,746 ,462 ,857 ,456 ,702 ,224 ,231 ,746 1,000 ,491 ,855 ,484 ,592 -,134 ,270 ,462 ,491 1,000 ,553 ,385 ,842 ,176 ,230 ,857 ,855 ,553 1,000 ,546 ,600 ,245 ,199 ,456 ,484 ,385 ,546 1,000 , ,002 ,000 ,000 ,000 ,000 ,000 ,000 ,002 , ,314 ,002 ,012 ,092 ,040 ,007 ,000 ,314 , ,052 ,010 ,003 ,011 ,024 ,000 ,002 ,052 , ,000 ,000 ,000 ,000 ,000 ,012 ,010 ,000 , ,000 ,000 ,000 ,000 ,092 ,003 ,000 ,000 , ,000 ,000 ,000 ,040 ,011 ,000 ,000 ,000 , ,000 ,000 ,007 ,024 ,000 ,000 ,000 ,000 ,
100 100 100 100 100 100 100 100
100 100 100 100 100 100 100 100
100 100 100 100 100 100 100 100
100 100 100 100 100 100 100 100
100 100 100 100 100 100 100 100
100 100 100 100 100 100 100 100
100 100 100 100 100 100 100 100
100 100 100 100 100 100 100 100
Kepuasan Konsumen Desain Fitur Garansi Berat Warna Resolusi Memori Kepuasan Konsumen Desain Fitur Garansi Berat Warna Resolusi Memori Kepuasan Konsumen Desain Fitur Garansi Berat Warna Resolusi Memori Pearson Correlation Sig. (1-tailed) N Kepuasan
V ariables Entere d/Re m ove db Memori, Fitur, Desain, Warna, Garansi, Berat, Resolusia , Enter Model 1 V ariables Entered V ariables
Remov ed Method
A ll requested variables entered. a.
Dependent V ariable: Kepuasan Konsumen b.
Model Sum m ary
,920a ,847 ,835 ,8870
Model 1
R R Square
Adjusted R Square
Std. Error of the Estimate
Predictors: (Constant), Memori, Fitur, Des ain, Warna, Garansi, Berat, Resolus i
a.
ANOV Ab
401,004 7 57,286 72,809 ,000a
72,386 92 ,787
473,390 99 Regression Residual Total Model 1 Sum of
Squares df Mean Square F Sig.
Predictors: (Constant), Memori, Fitur, Des ain, Warna, Garansi, Berat, Res olusi a.
Dependent Variable: Kepuas an Konsumen b.
Coe fficientsa
-6,372 1,791 -3,558 ,001
,286 ,105 ,129 2,739 ,007
,322 ,075 ,183 4,266 ,000
,730 ,164 ,369 4,446 ,000
-,369 ,178 -,166 -2,076 ,041
,415 ,121 ,181 3,421 ,001
,877 ,225 ,426 3,893 ,000
,300 ,107 ,142 2,802 ,006
(Cons tant) Desain Fitur Garansi Berat Warna Resolusi Memori Model 1
B Std. Error Unstandardiz ed
Coef f icients
Beta Standardi
zed Coef f icien
ts
t Sig.
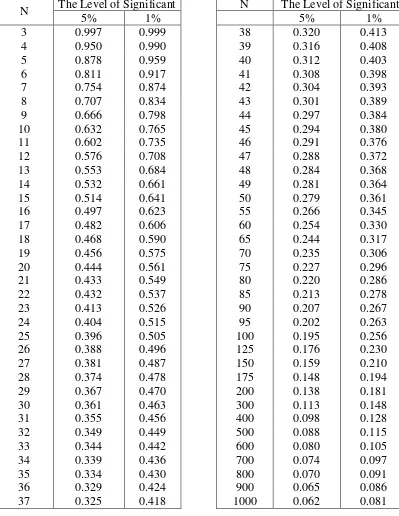
TABLE VALUES OF r
product momentN
The Level of Significant
N
The Level of Significant
5%
1%
5%
1%
3
0.997
0.999
38
0.320
0.413
4
0.950
0.990
39
0.316
0.408
5
0.878
0.959
40
0.312
0.403
6
0.811
0.917
41
0.308
0.398
7
0.754
0.874
42
0.304
0.393
8
0.707
0.834
43
0.301
0.389
9
0.666
0.798
44
0.297
0.384
10
0.632
0.765
45
0.294
0.380
11
0.602
0.735
46
0.291
0.376
12
0.576
0.708
47
0.288
0.372
13
0.553
0.684
48
0.284
0.368
14
0.532
0.661
49
0.281
0.364
15
0.514
0.641
50
0.279
0.361
16
0.497
0.623
55
0.266
0.345
17
0.482
0.606
60
0.254
0.330
18
0.468
0.590
65
0.244
0.317
19
0.456
0.575
70
0.235
0.306
20
0.444
0.561
75
0.227
0.296
21
0.433
0.549
80
0.220
0.286
22
0.432
0.537
85
0.213
0.278
23
0.413
0.526
90
0.207
0.267
24
0.404
0.515
95
0.202
0.263
25
0.396
0.505
100
0.195
0.256
26
0.388
0.496
125
0.176
0.230
27
0.381
0.487
150
0.159
0.210
28
0.374
0.478
175
0.148
0.194
29
0.367
0.470
200
0.138
0.181
30
0.361
0.463
300
0.113
0.148
31
0.355
0.456
400
0.098
0.128
32
0.349
0.449
500
0.088
0.115
33
0.344
0.442
600
0.080
0.105
34
0.339
0.436
700
0.074
0.097
35
0.334
0.430
800
0.070
0.091
36
0.329
0.424
900
0.065
0.086
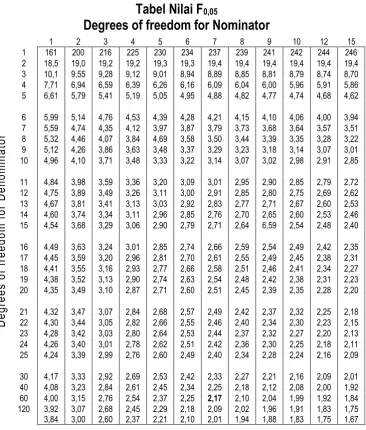
Tabel Nilai F
0,05Degrees of freedom for Nominator
D
e
g
re
e
s
o
f
fr
e
e
d
o
m
f
o
r
D
e
n
o
m
in
a
to
r
D
e
g
re
e
s
o
f
fr
e
e
d
o
m
f
o
r
D
e
n
o
m
in
a
to
r
1 2 3 4 5 6 7 8 9 10 12 15
1 161 200 216 225 230 234 237 239 241 242 244 246
2 18,5 19,0 19,2 19,2 19,3 19,3 19,4 19,4 19,4 19,4 19,4 19,4
3 10,1 9,55 9,28 9,12 9,01 8,94 8,89 8,85 8,81 8,79 8,74 8,70
4 7,71 6,94 6,59 6,39 6,26 6,16 6,09 6,04 6,00 5,96 5,91 5,86
5 6,61 5,79 5,41 5,19 5,05 4,95 4,88 4,82 4,77 4,74 4,68 4,62
6 5,99 5,14 4,76 4,53 4,39 4,28 4,21 4,15 4,10 4,06 4,00 3,94
7 5,59 4,74 4,35 4,12 3,97 3,87 3,79 3,73 3,68 3,64 3,57 3,51
8 5,32 4,46 4,07 3,84 4,69 3,58 3,50 3,44 3,39 3,35 3,28 3,22
9 5,12 4,26 3,86 3,63 3,48 3,37 3,29 3,23 3,18 3,14 3,07 3,01
10 4,96 4,10 3,71 3,48 3,33 3,22 3,14 3,07 3,02 2,98 2,91 2,85
11 4,84 3,98 3,59 3,36 3,20 3,09 3,01 2,95 2,90 2,85 2,79 2,72
12 4,75 3,89 3,49 3,26 3,11 3,00 2,91 2,85 2,80 2,75 2,69 2,62
13 4,67 3,81 3,41 3,13 3,03 2,92 2,83 2,77 2,71 2,67 2,60 2,53
14 4,60 3,74 3,34 3,11 2,96 2,85 2,76 2,70 2,65 2,60 2,53 2,46
15 4,54 3,68 3,29 3,06 2,90 2,79 2,71 2,64 6,59 2,54 2,48 2,40
16 4,49 3,63 3,24 3,01 2,85 2,74 2,66 2,59 2,54 2,49 2,42 2,35
17 4,45 3,59 3,20 2,96 2,81 2,70 2,61 2,55 2,49 2,45 2,38 2,31
18 4,41 3,55 3,16 2,93 2,77 2,66 2,58 2,51 2,46 2,41 2,34 2,27
19 4,38 3,52 3,13 2,90 2,74 2,63 2,54 2,48 2,42 2,38 2,31 2,23
20 4,35 3,49 3,10 2,87 2,71 2,60 2,51 2,45 2,39 2,35 2,28 2,20
21 4,32 3,47 3,07 2,84 2,68 2,57 2,49 2,42 2,37 2,32 2,25 2,18
22 4,30 3,44 3,05 2,82 2,66 2,55 2,46 2,40 2,34 2,30 2,23 2,15
23 4,28 3,42 3,03 2,80 2,64 2,53 2,44 2,37 2,32 2,27 2,20 2,13
24 4,26 3,40 3,01 2,78 2,62 2,51 2,42 2,36 2,30 2,25 2,18 2,11
25 4,24 3,39 2,99 2,76 2,60 2,49 2,40 2,34 2,28 2,24 2,16 2,09
30 4,17 3,33 2,92 2,69 2,53 2,42 2,33 2,27 2,21 2,16 2,09 2,01
40 4,08 3,23 2,84 2,61 2,45 2,34 2,25 2,18 2,12 2,08 2,00 1,92
60 4,00 3,15 2,76 2,54 2,37 2,25 2,17 2,10 2,04 1,99 1,92 1,84
120 3,92 3,07 2,68 2,45 2,29 2,18 2,09 2,02 1,96 1,91 1,83 1,75