INFORMATION ASYMMETRY: EVIDENCE FROM IRAN LISTED COMPANIES
Jamal Roudaki
Faculty of Agribusiness and Commerce Lincoln University, New Zealand Jafar Babajani
School of Accounting and Management, Allameh Tabatabaei University Tehran Iran
Arash Tahriri
Tehran University, Tehran Iran
Abstract
Inherent in the International and indigenous accounting standards is managerial discretion in the application of accounting methods, preparation of financial reports and disclosures. Extent literature indicates that almost all companies are engaged in some type of earnings management (Healy, 1985; Perry & Williams, 1994; Defond & Jiambalvo, 1994; Jordon, Clark, & Pate, 2008). A crucial question posed for accounting research is to identify the environmental conditions under which managerial discretion (i.e. accounting choices) are exercised. Using empirical analysis this paper investigates one of the fundamental conditions of earnings management, information asymmetry between managers and investors. When information asymmetry is high, stakeholders including investors do not have sufficient resources, incentives, or access to relevant information to monitor managers’ actions, which gives rise to earnings management. Empirical results show that the level of information asymmetry index which is the combination of five important Tehran Stock Exchange (TSE) relevant proxies (volume of trade, stock price variation, P/E ratio, number of trading days and firm age) has a positive statistically significant effect on the extent of earnings management practiced by companies listed on the TSE.
Introduction
Growing empirical and systematic evidence supports the argument that earnings management (EM) is a common practice in the financial report of reporting entities (Healy, 1985; Perry & Williams, 1994; Defond & Jiambalvo, 1994). A fundamental question posed for accounting research is to identify the environmental conditions under which accounting choices became available to managers manipulate earnings. It is obvious that managers have a series of information emerging from the firm and its financial condition that shareholders do not have that is known as asymmetry between managers and stakeholder including current shareholders and potential investors. This paper examines how information asymmetry between managers and investors impacts the level of EM practiced by managers of companies listed in the Tehran Stock Exchange the sole share market in Iran.
Firm managers manage earnings with respect to several goals and motivations. It seems that a primary motive of EM by managers is to influence stock prices and manipulate company’s stock market. Information available to the stock market affects how investors interpret and react to the financial information released by firms, and therefore influence the extent to which managers can impact the stock market with managed financial reporting.
In analytical models of EM, Dye (1988) and Trueman and Titman (1988) show that information asymmetry is a necessary condition for the practice of EM. Furthermore, Schipper (1989) suggests the need for empirical work which considers the information environment surrounding the practice of EM. This study hypothesize that the level of information asymmetry between managers and the stock market has a meaningful impact on the magnitude of EM. The reason is that when information asymmetry is high, investors do not have the necessary information to undo the manipulated earnings for their decision making needs (Richardson, 2000).
Test results suggest a significant, positive relationship between the composite score of information asymmetry (which is a combination of five important and relevant proxies of information asymmetry) and EM after controlling for other previously documented determinants of EM. The result is consistent with the view that the greater information asymmetry between managers and the stock market and other company’s external parties collectively, the more likely the firm is to manage earnings. In this paper, EM is captured through accruals manipulation.
Literature Review and hypothesis development
In the absence of published research results about Iranian information asymmetry, this paper consider to brow a background of the study in this area using world and regional literature. While the stock market in Iran is yet to be developed, most of listed companies are not consider this market a prime source of funding.
The primary role of financial statements is to report a company’s financial information to internal and external financial statement users in a timely and reliable manner. A controversial component of these annual reports is accounting earnings and financial and non-financial data about corporate governance. Some major decisions that are shaped by available information in annual reports are: executive compensation, debt covenants, capital rising, and perhaps most importantly, for external investors to make investment decisions. Ideally, the reported earnings should reflect a firm’s underlying operating economics and facilitate efficient resource allocation within the firm. However, due to the control advantages that managers have over external information users in collecting and reporting firm specific information managers have the opportunity to present earnings in a manner that is most supportive to their financial reporting discretion. Commonly referred as managing the earnings, this topic is of considerable interest to academics and practitioners.
In a perfect market, there is no role for financial disclosures and thus no demand for accounting discretion (Watts & Zimmerman, 1978 1986; Holthausen & Leftwich 1983). However, with market imperfections such as information asymmetry, financial reporting is necessary for efficient contracting. However, due to the inherent advantage of asymmetric information and flexibility afforded in reporting, wealth can be transferred from stakeholders to managers. There are two major perspectives in the field of EM. The opportunistic behaviour perspective, first enunciated by Watts and Zimmerman (1986), holds that managers take the opportunity to manage earnings in order to maximize their own utilities at the expense of the contracting parties and stakeholders. On the contrary, the second perspective, the signalling or information perspective that stems from the work by Holthausen and Leftwich (1983), proposes that managers exercise discretion in order to communicate inside information to outside investors to help investors predict and form expectations regarding the firm’s future performance.
financial statement users. The second consequence is that it may increase the expected costs of managed earnings (such as legal liability, disputes with the auditor, reputation loss and even pecuniary punishment).
Literature of information asymmetry indications that both sets of incentives of EM (opportunistic behaviour and the information perspective) show a positive relationship with information asymmetry, the explanation for each relationship differs under each incentive condition as discussed in the following sections.
Information asymmetry and earnings management: information perspective
The information perspective of EM suggests that accounting choices are made to reveal managers’ expectation about the future performance of the firm. For example, managers may smooth earnings to communicate a firm’s permanent earnings. Hunt, Moyer, and Shevlin (1995), Collins and Deangelon (1990), and Subramanyam (1995) all find empirical evidence consistent with this information perspective of EM. Hunt et al. (1995) argue that information asymmetry must exist between the managers and firm shareholders for managers to have incentives to make informative disclosures to the market. Without such an information gap, there would be no benefit to smoothing earnings, especially given the potential costs of practicing EM.
Likewise, previous research has demonstrated that information asymmetry translates into higher transaction costs for trading shares of the firm which, in turn, raises the required rate of return and lowers the current stock price. Bartov and Bodnar (1996) argue that value-maximizing managers have incentives to choose more informative disclosures to reduce the degree of information asymmetry among market participants. Moreover, Diamond and Verrecchia (1991) suggest that informative disclosures level the playing field for investors, which improves liquidity. An implication of the Diamond and Verrecchia (1991) model is that the firms with the highest level of information asymmetry stand to gain the most in liquidity (and therefore prices) from more informative disclosures. Given these arguments, it is hypothesized that the greater the level of information asymmetry, the greater is the expected magnitude of EM under an information perspective.
Information asymmetry and earnings management: opportunism perspective
In two analytical models, Dye (1988) and Trueman and Titman (1988), rely on this persistent information asymmetry (or blocked information condition) as a condition for practicing EM. For example Dye (1988) assumes an overlapping generation of owners, where the selling shareholders wish to sell to a set of buying shareholders. The selling shareholders instruct management to follow a certain EM strategy to create a favourable impression on the buying group. In this model, the inability to undo the EM is due to asymmetric information. Therefore, a condition which must be met for EM to exist in these analytical models is that the information asymmetry persists throughout the transactions. There is some outstanding empirical research which examines the impact of information asymmetry on the level of EM. Richardson (2000) conducted an empirical investigation of the relationship between information asymmetry and EM predicted by Dye (1988) and Trueman and Titman (1988). His empirical results suggest a systematic relationship between the magnitude of information asymmetry and the level of EM in a broad sample setting around seasoned equity offerings. In fact he shows the significant effect of information asymmetry on both types of EM: accounting EM (accruals manipulation) and real EM (cutting R&D expenditures). Following the work of Richardson (2000), Cheng (2006) examines if EM is positively related to information asymmetry in different environments. Moreover, he tried to understand the differences in cultural and business factors between the east and the west. The results show that holding information may have “value” since information asymmetry can benefit those firms that undertake EM. He concludes that information asymmetry has a statistically significant impact on the level of EM practiced by Taiwanese companies. He believes that information asymmetry in Taiwan is higher than that in the west so that Taiwanese managers’ EM behaviour may have a greater effect on their firms’ stock prices.
Kang, Palman, and Sudit, (2009) examine the effect of business news coverage on EM in the USA. They empirically investigate whether a firm’s information environment such as the degree of information asymmetry, business news coverage, and analyst coverage affects EM. Using 35,352 firm-years and 105,604 news items from the Wall Street Journal for firms traded on the NYSE, AMEX, and NASDAQ markets over 11 years from 1994 to 2004, they find empirical evidence that the magnitude of EM is positively associated with the level of information asymmetry and negatively associated with analyst coverage. News coverage, interestingly, has a positive relationship with the magnitude of EM, indicating that a greater number of news releases generate more motivation for managers to engage in EM. Their results also suggest that the effects of a firm’s information environment on EM are stronger for firms engaging in increasing manipulation than firms engaging in income-decreasing manipulation.
Iranian context (listed companies on the Tehran Stock Exchange are considered as field of the study) therefore the hypothesis of the paper is as follows:
The magnitude of information asymmetry has a statistically significant effect on the level of earnings management.
Methodology
Methodology of this paper includes measurement of information asymmetry and EM in the following sections. Statistical model of the study is developed based of the hypothesis that presented in the previous section.
Measuring information asymmetry
Several proxies have been implemented in the literature to measure the concept of information asymmetry. Most of them are not usable with respect to the socio-economic environment of companies listed on the TSE board. For example bid-ask spreads and analysts’ related variables (such as the number of analysts following particular securities and dispersion in analysts’ forecasts) are the most commonly used measures for information asymmetry in the previous literature. Neither of them is applicable in the Iranian capital market context. Because a considerable number of firms listed on the TSE experienced massive sell or buy waiting lists during the last decade. Therefore there were no selling prices in the TSE trading system and therefore such variable cannot be used. Furthermore because of shortage of market makers on the TSE this variable is not similar to ones used in other sophisticated financial markets. Therefore we cannot rely on the registered bid or ask prices in the trading system because some of major stockholders or even few existing market makers manipulate proposed prices to achieve their goals, or the prices are missing. It should be mentioned that TSE is one of the emerging and thin capital markets in the world and it does not have sufficient depth and liquidity to adjust and ignoring the artificial proposed pricing, especially in the case of major and institutional stockholders which are completely dominant in the market.
On the other hand we cannot use the analysts’ related variables for measuring the level of information asymmetry in the TSE listed companies because there is no database or archive for the nature, number and estimations of financial analysts available for researchers.
Consequently with respect to the above considerations and related literature we choose five proxies for measuring the extent of information asymmetry for TSE listed companies. These variables are selected with respect to the unique socio-economic condition of the Iranian stock market and the related literature. These five proxies are explained in the following paragraphs:
volume is affected by the number of outstanding shares, so this research uses turnover instead. Turnover is defined as trading volume divided by outstanding shares (See Lo and Wang (2000) for a systematic description of different measures of trading volume). Share turnover is also a measure of liquidity, it captures the willingness of investors to buy and to sell stocks. This willingness to transact in firm shares should be inversely related to the existence of possible information. Mohd (2005), Leuz & Verrechia (2000), Roulstone (2003) and bartov and bodnar (1996) used this variable as a proxy for information asymmetry.
Volatility of Stock Prices: Following Bhagat, Marr, and Thompson (1985), Blackwell, Marr, and Spivey (1990), and Krishnaswami and Subramaniam (1999), this study adopts the residual volatility in daily stock returns as the proxy for information asymmetry. We measure this proxy as the dispersion in the market adjusted daily stock returns in the year. If the investors and the firm’s managers are equally well-informed about the economy-wide factors influencing the firm’s value, then the residual volatility in the firm’s stock returns captures the information asymmetry between the investors and the managers about firm-specific information. Stock expected returns are fraught with different levels of uncertainty in prediction. The higher the level of information asymmetry confronting the investors, the greater the probability of inaccurate prediction of the expected stock returns by them, therefore it is expected that firms with higher information asymmetry about their value to have higher residual volatility in their stock returns.
information asymmetry proxies which do not have inflation related systematic error.
Number of Trading Days: This measure is one of the TSE specific measures of information asymmetry. Usually when some specific events are occurring for a listed firm (such as EPS adjustment news, calling a stockholders’ meeting, and capital raising) the stock trading activity of that firm will be closed by stock exchange commission until the situation is clear and the related information is distributed. This procedure is done by legal authorities for protecting the individual investors. Furthermore, a shortage or even lack of necessary information about the listed firms may cause trading activity to be stopped. In this way when a company does not present sufficient information to be distributed by the stock exchange commission, its trading activity will be terminated until the information flow situation becomes normal. Nevertheless stopping the share trading activity of listed firms implies that there is some extent of information asymmetry between internal managers and external investors. So the number of firm’s stock trading days is a meaningful and relevant proxy for information asymmetry in the socio-economic condition of the TSE. More trading days for a firm means that the situation of information flow is normal and the level of information asymmetry is less. It is assumed that more information surrounding companies which their stocks are traded more often.
Firm Age: Some researchers such as Leary and Roberts (2007) and Krasker (1986) have used firm age for a measure of information asymmetry. Older firms may face less information asymmetry because they tend to be more mature firms, have established and time-tested disclosure policies and practices, and receive more attention from the market and regulators (Diamond and Verrecchia, 1991; Harris, 1994). This proxy is measured as the number of years from the date of the company first listing on the TSE.
asymmetry. Therefore, the largest (smallest) value the variable IA-index can take is 25 (5) for the firms with the highest (lowest) degree of information asymmetry. Table 1 and the diagram 1 in the result section of the paper show descriptive statistics for the information asymmetry index.
Measuring earnings management
According to Ronen and Yaari (2008) EM is a collection of managerial decisions that may result in reporting untrue short-term value-maximizing earnings as preserved by management. EM can be Beneficial: it signals long-term value; Pernicious: it conceals short- or long-long-term value; Neutral: it reveals the short-term true performance. The managed earnings result from taking production/investment actions before earnings are realized, or making accounting choices that affect the earnings numbers and their interpretation after the true earnings are realized.
Most of the previous research studies have measured EM by using “discretionary accruals” (which means accounting based EM). Therefore this paper focuses on the same accounting based EM which means considering accruals behaviour. Accruals arise when there is a discrepancy between the timing of cash flows and the timing of the earnings recognition of the transaction. Non-discretionary accruals are accruals that arise from transactions made in the current period that are normal for the firm given its performance level and business strategy, industry conventions, macro-economic events, and other economic factors. Discretionary accruals are accruals that generate from transactions made or accounting treatments chosen in order to manage earnings (Ronen and Yaari 2008).
Jones (1991) offers a model to help identify firms that manage earnings. The objective of this model is to segregate expected (normal or nondiscretionary) accruals, and the difference (residual) is described as managed (or discretionary) accruals. The measure of the managed accounting accrual used in this research is estimated using the Jones model as modified by Kothari, Leone and Wasley (2004), i.e., it is the residual in the below model:
To employ a large number of observations, we run the regression on all firms in the same industry each year (cross-section approach). The non-discretionary accruals (NDACC) are the fitted values of Regression (1) and the discretionary accruals (DACC) which is the measure of the level of EM, are the deviations of total accruals from non-discretionary accruals (DACC = TACC – NDACC). This study did not use real earnings management (REM) due to unavailability of necessary information in the Iranian financial market. Literature of REM shows extensive use of REM which is defined as changing the time of transactions (Ewert & Wagenhofer, 2005) or altering operating, financing, and investing activities (Roychowdhury, 2006; Xu, Taylor, and Dugan, 2007) in financial reporting of many companies from almost all countries around the globe (Xu, Taylor, and Dugan, 2007). The end result of REM and EM are aiming the same, misleading external users of published financial information.
Statistical model for hypothesis testing
Obviously, information asymmetry between firm managers and investors is not the sole determinant of managers’ accounting choices. Two important incentives for managing earnings are to reduce political costs and avoid violating debt covenants. Past research suggests that political process theory has implications for the determination of accounting choices (Watts & Zimmerman, 1978). For example, Zmijewski and Hagerman (1981) suggest that political costs increase with firm size and with firm risk. Managers of large and/or high risk firms, therefore, have greater incentives to exploit the latitude in accounting to reduce these political costs. Firm size, the firm’s market to book ratio, and sales growth are used as proxies for a firm’s size and risk. Moreover, Sweeney (1994) shows evidence that managers are more likely to exploit the latitude in accounting the closer the firm is to binding debt covenants. Therefore, a firm’s debt to equity ratio is used as proxy for the firm’s proximity to binding debt covenants. Considering the past research in this area, this study anticipated that the level of EM will increase as the level of firm leverage and risk increase. Apart from the positive theory implication of firm size, the size of firm may also be capturing a firm’s information environment and could exhibit a negative relationship with the level of managed accruals. The existing empirical literature about the impact of size on the magnitude of EM also shows mixed results (both negative and positive effect). Therefore, this study does not attempt predicting the sign of the relationship between firm size and the level of EM.
Using IA-index as a composite measure of information asymmetry between the firm and the market, this study suggests the following model to examine the relationship between EM and information asymmetry:
it t i t
i t
i t
i t
i t
i IAindex DEBT MKTBV SIZE GROWTH
DACC,
0
1 ,
2 ,
3 ,
4 ,
5 ,
In the above model, DACC is the discretionary (managed) accounting accruals under modified Jones model as modified by Kothari, Leone and Wasley (2004) using the cross-section estimation approach. IA-index is the information asymmetryindex which is measured by compositing five important and relevant proxies (volume of trade, stock price variation, P/E ratio, numbers of trading days, and firm age) as explained before. DEBT is the ratio of long-term debt divided by the book value of equity, and MKTBV is market capitalization divided by the book value of equity. In this model SIZE is natural log of the market capitalization and GROWTH is net revenues for the current year less net revenues for the previous year scaled by net revenues for the previous year. The test of the research hypothesis will be performed by estimating
1. It isanticipated that an
1 that is significantly greater that zero would provide evidence of a positive effect of information asymmetry level on the magnitude of EM.Sample selection
The population of this study consists of all Iranian non-financial firms listed on the Tehran Stock Exchange over 9 years (2000 to 2008). Sample firms should satisfy two criteria of 1) listed at TSE from 2000 to 2008 with no delisting record and 2) The end of company’s fiscal years should be at 20 March of each year (This is the date that set as end of fiscal year because according to the Iranian calendar year usually begins within a day of 21 March of the Gregorian calendar).
Empirical results
Results are presented in two sections of descriptive and regression analysis (hypothesis testing) which the resent section presents results of running the study model.
Descriptive statistics
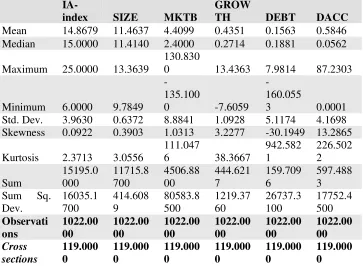
Table 1 shows the information about central parameters and distribution of all of the variables. This table presents 1022 firm-year observations which are derived from 119 firms over nine years. The table shows that all of the variables have positive skewness but with respect to size of sample which is big enough, the normality matter can be forgotten. With respect to the table 1 it is obvious that the mean of IA-index is around 15 and the max and min are 25 and 6 respectively.
Table 1: descriptive statistics of used variables
scores lower or equal to 10, the first quintile). As it can be seen in this diagram the distribution of information asymmetry indexes are bell shaped similar to other social phenomena.
Diagram 1: distribution of information asymmetry index (IA-index)
Hypothesis testing
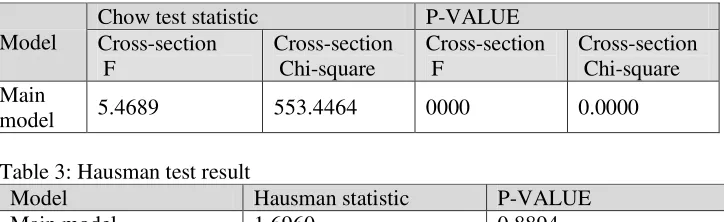
This study uses panel data regression model to extract the results. In order to select the appropriate method of estimation among OLS the pooled model, Fixed Effects (FE), and Random Effects (RE), the Chow and Hausman tests using Eviews 7 (For more details about panel data technique and the related tests, see Baltagi, 2008, Hsiao, 2005 and Gujarati, 2004) is applied. Tables 2 and 3 present Chow and Hausman tests for the used model respectively. The Chow test is a test for choosing between simple pooled OLS regression and panel data analysing. The results show that panel data analysis is the suitable model.
Also, to decide between fixed or random effects, the Hausman test can be run where the null hypothesis is that the preferred model is random effects vs. the alternative fixed effects (see Green, 2008). Based on information in Table 3, the suitable approach is random effects. So the regression model through panel data analysis with random effect procedure is performed.
Table 2: Chow test results
Model
Chow test statistic P-VALUE Cross-section
F
Cross-section Chi-square
Cross-section F
Cross-section Chi-square Main
model 5.4689 553.4464 0000 0.0000
Table 3: Hausman test result
Model Hausman statistic P-VALUE
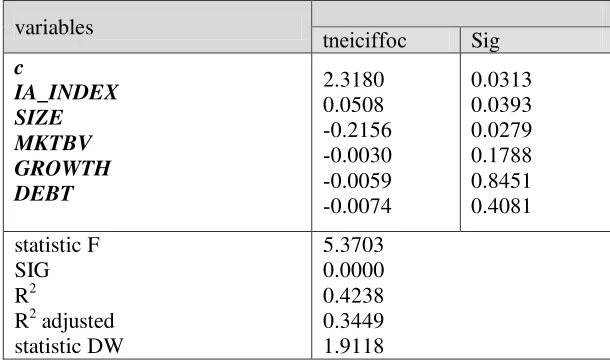
The results of running the main regression model of research after considering the suitable procedures are presented in Table 4. With respect to the table 4 results, the coefficient of IA-index is positive and statistically significant with the expected sign. This means that there is a significant relationship between information asymmetry and EM and that information asymmetry has a significant effect on the magnitude of EM practiced by managers of TSE listed companies. In addition SIZE has a negative and significant effect on EM. This result implies that smaller firms manage their earnings more than others. As it is shown in table 4 there is no statistically significant relationship between other used control variables and EM magnitude. The F statistic indicates that all the coefficients of model are different than zero and the model is statistically significant. The R-squared shows that 34% of variance of dependent variable explained by variation in the independent variables.
Table 4: hypothesis testing results
trade, stock price variation, P/E ratio, numbers of trading days and firm age) for measuring information asymmetry which are suitable and applicable with respect to the socio-economic environment of the TSE. The empirical results show that the information asymmetry index (IA-index) which is a composition of the selected information asymmetry proxies has a positive and statistically significant effect on the extent of EM. In particular, the results suggest that firms for which investors have more information are less likely to manipulate accruals for managing their earnings. This is a direct test of Dye (1988) and Trueman and Titman (1988), as well as Schipper (1989) suggesting that the presence of information asymmetry is a necessary precondition for EM. This study also following the works of Richardson (2000) in the USA and Cheng (2006) in Taiwan. The study results are consistent with the theoretical and empirical literature that is discussed above.
There are several reasons to expect that information asymmetry affects managers’ EM decisions. First, more information available about the firm may help investors distinguish the managed component of reported earnings from the pre-managed numbers, and therefore may make EM more transparent. In such a situation potential benefits of EM will diminish and with respect to the expected costs of EM (especially opportunistic EM) there will be no rational reason for managers to engaging in EM. On the contrary, when information asymmetry is high, investors may not have the necessary information to undo the managed earnings. This situation may be evidence of shareholders without sufficient resources, incentives, or access to relevant information to monitor managers’ actions, which may give rise to the practice of EM. In this way, firms may smooth or otherwise manage earnings informatively when information asymmetry is high in order to signal the expected level of a firm’s permanent earnings. Second, the market may rely less on reported earnings when investors already have a lot of information about the firm, which in turn reduces the potential benefit of EM, and therefore mitigates EM incentives. Third, more information about the firm may facilitate better corporate governance mechanisms. For example, the board of directors may be more likely to step in if they have more information that reflects the adverse consequences of managers’ costly EM. Finally, the information uncertainty associated with firms with low information availability may serve as an additional incentive for managers to manipulate earnings because information uncertainty may exacerbate investors’ overconfidence and it is associated with greater potential benefit for managers or their companies like as greater equity pricing (Jiang, Lee & Zhang, 2005; Zhang, 2006).
REFERENCES
Arya, A., Glover, J. and Sunder, S. (2003). Are unmanaged earnings always better for shareholders? Accounting Horizons (Supplement) 17: 111-116. Bartov, E. and Bodnar, G. M. (1996). Alternative accounting methods,
information asymmetry and liquidity: theory and evidence. The Accounting Review 71: 397-418.
Bhagat, S., Marr, M. and Thompson, G. (1985). The rule 415 experiment: equity markets. Journal of Finance 40: 1385-1401.
Blackwell, D., Marr, M. and Spivey, M. (1990). Shelf registration and the reduced due diligence argument: implications of the underwriter certification and the implicit insurance hypotheses. Journal of Financial and Quantitative Analysis 25: 245-259.
Bushee, B. (1998). The influence of institutional investors on myopic R&D investment behaviour. The Accounting Review 73(3): 305-333.
Chaney, S. K. and Lewis, C. M. (1995). Earnings management and firm valuation under asymmetric information. Journal of corporate finance: Contraction, Governance and Organization 1: 319-345.
Cheng, C. H. (2006). Information asymmetry and earnings management in Taiwanese Tech industry. Retrieved at 5 May 2013 from:
http://www.knjc.edu.tw/admin/aa/publish/pic-1/book/8/5%E9%84%AD%E5%AE%B6%E8%88%88.pdf
Chung, K. H. and Charoenwong, C. (1991). Investment options, assets in place, and the risk of stocks, Financial Management 20, 21-33.
Collins, D. and DeAngelo, L. (1990). Accounting information and corporate governance: market and analyst reactions to earnings of firms engaged in proxy contests. Journal of Accounting and Economics 13: 213-247. Defond, M. and Jiambalvo, J. (1994). Debt covenant violation and manipulation
of accruals. Journal of Accounting and Economics 17: 145-176.
Diamond, D. W. and Verrecchia, R.E. (1991). Disclosure, liquidity, and the cost of capital. The Journal of Finance 46: 1325-1360.
Drobetz, W., Matthias, C. G. and Hirschvogl, S. (2009). Information asymmetry and the value of cash. Journal of Banking and Finance 34: 2168-2184. Dye, R. (1988). Earnings management in an overlapping generation’s model.
Journal of Accounting Research 26: 195-235.
Ewert, R. and Wagenhofer, A. (2005). Economic effects of tightening accounting standards to restrict earnings management. The Accounting Review 80 [4]: 1101-1124.
Ghosh, D. and Olsen, L. (2009). Environmental uncertainty and managers' use of discretionary accruals. Accounting, Organizations and Society: 34 (2), 188-205.
Harris, L. E. (1994). Minimum price variations, discrete bid-ask spreads, and quotation sizes.Review of Financial Studies 7 (1): 149-178.
Holthausen, R. W. (1990). Accounting method choice: opportunistic behaviour, efficient contracting, and information perspectives. Journal of Accounting and Economics 12: 207-218.
Holthausen, R. W., and Leftwich, R. (1983). The economic consequences of accounting choice. Journal of Accounting and Economics 5: 77-117. Holthausen, R., Larcker, D., and Sloan, R. (1995). Annual bonus schemes and
the manipulation of earnings. Journal of Accounting and Economics 19(1): 29-74.
Hunt, A., Moyer, S. E. and Shevlin, T. (1995). Earnings volatility, earnings management, and equity value. Working paper, university of Washington, Seattle, WA.
Javid, A.Y. and Ahmad, E. (2009). Testing Multifactor Capital Asset Pricing Model in Case of Pakistani Market. International Research Journal of Finance and Economics 25: 115 – 138.
Jiang, G., Lee, C. and Zhang, G. (2005). Information uncertainty and expected returns. Review of Accounting Studies 10 (2-3): 185-221.
Jordan, C. E., Clark, S. J, and Pate, G. R. (2008). Earnings Manipulation to Achieve Cognitive Reference Points in Income. Academy of Accounting and Financial Studies Journal 12 (3): 97-112.
Kang, P., Palman, D. and Sudit, E. (2009). Firms’ information environment and earnings management. Working paper, Rutgers University. Retrieved at 2012 from http://aaahq.org/MARegion/2010/2010MA_Abstracts/10-078-PAPER.pdf
Keshavarz haddad, G. and Rezaei, M. (2011). Herding behaviour among institutional investors in Tehran stock exchange. Iranian economic research 15 (45): 103-137.
Kothari, S., Leone, A. and Wasley, C. (2005). Performance matched discretionary accrual measures. Journal of Accounting & Economics 39(1): 163–197.
Krasker, W. S. (1986). Stock price movements in response to stock issues under asymmetric information. Journal of finance 41: 93-105.
Leary, M. T. and Roberts, M. R. (2008). The Pecking Order, Debt Capacity, and Information Asymmetry, working paper, Cornell University.
Louis, H., and Robinson, D. (2005). Do managers credibly use accruals to signal private information? Evidence from the pricing of discretionary accruals around stock splits. Journal of Accounting and Economics 39, 361-380.
Ozkan, A. and Ozkan, N. (2004). Corporate cash holdings: an empirical investigation of UK companies. Journal of Banking & Finance 28: 2103-2134.
Richardson, V. (2000). Information asymmetry and earnings management: some evidence, Review of Quantitative Finance and Accounting 15: 325-347.
Ronen, J. and Yaari, V. L. (2008). Earnings management: emerging insights in theory, practice, and research. Springer.
Roychowdhury, S. (2006). Earnings management through real activities manipulation. Journal of Accounting and Economics 42 [3]: 335-370. Saeedi, A. and Farhanian, M. J. (2012). To study the investor herd behaviour in
Tehran stock exchange. Quarterly journal of securities exchange 16. Sun, L. and Rath, S. (2008). Fundamental determinance, opportunistic behavior
and signaling mechanism: an integration of earnings management perspectives. International Review of Business Research Papers 4 (4): 406-420.
Schipper, K. (1989). Commentary on Earnings management. Accounting Horizons 3: 91-102.
Smith, C.W. and Watts, R. L. (1992). The Investment Opportunity Set and Corporate Financing, Dividend, and Compensation Policies. Journal of Financial Economics 32 (December): 263- 292.
Subramanyam, K. R. (1996). The pricing of discretionary accruals. Journal of Accounting and Economics 22: 149-281.
Sweeney, A. P. (1994). Debt-covenant violations and managers’ accounting response. Journal of Accounting and Economics 17: 281-308.
Trueman, B. and Titman, S. (1988). An explanation for accounting income smoothing. Journal of Accounting Research 26 (Supplement), 127–139. Vermaelen, T. (1981). Common stock repurchases and market signaling: An
empirical study. Journal of Financial Economics 9: 139-183.
Warfield, T. D., Wild, J. J and Wild, K. L. (1995). Managerial ownership, accounting choices, and informativeness of earnings. Journal of Accounting and Economics 20: 61-91.
Watts, R and Zimmerman, J. L. (1978). Towards a positive theory of the determination of accounting standards. The Accounting Review 53: 112-134.
Xu, R. Z., Taylor, G. K., & Dugan, M. T. (2007). Review of real earnings management literature. Journal of Accounting Literature, 26, 195-228.
Retrieved from
http://search.proquest.com/docview/216307021?accountid=27890