IOP Conference Series: Earth and Environmental Science
PAPER • OPEN ACCESS
Inventory and projection of greenhouse gases emissions for Sumatera
Utara Province
To cite this article: H Ambarita et al 2018 IOP Conf. Ser.: Earth Environ. Sci.126 012114
View the article online for updates and enhancements.
Inventory and projection of greenhouse gases emissions for
Sumatera Utara Province
H Ambarita1, Soeharwinto2, N Ginting3, M Basyuni5 and Z Zen4
1
Sustainable Energy and Biomaterial Centre of Excellent, Universitas Sumatera Utara, Jl. Almamater Kampus USU, Medan 20155, Indonesia
2
Electrical Engineering, Faculty of Engineering, Universitas Sumatera Utara, Jl. Almamater Kampus USU, Medan 20155, Indonesia
3
Faculty of Agriculture, Universitas Sumatera Utara, Kampus USU, Medan 20155, Indonesia
4
Faculty of Forestry, Universitas Sumatera Utara, Kampus USU, Medan 20155, Indonesia
5
Environmental Economics, Harapan-School of Economic (STIE Harapan) Medan, Jl. Iman Bonjol No 35, Medan, Indonesia
E-mail: himsar@usu.ac.id
Abstract. Greenhouse Gases (GHGs) emissions which result in global warming is a serious problem for the human being. Total globally anthropogenic GHG emissions were the highest in the history of the year 2000 to 2010 and reached 49 (4.5) Giga ton CO2eq per year in 2010. Many governments addressed their commitment to reducing GHG emission. The Government of Indonesia (GoI) has released a target in reducing its GHG emissions by 26% from level business as usual by 2020, and this target can be increased up to 41% by international aid. In this study, the GHG emissions for Sumatera Utara province are assessed and divided into six sectors. They are Agricultural, Land Use and Forestry, Energy, Transportation, Industrial, and Waste sectors. The results show that total GHG emissions for Sumatera Utara province in the baseline year 2010 is 191.4 million tons CO2eq. The business-as-usual projection of the GHG emission in 2020 is 354.5 million tons CO2eq. Mitigation actions will reduce GHG emissions up to 30.5% from business as usual emission in 2020.
1. Introduction
Greenhouse Gases (GHGs) emission is a big problem for the world in the next decades. To avoid the catastrophe, many countries have committed to reducing their GHGs emission. The Government of Indonesia (GoI) has released its target on reducing GHG emissions by 26% from level business as usual (BAU) by 2020, and it can be increased up to 41% by international aid [1]. Recently, in 2017 the GoI revised the target emissions reduction to 29% from BAU scenario by 2030 [2]. The source of emissions can be divided into five sectors; they are energy, waste, industrial and process, agricultural, and forestry. The solution to this target of emission reduction is the implementation of sustainable energy development. Due to high activities and dense population, cities are significant sources of GHG gas emissions. Thus, GHG emissions must be taken into account in the development of a friendly city.
According to United Nations, cities contribute to 70% of global GHG emissions. Study on the GHG emissions; inventory, projection and mitigation actions are extremely needed for developing a friendly city. Song et al. [3] reported a study on discovering the energy, economic and environmental potentials of urban wastes. In the study, an input-output model for a metropolis case is used. The Friendly City 4 ‘From Research to Implementation For Better Sustainability’ IOP Publishing
IOP Conf. Series: Earth and Environmental Science126(2018) 012114 doi:10.1088/1755-1315/126/1/012114
results show that in a total of 17.97 million tons CO2eq accumulative GHG emission could be mitigated. The proposed methods and the quantified energy, economic and environmental potentials of urban wastes are expected to provide local decision-makers with options for sounder waste management. Liu et al. [4] reported a comprehensive development of industrial symbiosis for the response of GHGs emission mitigation; Challenges and opportunities in China. Sanz-Cobena et al. [5] reviewed strategies for GHG emissions mitigation in Mediterranean agriculture. In the study, the potencies of emission reductions in every management agro-systems were discussed, and some recommendations were proposed. Strand [6] discussed an economic point of view of GHG mitigation actions. He proposed a mitigation incentive with climate finance and treaty options. Wei et al. [7] reported an analysis of climate change and economy in Baja California. Assessment of macroeconomic impacts of State's Climate Action Plan has been analyzed. Ward et al. [8] reported a study on the estimation an upper-bound CO2 emission mitigation that could theoretically be achieved by improved access to efficient technologies in industrial sectors. A linear optimization framework that facilities the exchange of sectoral production technologies based on the World Input-Output Database (WIOD) has been developed. The results showed that if best practice technologies were made available globally, CO2 emission could theoretically be reduced by more than ten gigatons. The largest CO2 emission reduction potentials are found for a small set of developing countries. Recently, Kuramochi et al. [9] reported an assessment of national GHG mitigation targets for 2030 through meta-analysis of bottom-up energy and emission scenario using Japan as a case study.
The above literature shows that study on estimation of GHG emissions and mitigation actions have come under scrutiny in recent years. The results have been promoted to the policymakers to develop low-carbon development. Thus, it is needed to explore the potency of GHG emission in a lower level government of Indonesia. The objectives of this study are to provide emission characteristics and potential emission reductions in the Sumatera Utara province. The inventory will be carried out, and BAU emission will be developed. The results are expected to supply the necessary information in developing a friendly city regarding sustainable environments.
2. Method
In this paper, three different works are carried out. They are the inventory of the emission in the baseline year, the projection of the emission until 2020 at the time of the Indonesian target, and estimation of emission reduction if mitigation actions were implemented. Indonesia is a big country with a population about 250 million people and consists of 33 provinces. In this work, Sumatera Utara province is selected as a case study. As a note, Indonesian emission reduction target was released in the year 2009. In the target, it was mentioned that the reduction of 26% and 41% are counted from Business-as-Usual (BAU) emission. This fact suggests that BAU emission or emission projection without any intervention must be first developed. To develop the BAU emission, the baseline emission must be calculated. The baseline emission is named as inventory. Since the target was released in 2009, the selected baseline year is 2010. BAU emission will be estimated using the economy and population prediction growth until 2020. After the BAU is developed mitigation actions are proposed. Implementation of mitigation actions will result in emission reductions. In other words, the methods are the inventory of the emissions in the base year 2010. The second is developing BAU emissions in the period 2011 to 2020. The third is proposing mitigation actions and estimate the emission reduction.
GHG emission estimation is made based on the IPCC method released by UNFCC [10]. Based on the IPCC guideline GHG emission consists of CO2, CH4, N2O, Hydrofluorocarbon, Perfluorocarbons, Sulfur-hexafluoride, and nitrogen trifluoride. To make convenient discussion, all of the emissions will be converted into a CO2 equivalent (CO2eq). All of the activities that emit those GHGs are categorized emission sources. According to IPCC, the emission sources are divided into four sectors; they are energy sector, industrial process and product use, agriculture, forestry, and other land use, waste, and other emissions. Based on the characteristics of Sumatera Utara province, the source of emission is divided into agriculture, forestry, energy, transportation, and waste sectors. In the IPCC method, there
Friendly City 4 ‘From Research to Implementation For Better Sustainability’ IOP Publishing
IOP Conf. Series: Earth and Environmental Science126(2018) 012114 doi:10.1088/1755-1315/126/1/012114
are three tiers of estimation can be used. Since the availability of the data is very limited, the simplest one Tier 1 is used.
3. Results and Discussions
As mentioned in the previous section, three different works are carried out. They are inventory, BAU projection, and emission reductions. The results of all works will be presented and discussed in three sections as follows.
3.1. GHG Inventory
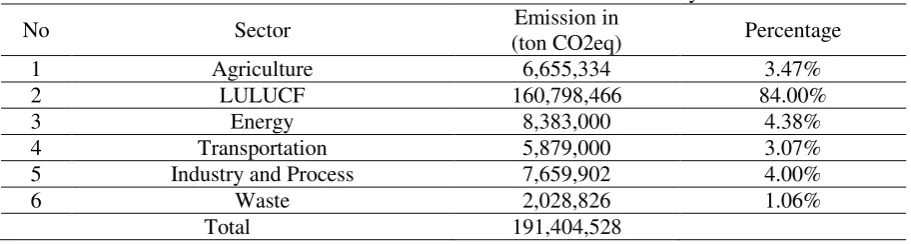
The inventory is carried out in the year 2010 as a baseline year. Sumatera Utara province is a place for about 1500 industries (manufacture, food and beverage, and livestock). This province results in 150,000 ton of waste per day. Also, there 38 million of engines used in cars, motorbike, etc. All of the activities in 2010 results in 191.4 million tons CO2eq emission. The emission from all sectors is shown in Table 1. The table shows that the biggest emission source in this province is Forestry and Land Use, hereafter named as LULUCF sector. It results in 160.79 million tons CO2eq, or it is 84.00% of the total emission. The total GHG emissions from agriculture sector are 6.6 million tons CO2eq or 3.47% from the total emission. The industrial and process sector contributes 7.9 million tons CO2eq or 4.00% of the total. This emission comes from all of the industries in small and big scale industries. As a note, this is only from the process in the industry. On the other hand, the fuel to power the industry is not taken into account. It will be calculated in the energy sector. The lowest sector that produces emission in this province is the waste sector. It produces 2.01 million tons CO2eq or 1.06% from the total emission.
Table 1. GHG emissions in Sumatera Utara from inventory 2010.
No Sector Emission in transportation. But in this work, it is divided into energy sector to produce power and transportation sector (energy used for transportation). In the energy sector, total emission in this province is 8.3 million tons CO2eq or 4.39%. Even though the emission is not too big, however, the emission from energy sector has a strong impact on economic growth. The sources of emission in the energy sector include for residential, industry, commercial, and electricity generation. The total emissions from the transportation sector are 5.3 million tons CO2eq or 2.77%. This includes all emission for powering trucks that used in the industry and agricultural sectors. The smallest emission resulted by waste sector. It is only 2 million tons CO2eq or only 1.06% from the total emission. The interesting phenomenon of this inventory is the LULUCF sector. This is because pat land in this province is converting into Palm Oil plantation. This results in significant GHG emissions.
In the agriculture sector, the source of emissions comes from 135 Palm Oil Mill (94.9%), followed by fertilizer (3.39%), and livestock. In the LULUCF sector, the net of emission from land is calculated using REDD-ABACUS software based on the historical data and land use planning of the Sumatera Utara province. The result shows that intensity of net of emission from LULUCF in Sumatera Utara is 22.07 tons CO2eq/ha/year. This intensity equal to 160.79 million tons CO2eq. In the energy sector, GHG emissions mainly resulted by electricity production (74.5%), captive power (25.56%), and residential
Friendly City 4 ‘From Research to Implementation For Better Sustainability’ IOP Publishing
energy (0.29). The emissions in the transportation sector come from land transportation, water transportation, and air transportation.
3.2. BAU emission projection
Based on the inventory shown in the previous section, the BAU emission projection will be made for each sector. The growth will be examined based on several assumptions. They are population and urbanization trend released by national planning bureau, GDP growth, energy prices, and the area of this province. The result shows that the projection of GHG emission of the Sumatera Utara province in 2020 is 354.5 million tons CO2eq. This value suggests that the growth of emission in this province in 2020 is 85% in comparison with GHG emission in the year 2010. In other words, the emission growth in a year is 8.5%. As a note, based on the energy consumption and electricity demand the growth in Sumatera Utara province is about 7.5% yearly. Thus, it can be said that the emission growth is higher than energy consumption growth. This is because the main emission in the Sumatera Utara province is mainly because of the emission from LULUCF. The BAU projection of GHG emission in 2020 is shown in Table 2. The table shows that the yearly growth of agriculture and LULUCF sectors are 2.7% and 8.2%, respectively. As a note, the average growth of the emission is 8.52%. The agriculture sector shows a lower growth in comparison with average growth. This is because the growth of agriculture area in Sumatera Utara is almost fixed. The LULUCF still shows significant growth. This is because of the change of pet land into palm oil plantation. The energy sector shows the highest emission growth and followed by waste sector. In the energy sector, the high growth is caused by the highest demand in energy. Also, in the waste sector, the high growth is caused by the high population and economy growth.
Figure 1. BAU GHG emissions from transportation sector.
In this study, the BAU emission is developed for each sector. For inconvenient only BAU from transportation sector is discussed here. Figure 1 shows the projection of GHG emissions from transportation sector during 2010 until 2020. The emission is divided into four sources; they are the passenger car, motorbike, bus, and truck. The used assumptions on developing BAU in the transportation sector are as follows. Regional Product Domestic (RPD) is IDR 118,460 billion and the population is 12,982,204 people. The growth of RDP and population are 6.35% and 1.22%, respectively. The elasticity if the passenger car, motorbike, bus, and truck to the RDP are 1.28 per capita, 1.27 per capita, 1.3 per capita, and 1.28 per capita. It can be seen clearly that the highest emission resulted by motorbike. In 2010, it was up to 39.18% of the total emissions from the
Friendly City 4 ‘From Research to Implementation For Better Sustainability’ IOP Publishing
IOP Conf. Series: Earth and Environmental Science126(2018) 012114 doi:10.1088/1755-1315/126/1/012114
transportation sector. Motorbike followed by passenger car, bus, and truck with a percentage of 22.82%, 20.82%, and 17.18%, respectively.
The emission BAU from the transportation sector is Sumatera Utara increase from 5.29 million tons CO2eq in 2010 up to 10.861 million tons CO2eq in 2020. The highest growth is shown by motorbike; it is 152% in comparison with emission in the baseline year 2010. It is followed by passenger car, bus, and truck with the growth of 94.5%, 64.7%, 60.48%, respectively. In total, the growth of emission in the year 2020 in the transportation sector is 105% in comparison with emission in the year 2010. As a note, according to ICSSR, the national BAU emission from transportation in Indonesia is growth to 68% in 2020 in comparison with emission in the year 2010. These values suggest that the growth of emission of the transportation sector in Sumatera Utara province is higher than in national sector. The similar analyses have been made for all sectors and the result can be seen in Table 2.
3.3. Emission reduction
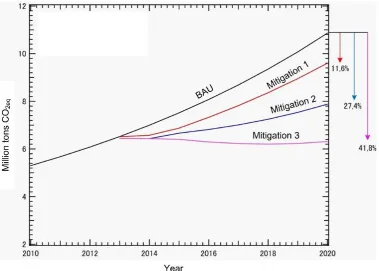
As mentioned in the introduction section, the objectives of this study are to provide emission characteristics and potential emission reductions in the Sumatera Utara province. The emission characteristics have been reported in the previous section. Here the potential mitigation action and estimated emission reduction will be estimated. As a note, the activity of reducing GHG emissions is named as mitigation action. Mitigation actions are specific for each sector. In other words, there are many mitigation actions have been proposed. In this study, only mitigation actions of transportation sector are discussed. Figure 2 shows the BAU emission and emission reduction in the transportation sector.
Figure 2 Emission reductions of transportation sector by implementing mitigation actions
In the transportation sector, the mitigation actions are divided into three mitigation groups, named as Mitigation 1, Mitigation 2, and Mitigation 3. The mitigation I consist of all actions that have been regulated nationally from the central government. They are development ITS (Intelligent Transport System), development regulating transportation impact (Andalin), parking management system,
Friendly City 4 ‘From Research to Implementation For Better Sustainability’ IOP Publishing
congesting charging and road pricing, implementation Bus Rapid Transit (BRT), renew public transportation, implementation converter kit, smart driving, and development non-motorized transport. The target that can be reached if these actions are implemented has been analyzed. The results show that emission reduction from ITS, Andalin, and parking management system are 833.88 kilotons CO2eq, 240 kilotons CO2eq, and 179 kilotons CO2eq, respectively. Since the type of cities in Sumatera Utara province is not suitable for road pricing system, the emission reduction is not calculated. The emission reductions from BRT, renew public transportation, implementation converter kit, smart driving, and development non-motorized transportation are 85.56 kilotons CO2eq, 30 kilotons CO2eq, 4.5 kilotons CO2eq, 12.8 kilotons CO2eq, and 45 kilotons CO2eq, respectively. The total of emission reduction can be resulted by implementing Mitigation I is 1.188 milliontons CO2eq.
In the transportation sector, there is two additional group of mitigation II and mitigation III. The actions in Mitigation II includes redevelopment train transportation (Medan-Binjai-Deliserdang), train and Bus line between Kualanamo airport – Medan, Car Free days, Implementation converter kit in public and government belong passenger cars. These mitigation actions are estimated to reduce emissions of 1.77 million tons CO2eq. Thus, the total emission reduction if Mitigation I and Mitigation II are implemented is up to 27.4% from BAU in 2020. The last group of mitigation action includes blending the fuel with biofuels such as biodiesel and bioethanol. The additional emission reduction can be reached 1.55 million tons CO2eq. Thus, the total emission reduction is 41.8% from BAU. This value suggests that there is a big potency in transportation sector on reducing GHG emissions. In comparison with a total potency of reduction, the emission reduction from transportation is only 1.3% from total emission as shown in Table 2.
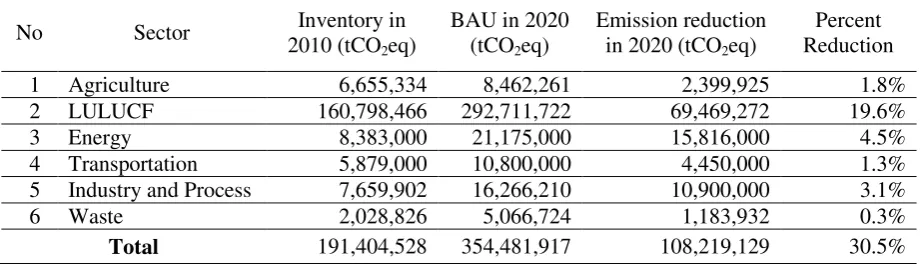
Table 2. GHG Inventory, BAU, and mitigation in Sumatera Utara Province.
No Sector Inventory in
2 LULUCF 160,798,466 292,711,722 69,469,272 19.6%
3 Energy 8,383,000 21,175,000 15,816,000 4.5%
4 Transportation 5,879,000 10,800,000 4,450,000 1.3%
5 Industry and Process 7,659,902 16,266,210 10,900,000 3.1%
6 Waste 2,028,826 5,066,724 1,183,932 0.3%
Total 191,404,528 354,481,917 108,219,129 30.5%
Table 2 shows BAU emission and emission reduction after mitigations were implemented in 2020 and percent of reduction. It can be seen that in Agriculture sector, the BAU emission in 2020 is 8.5 million tons CO2eq. By implementing mitigation actions, the emission reduction in 2020 is 2.3 million tons CO2eq or 1.8% from total reduction. As expected, the biggest emission reduction is from LULUCF; it is 69.5 million tons CO2eq. Even though in the percentage of total reduction it is only 19.6%, the emission from LULUCF is lower than its emission portion in the baseline year. As a note, the LULUCF emission in the baseline year 2010 is 84.00%. In the energy sector, the BAU emission and emission after mitigation are 21.17 million tons CO2eq and 15.81 million tons CO2eq, respectively. Here, the emission reduction is 5.36 million tons CO2eq or 4.5% from BAU emission. The BAU emission and emission after mitigation in industry and process sector are 16.27 million tons CO2eq and 10.9 million tons CO2eq, respectively. The emission reduction is 5.7 million tons CO2eq or 3.1% from BAU emission. The lowest reduction is shown by waste sector; it is 3.8 million tons CO2eq or 0.3% from BAU emission. In total, the emission reduction can be reached from all mitigation actions in 2020 is 108.22 million tons CO2eq. This reduction is equivalent to 30.5% reduction. As a note, the targets of emission reduction of the Indonesian government in 2020 are 26% and 41% by own budget Friendly City 4 ‘From Research to Implementation For Better Sustainability’ IOP Publishing
IOP Conf. Series: Earth and Environmental Science126(2018) 012114 doi:10.1088/1755-1315/126/1/012114
and with international support. This value suggests that all of the mitigation actions in the Sumatera Utara is between these targets.
4. Conclusions
In order to meet the Indonesian target on GHG emission reductions 26% by own budget and up to 41% by using international support by year 2020, local government in province level have been asked to develop mitigation action on reducing GHG emissions. In this work, Sumatera Utara province has been chosen as a case study. The inventory for baseline year 2010, BAU emission up to 2020 and emission reduction up to 2020 have been estimated. The results show that the emission inventory in baseline year 2010 is 191.4 million tons CO2eq. The business as usual projection of the GHGs emission in 2020 is 354.5. In total, the emission reduction can be reached from all mitigation actions in 2020 is 108.22 million tons CO2eq. This reduction is equivalent to 30.5% reduction. This value is within the range of emission targets.
Acknowledgments
The authors gratefully acknowledge that the present work is supported by Japan International Cooperation Agency (JICA) Indonesia.
References
[1] Gov. of Indonesia Presidential Decree No No 61 Year 2011, National Action Plan For Reducing Greenhouse Gas Emissions
[2] Gov. of Indonesia, 2016, First Nationally Determined Contribution Republic of Indonesia
[3] Song J, Yang W, Li Z, Higano Y and Wang X 2016 Energy Conversion and Management 114
168-79
[4] Liu Z, Adams M, Cote R P et al. 2017 Energy Policy102 88-95
[5] Saz-Cobena A et al 2017 Agriculture, Ecosystem and Environment238 5-24 [6] Strand J 2016 Energy Economics57 166-74
[7] Wei A, Brugues A, Rose A, de la Parra C A, Carcia R and Martinez F, Ecological Economics131 373-88
[8] Ward H, Radebach A, Vierhaus I, Fugunschuh A and Steckel J C 2017 Resource and Energy Economics49 201-17
[9] Kuramochi T, Wakiyama T and Kuriyama A 2017 Renewable and Sustainable Energy Reviews
77 924-44
[10] IPCC 2006 Guidelines for National Greenhouse Gas Inventories
Friendly City 4 ‘From Research to Implementation For Better Sustainability’ IOP Publishing