Original scientifi c paper UDC 331.101.262:330.35/(497.5)
Human Resources development and research
capacity and their impact on economic growth
*1
Nada Karaman Aksentijević
2, Zoran Ježić
3Abstract
The goal of this research is to provide an analysis of the development of the Republic of Croatia and 110 selected countries in terms of human resource development index components and the components of the Technological Achievement Index. Developmental lags of the Republic of Croatia were determined by the bird’s eye view method in terms of the observed developmental indicators, and suggestions were provided for their development. The impact of the analysed indicators and their components on the economic growth of the Republic of Croatia and the selected countries was established by regression analysis. The paper provides possible developmental guidelines for certain components. The results of the research proved that the Human Resources Development Index is insuffi cient in the analysis of economic development, as well as the existence of the expected correlation between trained human resources, which enable technological progress, and economic growth of a country. Taking into consideration the correlation between the growth of the Human Resources Development Index, Research Capacity Index, Technology and Innovation Index, and the Ability to Absorb Knowledge and Technology Index and economic growth, which was determined by the application of a model, Croatia has to make additional investments in the growth of human capital and labour productivity in order to reduce developmental lags.
Key words: human resources, research capacity, economic growth, Republic of Croatia
JEL classifi cation: O10, O15, O33, I0
* Received: 05-10-2009; accepted: 14-12-2009
1 The presented results are part of the scientifi c project (Human Resources and Economic
Development of Croatia, No. 081-0811403-1409) supported by the Ministry of Science, Education and Sports of the Republic of Croatia.
2 Full Professor, University of Rijeka, Faculty of Economics, Ivana Filipovića 4, 51000 Rijeka, Croatia. Scientifi c affi liation: theory and policy of economic development, regional development, economic policy, industrial policy, human resources development. Phone: + 385 51 355 111. Fax: + 385 51 212 268. E-mail: nkaraman@efri.hr.
3 MSc, Novice Researcher, University of Rijeka, Faculty of Economics, Ivana Filipovića 4, 51000, Rijeka, Croatia. Scientifi c affi liation: human resources development, education and economic development. Phone: +385 51 355 111. Fax: +385 51 212 268. E-mail: zjezic@efri.hr.
1. Introduction
Land, labour, capital, and later organisation, had been considered basic developmental
resources until the emergence of the third scientifi c-technological revolution. In
knowledge-based economies, knowledge and human resources have become the key factors of development. Development of science leads to full automatisation of physical labour, growing cybernatisation of intellectual tasks and management processes, and to the rise of human domination over energy, space and time. New
scientifi c disciplines have emerged, investments in scientifi c research have become
more extensive, and the time span between scientifi c discovery and its application
has been decreasing.
Nowadays, we can witness growing investments into research, development of
research and educational capacity, accumulation of scientifi c and fi nancial resources
through (transnational) megaprojects, and connecting science and economy in order to accelerate the commercialisation of research results. The consequence of these changes is increased effectiveness of economies, stimulation of as interdisciplinary and multidisciplinary approach to research, promotion of creativity and innovativeness and growth of export rates of products which contain a great share of knowledge and information. In the world trade structure at the end of the twentieth century, knowledge-based high technologies were on the rise. The amount of medium-and-high technology products almost doubled in this period, so that in 1996 it comprised almost 55% of total world barter. At the same time, in the world trade structure, there was a decrease in the share of resource-based products and other primary products by 21 percentage points, a decrease in the low-technology-based products by three percentage points, and an increase in the share of products based on medium-and high-technology by 10, i.e. 11 percentage points. This trend has been accelerating in the last decade. (http://www.hrvatska21.hr/znanost%2030_6_2003.pdf 1.3.2009.) According to the United Nations indicators, export of medical and pharmaceutical products rose the most (by 13.1%) in the world trade structure from 1992 to 2003, as well as of organic and non-organic compounds (11.1%), precise medical and optical instruments (10.0%), and telecommunication equipment (9.0%) and microprocessors (8.0%). At the same time, there was a great decrease in products based on primary resources such as wool, wood and stone. (UNCTAD Handbook of Statistics, 2005:150-154)
The current know-how quickly becomes outdated, and application of new knowledge demands permanent education of human resources. Human resources have to be constantly trained in order to be able to develop, apply and use new technologies. The article supports the hypothesis that trained human resources provide for fuel technological progress, and that development, application and expansion of new technological achievements have a direct impact on economic growth of a country.
2. Theoretical-methodological starting points
On the national level, human resources can be defi ned as the total psycho-physical
energy at the disposal of a society, which can be used by the society to achieve its
developmental goals. At pre-working age, the society has a decisive infl uence on the
formation and development of human resources, primarily through education and health care, but also through other activities, such as social care for children, sports and cultural activities.
The value of human resources cannot be measured directly; their development level is measured indirectly. Literature offers various criteria for the assessment of human resources development in a particular area. It is considered that the greatest breakthrough was achieved by Harbison and Myers in their book "Education, Workforce and Economic Growth" (Harbison, F., Myers, Ch., 1964), in which they elaborated on quantitative indicators for indirect measuring of human resources development, after they had concluded that economists disregarded research of the
human factor and its signifi cance and contribution to economic development. This
was caused by their inability to determine the input-output relationship which is indisputable in physical capital, because this capital is directly measurable in terms of value. By means of seven partial indicators, Harbison and Myers calculated the
complex Human Resources Development Index4.
The OUN recently calculated the Human Development Index (HDI), which, in terms
of its content, represents Human Resources Development Index.5 Namely, the OUN
defi nes the human development concept in a wider sense, as the development of the
people, for the people and by the people (Human Development Report, 1993). However, in regard to the contribution of human resources to economic growth and development on macro level, in all the papers published so far, it has been measured
by the infl uence of the population’s education level on economic growth. In other
words, the subject of calculation is the correlation between the achieved education level and the achieved GDP per capita. For example, this is visible in Harper-Anderson’s works ("Measuring Connection between Workforce Development and Economic Development", Harper-Anderson, 2008), Hayton JC ("Competing in
4 For calculating complex Human Resources Development Index, Harbison and Myers used the fol-lowing indicators: 1. the number of teachers in primary and secondary education per 10,000 inhabit-ants; 2. the number of engineers and scientists per 10,000 inhabitinhabit-ants; 3. the number of doctors and dentists per 10,000 inhabitants; 4. inclusion of children from fi ve to 14 years of age in primary educa-tion; 5. the average enrolment rates in primary and secondary educaeduca-tion; 6. percentage inclusion of the population between fi ve and 14 years of age in secondary education; 7. percentage inclusion of the population between 20 and 24 years of age in college education.
5 The index was constructed at the beginning of the 1990s by Amartya Sen (Nobel Prize winner), Ma-hub ul Hak, Gustav Ranis (Yale University), Meghan Desai (London School of Economics) and has been used since by the OUN. It is published in the annual Human Development Report.
the New Economy: The Effect of Intellectual Capital in High-Technology New Ventures"; Hayton JC, 2005), Jayasuirya ("Measuring and Explaining the Impact of
Productive Effi ciency on Economic Development; Jayasuirya, 2005).
The efforts to explain the difference between inputs and outputs, which has been
marked as a residual in the production function, have become very signifi cant in
contemporary economics of the second half of the twentieth century. More and more economists have assigned the residual to knowledge and education (E. Denison, S. Kuznets, M.Reder, M.S. Višnev, B. Higgins, M. Adiseshiah, S. Lebergot). The
notion that economic growth is infl uenced by both quantitative and qualitative
factors has become very signifi cant. In the classifi cation of the source of growth, E.
Denison claims that output is not only infl uenced by the quantity of work invested
as input, because output can be increased by investing in education and professional training, health care and professional mobility of the employees (Denison, E., 1972). Thus, investments are made in human capital. At the same time, Denison claims that output also depends on the allocation of resources; thereby, on allocation of human resources as well, i.e. on adequate employee assignment to certain work places. In other words, in professional terms, Denison claims that the effects gained by human
capital depend on the effi ciency of human resources management.
In the second half of the 20th century, numerous economists clearly pointed out
the signifi cance of education and education level on national economic growth, as
well as on prosperity of an individual. Harbison and Myers established a pattern which is manifested as the need for multiple growth in terms of human resources development, in order to reach doubled domestic income per capita. In terms of the
four degrees of economic development (the fi rst degree being the lowest, and the
fourth degree the highest), the difference in domestic income per capita between
the fi rst and the second degree countries at the beginning of the 1960s was doubled,
and, at the same time, countries of the second degree of development had seven times more developed human resources. The fourth group, i.e. the most developed
countries, had up to 13 times higher domestic income per capita than the fi rst group,
and as much as 38 times more developed human resources. (Harbison, F., Myers, Ch., 1964).
At the beginning of the 1970s, L. V. Stepanov (Stepanov, L.V., 1972) pointed out that American society, in accordance with the rules of global economic development, creates the situation in which educated people, especially those with quality education, rule over the less-educated.
At the beginning of the 21st century, it has become evident that the population’s
education has a strong impact on developmental inequalities between individual countries, as well as on poverty and income inequalities within individual countries. This was also emphasised in Blitzer’s works "Measuring Knowledge Stocks" (Blitzer, 2005), Drucker Joshua "Assessing the Regional Economic Development of
Universities" (Drucker, J, 2007) and the edition by the World Bank "How Universities Promote Economic Growth" (Shahid, Y. ed., 2007). The richest countries in the world have the most educated population, and the poorest the most uneducated. Undeveloped countries make efforts to eradicate illiteracy, and the most developed countries have between a quarter and a third of a highly-educated population, with a tendency for the number of highly-educated people to increase in the next ten years to over 40%. For example, in 2006, the illiteracy rate in the most undeveloped African countries (Niger, Chad, Mali, Burkina Faso) amounted to 75 to 79%, while the most developed high-income countries almost eradicated illiteracy (World Development Indicators, 2007, Human Development Report 2007/2008). In these countries, 70 to 92% of the population of the relevant age group was included in tertiary education (http://go.worldbank.org/JVXVANWYY0, 29.2.2008.) Central and Eastern European countries (Estonia, Hungary, Lithuania, Slovenia, Poland, the Czech Republic) had an illiteracy rate of 0.2% to 0.7 %, in the same year, and about 60% of the population of the relevant age group was included in tertiary education. The Republic of Croatia had a 1.9% illiterate population (Human Development Report 2007/2008), and in 2006, only 38.7% of the population of the relevant age group was included in tertiary education. (http://go.worldbank.org/JVXVANWYY0, 29.2.2008.).
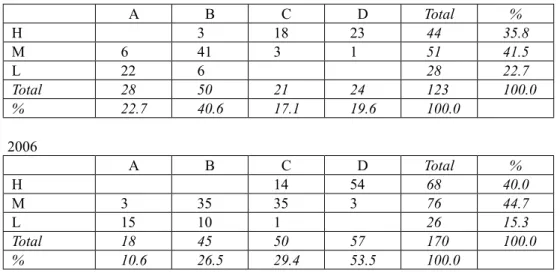
Table 1: Number of countries classifi ed according to the Human Resources
development index in 1988 and 2006
1988 A B C D Total % H 3 18 23 44 35.8 M 6 41 3 1 51 41.5 L 22 6 28 22.7 Total 28 50 21 24 123 100.0 % 22.7 40.6 17.1 19.6 100.0 2006 A B C D Total % H 14 54 68 40.0 M 3 35 35 3 76 44.7 L 15 10 1 26 15.3 Total 18 45 50 57 170 100.0 % 10.6 26.5 29.4 53.5 100.0
Notes: H – high HDI, M – medium HDI, L – low HDI; A – undeveloped countries, B - low middle-income countries, C – high middle-income countries, D – highly developed countries
Source: Authors’ calculation according to Human Development Indicators 1990, 2007/2008 (11.7.2009)
The table shows the undeveloped countries (A – GDP/pc<975 USD), low middle-income countries (B – 976-3,855 USD GDP/pc), high middle-middle-income countries (C – 3,856-11,905 USD GDP/pc) and highly developed countries (D – GDP/pc>11,906
USD) classifi ed according to the criterion of high (H – 0.80-1), medium (M –
0.50-0.80), and low (L – 0.0-0.50) Human Resources Development Index. The comparison indicates that over a period of 18 years, the number of countries with a high Human Resources Development Index increased by 4.2 percentage points, and the number of countries with a medium Human Resources Development Index by 3.2 percentage points. In the observed period of time, the number of countries with a low Human Resources Development Index fell by 7.4 percentage points.
Until 1998, the Republic of Croatia was a medium Human Resources Development
Index country (HDI=0.795), and was ranked 49th according to human resources
development. Since 1999, the Republic of Croatia has been a country of high Human Resources Development Index (HDI1999=0.803; HDI=2000=0.809; HDI2001=0.818; HDI2002=0.830; HDI2003=0.841; HDI2004=0.846; HDI2005=0.850). In 2006, the
Republic of Croatia was in 45th place in the world according to the Human Resources
Development Index. (HDI2006=0.862).
The table data lead to the conclusion that, according to the criterion of income per
capita, the countries which have been classifi ed into the groups of countries with
medium or low income per capita can also have a high Human Resources Development Index. Albania is often mentioned as an example – a low middle-income country with
a high level of human resources development, which was ranked 69th in the world,
according to the Human Resources Development Index (HDI2006=0.807) (Human Development Indicators, 11.7.2009). Countries with equal incomes per capita can be on different levels of human resources development (for example, Egypt and Jordan). The following chart shows the imbalance between human resources development and income level per capita in the selected countries.
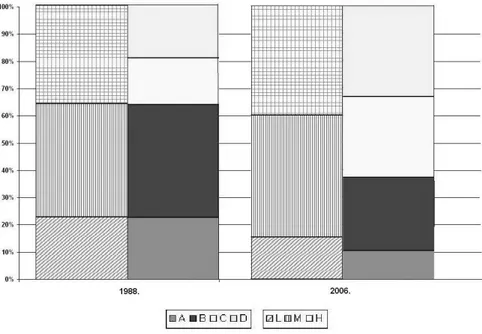
Figure 1: Countries classifi ed according to the Human Resources development index in 1988 and 2006
Note: H – high HDI, M – medium HDI, L – low HDI; A – undeveloped countries, B- low middle--income countries, C – high middlemiddle--income countries, D – highly developed countries Source: Authors’ calculation according to fi gures from Table 1
Based on analysis of the table and the chart, it is evident that human resources
development can be accelerated by a well-defi ned economic policy, increased
availability of education, and by activities undertaken by local communities in order to increase the inclusion of the population in the educational process. However, in order to reach a higher level of economic development, it is necessary to achieve
signifi cant shifts in human resources development, as well as their utilisation.
(Harbison, F., Myers, Ch., 1964.)6
Table fi gures support the thesis that the number of low HDI countries was decreasing,
but the same fi gures also show that the poorest countries lag behind the most in
terms of human resources development, while the greatest growth was not achieved by the richest countries, but by the high-and-low-middle income countries (with
the exception of Rwanda and Bangladesh). However, this growth is insuffi cient to
compensate for the difference in terms of developmental lagging measured by GDP per capita. Namely, in the medium-income group countries, the growth of the Human
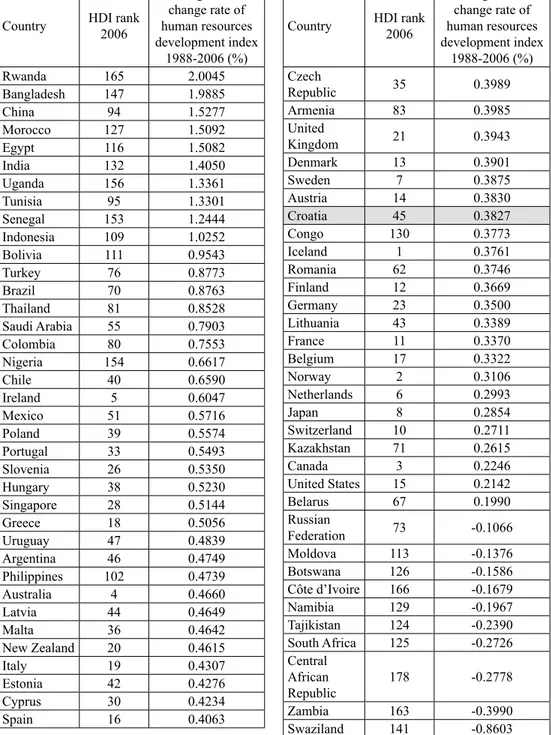
Resources Development Index primarily results from the growth of the Expected Life Span Index (the growth of 4.7% in the period between 1998 and 2006). Countries of low Human Resources Development Index achieved their average increase by 3.6% in the period between 1998 and 2005, which is the result of the improvement of educational structure of the population in these countries. At the same time, the high-income countries increased their high-income per capita by 6.3% in the observed period, which increases the developmental disproportions between the richest and the poorest countries. The income of the poorest countries increases twice as slow. The following table shows the average annual change rate of Human Resources Development Index for some of the selected countries in the period between 1988 and 2006.
The average annual rate of change7 of the Human Resources Development Index in
the period between 1988 and 2006, which amounts to 0.2444%, proves that middle-income countries achieve faster growth of human resources development and that they achieve an average annual index increase of 1%. Croatia had an average an annual index increase of 0.38% in the observed period, and although in 2006 it was ranked
45th in the world in terms of human resources development, numerous neighbouring
countries achieved higher growth: Slovenia (higher growth comparised to Croatia with an annual average of 39.7 %), Hungary (36.6 %), Italy (12.5 %), Estonia (11.7 %), the Czech Republic (4.2 %), and Austria (0.7 %). It is important to point out that the most undeveloped countries and Russia experience average annual decrease of the Human Resources Development Index.
In the last 10 to 15 years, there has been a signifi cant shift in understanding of
the connection between economic growth and development, human resources development, research, innovations and technology. Unambiguous explanations of technological development or human resource development as the basic moving force of economic growth have been abandoned. Some authors believe that HDI
alone is not a suffi cient measure for determining economic growth and that analyses
should include a whole range of other indicators (Bagolin, I.P., 2008)
7 The average annual rate of change shows yearly changes in observed phenomenon. Equation for calculation is: average annual change rate=((n-1)root(yn/y1)-1)*100 where y1 is value of HDI in year 1998, yn value of HDI in 2006 and n number of periods between 1998 and 2006
Table 2: HDI rank and the average annual rate of change of human resources development index for the period between 1988 and 2006
Country HDI rank 2006
Average annual change rate of human resources development index 1988-2006 (%) Rwanda 165 2.0045 Bangladesh 147 1.9885 China 94 1.5277 Morocco 127 1.5092 Egypt 116 1.5082 India 132 1.4050 Uganda 156 1.3361 Tunisia 95 1.3301 Senegal 153 1.2444 Indonesia 109 1.0252 Bolivia 111 0.9543 Turkey 76 0.8773 Brazil 70 0.8763 Thailand 81 0.8528 Saudi Arabia 55 0.7903 Colombia 80 0.7553 Nigeria 154 0.6617 Chile 40 0.6590 Ireland 5 0.6047 Mexico 51 0.5716 Poland 39 0.5574 Portugal 33 0.5493 Slovenia 26 0.5350 Hungary 38 0.5230 Singapore 28 0.5144 Greece 18 0.5056 Uruguay 47 0.4839 Argentina 46 0.4749 Philippines 102 0.4739 Australia 4 0.4660 Latvia 44 0.4649 Malta 36 0.4642 New Zealand 20 0.4615 Italy 19 0.4307 Estonia 42 0.4276 Cyprus 30 0.4234 Spain 16 0.4063
Country HDI rank 2006
Average annual change rate of human resources development index 1988-2006 (%) Czech Republic 35 0.3989 Armenia 83 0.3985 United Kingdom 21 0.3943 Denmark 13 0.3901 Sweden 7 0.3875 Austria 14 0.3830 Croatia 45 0.3827 Congo 130 0.3773 Iceland 1 0.3761 Romania 62 0.3746 Finland 12 0.3669 Germany 23 0.3500 Lithuania 43 0.3389 France 11 0.3370 Belgium 17 0.3322 Norway 2 0.3106 Netherlands 6 0.2993 Japan 8 0.2854 Switzerland 10 0.2711 Kazakhstan 71 0.2615 Canada 3 0.2246 United States 15 0.2142 Belarus 67 0.1990 Russian Federation 73 -0.1066 Moldova 113 -0.1376 Botswana 126 -0.1586 Côte d’Ivoire 166 -0.1679 Namibia 129 -0.1967 Tajikistan 124 -0.2390 South Africa 125 -0.2726 Central African Republic 178 -0.2778 Zambia 163 -0.3990 Swaziland 141 -0.8603
Scheme 1: The "ideal" circle of infl uence on Human Resources, technology, innovations and the ability of their absorption on economic growth and development
Source: Soete, L.: Notes on UIL-Related Policies of National Governments in How Universities Promote Economic Growth, The World Bank, Washington, 2007
Economic growth and prosperity are based on a combination of optimal functioning of an educational system and development level of research capacity, which determines the development of innovations and technology. Namely, educated employees, i.e. the human capital, become the moving force of the creation of knowledge, which enables greater number of innovations. Innovations lead to technological changes,
which signifi cantly accelerate economic growth. According to Drucker, (his thesis
was proven on the paradigm of New Zealand), the economy of knowledge and national knowledge-based economy differ from traditional economies by the following: shareable information becomes the basic resource, the value of which grows by its use; location, i.e. position of the economy becomes irrelevant – the market becomes virtual, knowledge and information move where demand is the greatest and obstacles the smallest, prices become a matter of context, and the same product or service can be charged differently every time, human resources become the basic value of the economy of knowledge. Investments made in science, technology
and innovations, especially in knowledge management, are very signifi cant.
In a knowledge-based economy, knowledge management becomes a success strategy
which is focused on rational, i.e. effective and effi cacious, use of knowledge as an
important non-material resource in contemporary production and service processes.
Effi cacious use of knowledge becomes a necessary pre-requisite of economic
development. In such conditions, the competitive position of a national economy primarily depends on the quality of its human resources. Their use and investments become the key developmental factors, and education provides for the acquisition
of knowledge, skills, attitudes and values which an individual needs in order to
fulfi l his/her work and social roles. (http://nvk.multilink.hr/dokumenti/119___
Obrazovanje%20za%20rast%20i%20razvoj.pdf).
The following scheme methodologically determines the indicators of human resources development, research capacity, innovations and technology, calculation of the common index of a certain group of indicators, and the cumulative index of all the indicators. Based on indicators presented in the scheme, the authors will calculate the current rank of 110 selected countries.
As previously stated, the HDI, in terms of its content, represents the Human Resources Development Index. Human Development Index (symbolised by the letter A in the Scheme) is calculated as a combined index of three indicators. These are: 1. the expected life span; 2. purchasing power of the population; 3. education of the population measured by adult literacy rate and the combined indicator of the share of respective population groups in primary, secondary and tertiary education. These three indicators can adequatly and indirectly show human resources development on a macro level, because the longer expected life span of the population implies better health care, and it results in better psycho-physical abilities, i.e. greater vitality of the people. Purchasing power of the population indirectly shows the level of satisfaction of needs, contentment and motivation level of employees. Also, it indirectly shows labour productivity, although not precisely enough (because GDP per capita, and not per employee, is taken into consideration). Ultimately, the achieved education level indirectly shows the level of mastering knowledge and skills necessary for achieving growth and development.
An increase in the percentage of highly educated population is a component of a
long-term strategy of research capacity development(B). The result of investments
in their development is a dynamic co-ordination of the correlation between science
and society, and promotion of the effi ciency of two-sided communication channel
between science and society. This is why the Research Capacity Index is an index combined of three indicators: 1. investments in research and development, 2.
investments in tertiary education, and 3. the number of scientifi c publications.
Positive infl uence of the above-mentioned indicators has a direct impact on higher
effi ciency of technology and innovations (C). Namely, more educated human
resources produce a greater number of scientifi c and expert research, the result of
which is a greater number of scientifi c publications, which contribute to an increase
in the number of patents, licences and trademarks. A patent is a document which protects the exclusive right of explotation of an invention. An invention which has all
the characteristics of patentability undergoes a registration and certifi cation process
and obtains patent protection. The patent is, in fact, ownership, and the inventor can allow other persons to use it for a limited period of time and provide them with a licence, or he can fully transfer the ownership to other persons. Thus, the patent
Scheme 2: Contemporary indicators of Human Resources development, research capacity, innovations and technology
Human Development (A)
INDICATOR Expected life span Adult literacy Inclusion in education GDP per capita
INDEX Expected Life Span Index Education Index GDP Index
Human Resources Development Index (HDI)
Research capacity (B)
INDICATOR Investments in research and development
Investments in tertiary education The number of scientific publications per one
million inhabitants
INDEX Investments in Research and Development Index
Investments in Tertiary Education Index
Number of Scientific Publications Index
Research Capacity Index
Technology and Innovation Efficiency Index (C) INDICATOR patents applied in the Number of residents'
region Receipts from licensing in USD
Number of residents' trademarks applied
in the region
INDEX Number of Patents Index Receipts from Licensing Index Trademarks Index Number of
Technology and Innovation Efficiency Index
The ability to absorb knowledge and technology (D)
INDICATOR Labour Force Productivity GDP per capita
INDEX Productivity Index Labour Force GDP Index
Absorption of Knowledge and Technology Index
C U M U L A T I V E I N D E X (A+B+C+D)/4
Source: Authors’ calculation according to the Human Development Indicators 2007 and How Universities Promote Economic Growth, The World Bank 2007
system is a sort of a trade in which the inventor agrees to disclose the details of his
invention to the society, for the benefi t of the whole society and for the purpose of
technological and economic development and progress, in exchange for exclusive use during a certain period of time. (Intellectual Property Rights, 2009; Patent Act,
Offi cial Gazette, 173/03). A trademark is a protected mark or a symbol, used by an
individual, a business organisation or some other entity, with the purpose of unique
identifi cation of its products or services in order for them to be recognized by the
consumers (Trademark Act, Offi cial Gazette 173/03). The Technology and Innovation
Effi ciency Index is an index combined of: 1. the number of patents by residents of a
certain country applied in the region; 2. receipts from licensing, and 3. the number of residents’ trademarks applied in the region.
The ability to absorb knowledge and technology is refl ected in successful dispersion
of new technologies in an economy. The basic premise of the ability to absorb
knowledge and technology is refl ected in greater productivity of labour force,
which generates greater production, and a greater income level. The Knowledge and Technology Absorption Index is an index combined of two indicators: 1. labour force productivity and 2. GDP per capita.
The following formula and its derivations are used for transformation of all of the above-mentioned indicators into an index that obtains values ranging from zero to one, which enables their comparison and aggregation:
)
min(
)
max(
)
min(
x
x
x
x
index
x
−
−
=
−
Where min(x) and max(x) are the lowest and the highest value of the x variable. In the calculation of the Human Development Index for the calculation of the GDP index, the World Bank methodology, for example, uses the quotient of the natural GDP logarithm per capita, reduced by a natural logarithm of the number 100 and the natural logarithm
of USD 40,000 as the supposed maximum value of GDP per capita.8
The cumulative index (A+B+C+D)/4, which shows the developmental position of the observed country and enables its comparison with other countries, is obtained by an average aggregate of all indices.
What follows is an analysis of the position held by the Republic of Croatia and the 110 selected countries, based on the calculation of all four groups of the above-mentioned indicators. The bird’s-eye-view method is also used to analyse the deviation of the Republic of Croatia in the observed categories, as well as regression
8 ) 100 log( ) 000 . 40 log( ) 100 log( ) log( − − = GDPpc
GDP index , cf. OUN methodology for HDI calculation, for example,
analysis, which is used in an effort to explain the deviation in the development of an individual component of contemporary indicators of human resources development, research capacity, innovations and technology and gross domestic product.
3. Impact of Human Resources development and technological
achievements on the economic growth of the republic of Croatia
and the selected countries
The table containing calculation of the Human Resources Development Index, Research
Capacity, Technology and Innovation Effi ciency, and the Ability to Absorb Knowledge
and Technology Index for selected countries (in the Appendix of the paper, cf., p. 288), shows index calculations for 110 countries. The countries are ranked according to the value of the cumulative index, from the highest to the lowest.
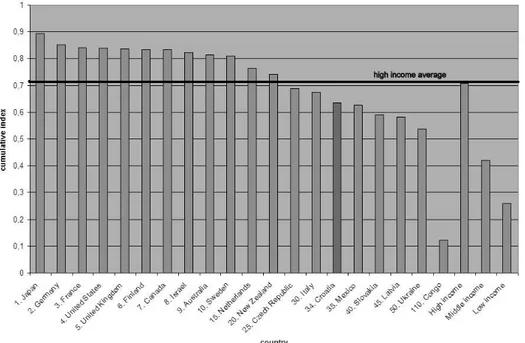
The chart which shows the cumulative index of human resources development,
research capacity, technology and innovation effi ciency, and the ability to absorb
knowledge and technology index for the selected countries in 2006 is provided in the following section of the paper. The chart shows ten countries of the highest rank,
every fi fth country to the 50th place (including the Republic of Croatia), and the
country of the lowest rank.
According to the Cumulative Index, the most developed country is Japan, followed by Germany, France and the Unites States of America. The Republic of Croatia was
ranked 34th out of 110 analysed countries, i.e. it is located in the fi rst third of the
chart. It is important to note9 that, according to the Human Resources Development
Index by the OUN, the Republic of Croatia was ranked 45th out of 179 countries,
i.e. it was ranked in the fi rst quarter of the countries chart. This points to the fact
that the cumulative index, as the average of Human Resources Development Index,
Research Capacity, Technology and Innovation Effi ciency Index, and the Ability to
Absorb Knowledge and Technology Index, refl ects the current development state of a
country more precisely. The inability of a country to keep abreast of development of a country in comparison with the average development level in a certain component can be determined on the basis of a calculation which is derived from data provided in the table in the appendix to this paper.
Although the chart shows a signifi cant development lag of the Republic of Croatia in
comparison with the most developed countries, Croatia’s slow pace of development in key developmental components in 2006 will be determined by additional calculations, and the bird’s-eye-view method.
9 Cf. Table 2.: The average change rate of Human Resources Development Index for the period be-tween 1988 and 2006, p. 271.
In 2006, the expected life span in the Republic of Croatia was 75.3 years, the literacy
rate10 98.1%, and GDP per capita USD14,309 PPP. (World Development Report,
2009) The index of 0.8620 grouped the Republic of Croatia among countries with high Human Resources Development Index. However, in the same year, Central and Eastern European countries (Estonia, Hungary, Lithuania, Slovenia, Poland and the Czech Republic) had the illiteracy rate of 0.2% to 0.7 %, and about 60% of the population of the relevant age group was included in tertiary education. These countries achieved from 4.63 (Lithuania) to 74.05 % (Cyprus) higher gross domestic product per capita than the Republic of Croatia. This resulted in a development lag of the Republic of Croatia in terms of human resources development, in comparison with the observed countries which joined the European Union after May 1, 2004. The Republic of Croatia even more lags behind highly developed countries such as Japan, Germany, France, Finland, Sweden, Ireland... Also, the Republic of Croatia
10 According to the UN defi nition, a literate person is a person with the ability to understand, interpret, communicate, calculate and use written and printed material in accordance with its meaning. Literacy enables the continuum of learning in order to fulfi ll individual objectives, knowledge and potential and to participate in the society, http://www.uis.unesco.org/ (12.3.2009.)
Figure 2: The Cumulative Index of Human Resources development, research capacity,
technology and innovation effi ciency and the ability to absorb knowledge
and technology for the selected countries
signifi cantly lags behind the highly developed countries in terms of research capacity development. Although Croatia invests more in research and development (1.22% of GDP) than neighbouring countries which joined the European Union in the last accession wave (more than Estonia by 18.85%, Latvia 37.7%, Lithuania 53.28%, Hungary 22.13%, Poland 53.28%, and Slovakia 57.38%), investment into research and development is almost two times smaller than those in the highly developed countries. This difference is especially visible in investments made in tertiary education. The highly developed countries invest up to 18 times more than Croatia. The following table shows the deviation of the Republic of Croatia in the key developmental indicator components in 2006. The table facilitates comparison of Croatia with its neighbouring countries, as well as with the most developed countries. Table 3: Deviation index of Croatia in key developmental indicator components in
comparison with the selected countries in 2006
(Croatia=100) Country Human Resources Development Index Research Capacity Index Technology and Innovation Effi ciency Index Ability to Absorb Knowledge and Technology Index Cumulative Index Croatia 100.00 100.00 100.00 100.00 100.00 Japan 110.90 176.94 195.50 121.47 140.71 Germany 109.05 167.42 172.74 119.97 133.98 France 110.79 155.87 168.23 121.50 132.16 United States 110.21 115.53 199.17 128.19 131.93 United Kingdom 109.28 152.62 170.28 122.01 131.56 Finland 110.67 170.63 145.14 122.30 131.11 Canada 112.18 158.20 151.83 124.21 131.08 Israel 107.89 191.08 131.77 115.44 129.51 Australia 111.95 145.91 150.77 123.04 128.21 Sweden 111.14 182.38 109.63 122.94 127.53 Austria 110.32 146.39 128.20 122.76 123.80 Spain 110.09 131.30 143.60 117.04 121.84 Ireland 111.37 116.50 133.51 126.66 120.79 Netherlands 111.14 146.67 104.00 123.34 120.16 Switzerland 110.79 165.07 79.49 123.77 119.34 Belgium 109.98 138.14 112.37 121.99 119.22 Norway 112.30 134.50 95.21 126.79 117.88 Denmark 110.44 150.95 74.76 123.79 115.83 Greece 109.86 113.21 106.59 116.41 111.92 Czech Republic 104.06 118.75 104.60 109.02 108.36 Slovenia 107.08 108.58 97.62 114.61 108.04 Hungary 101.74 105.01 126.59 103.99 107.28
Country Human Resources Development Index Research Capacity Index Technology and Innovation Effi ciency Index Ability to Absorb Knowledge and Technology Index Cumulative Index Portugal 104.41 104.04 104.22 110.94 106.31 Italy 109.63 133.39 47.84 118.65 106.16 Poland 101.51 105.88 104.34 101.33 102.74 Estonia 101.04 79.69 77.83 115.02 97.45 Bulgaria 96.75 80.72 114.02 95.59 96.42 Turkey 92.58 108.68 82.93 97.30 95.32 Slovakia 101.16 89.57 57.13 106.05 93.00 Lithuania 100.81 84.61 60.57 103.80 91.87 Latvia 100.12 53.21 87.16 107.12 91.47 Romania 95.71 78.58 102.37 88.10 91.38 Ukraine 91.18 58.50 103.84 82.06 84.58 Serbia 95.24 50.19 56.41 82.11 76.32 Georgia 88.52 39.86 79.93 79.05 75.24 Congo 41.87 8.92 0.22 11.02 19.21 High income 107.89 109.06 99.91 114.86 111.39 Middle income 82.18 36.48 38.15 72.52 66.14 Low income 52.73 22.89 5.28 37.97 40.70
Source: Authors’ calculation
The table shows average deviations in the developmental indicator components of the Republic of Croatia in comparison with the selected countries. Although Croatia has been grouped among countries of higher medium economic development (according to the criteria of the World Bank), and to a group of countries of high human resources development (according to the OUN criterion), in terms of key developmental components, Croatia lags behind the most in the application of research
capacity, and in the effi ciency and application of technology and innovations. When
Croatia is compared with the neighbouring countries, it can be clearly seen that it lags behind Slovenia in terms of human resources development (lag of 7.08 %), as well as the Research Capacity Index (lag of 8.58 %). The Technology and Innovation
Effi ciency Index shows that Croatia lags behind Austria (28.2 %), and Estonia (15.02
%) in terms of ability to absorb knowledge and technology. In global terms, Croatia lags the most behind Norway in human resources development (12.30 %), Israel in terms of research capacity (91.08 %), and the United States of America in the ability
to absorb knowledge and technology (28.19 %), and the effi ciency of technology
and innovations (99.17 %). Taking into consideration almost a double lag behind the average of highly developed countries in terms of all developmental indicator components, Croatia will have to make greater efforts in order to reach the level of highly developed countries and the European Union Member States.
Figure 3: Deviation of the Republic of Croatia in terms of key developmental indicator components – bird’s eye view
Notes: HDI Index – Human Resources Development Index; RC Index – Research Capacity Index; IT Index - Technology and Innovation Effi ciency Index; AC Index – Ability to Absorb Knowledge and Technology Index; HR – Croatia; SLO – Slovenia; NO – Norway; ISR – Israel; US – the United States of America; AUT – Austria; EST - Estonia; HI – high income countries.
Source: Authors’ calculation
Croatia’s slugging economic growth in the key developmental components is shown in the chart by the bird’s eye view method. Greater distance from the starting point means a greater developmental lag behind the more developed countries in a certain component. The bird’s-eye-view method provides an insight into slugging growth in terms of an individual component, and determination of critical areas to which the bearers of economic policy should pay special attention.
The chart analysis provides several conclusions:
a) Croatia lags behind the most in terms of research capacity and the effi ciency of
technology and innovations,
b) Slovenia is the most developed country from of all the analysed neighbouring countries (European Union countries), in two out of four developmental components,
c) The neighbouring countries (Slovenia, the Czech Republic, Hungary, Estonia,
Poland...) use their technological and innovation capacities insuffi ciently, and
this is why they lag behind the average of the medium-developed countries, and even more behind the average of highly developed countries,
d) The Republic of Croatia, as well as the other observed neighbouring countries,
must make a shift from the scientifi c and educational policy which has primarily
been focused on reproduction of knowledge, to a higher degree of scientifi c and
professional research,
e) The consequence of slow absorption of knowledge and technology is slow economic growth and lagging behind with the Republic of Croatia in all the components of human resources development, research capacity, innovations and technology,
f) The Human Resources Development Index is insuffi cient in the analysis of
economic development and the thesis mentioned in this paper that unambiguous explanations of technological progress of human resources development as
the basic moving force of economic growth are no longer suffi cient, is correct.
Although Croatia is grouped among countries of high human resources development (according to the HD Index), the actual position of Croatia is that of (lower) medium development level.
Taking into consideration the above-mentioned conclusions resulting from the bird’s-eye-view method, the impact of the Human Resources Development Index,
Research Capacity Index, Technology and Innovation Effi ciency Index, and the
Ability to Absorb Knowledge and Technology Index on the economic growth will
be determined by the OLS regression method11.
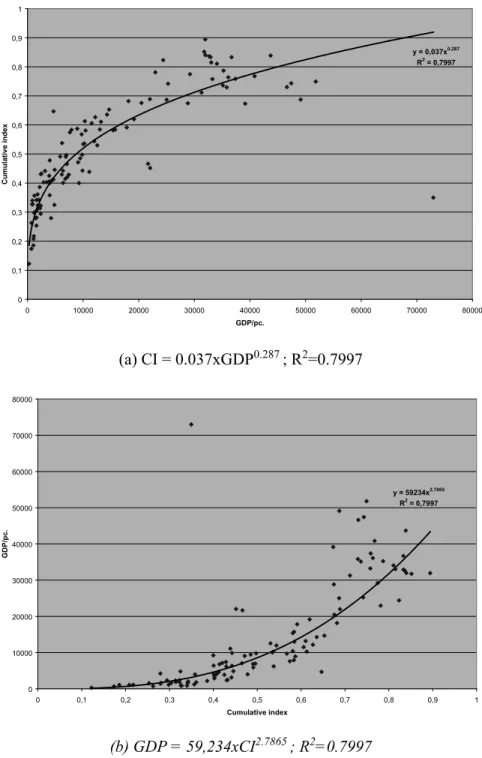
Figure 4: Correlation between the cumulative index and GDP/pc in selected countries (a) and GDP/pc and the Cumulative Index (b) (n=110)
y = 0,037x0,287 R2 = 0,7997 0 0,1 0,2 0,3 0,4 0,5 0,6 0,7 0,8 0,9 1 0 10000 20000 30000 40000 50000 60000 70000 80000 GDP/pc. Cumulative index (a) CI = 0.037xGDP0.287 ; R2=0.7997 y = 59234x2,7865 R2 = 0,7997 0 10000 20000 30000 40000 50000 60000 70000 80000 0 0,1 0,2 0,3 0,4 0,5 0,6 0,7 0,8 0,9 1 Cumulative index GDP/pc. (b) GDP = 59,234xCI2.7865 ; R2=0.7997
The models show a clear correlation between the growth of Human Resources
Development Index, research capacity, effi ciency of technology and innovations, and
the ability to absorb knowledge and technology on economic growth (model a), but
also vice versa (model b). Taking into consideration the coeffi cient of determination
which marks the correlation between two or more variables, which in (a) and (b) models represents 89.42% of all points in the function, a strong correlation can be established between the observed phenomena, based on which conclusions can be drawn. The above-mentioned models provide assessment of the effort that individual countries would have to make in order to achieve an adequate income level. For example, in order to achieve an average income value of highly developed countries, the Republic of Croatia should increase the Human Resources Development Index,
Research Capacity Index, Technology and Innovation Effi ciency Index, and the
Ability to Absorb Knowledge and Technology Index by 5.13% (in this case, the cumulative index would amount to 0.67). In order to reach the average income level
of the highly developed OECD12 countries, the increase should amount to 17.8% (the
cumulative index would amount to 0.77). It is evident that both increases demand great effort from the bearers of economic policy, and this is why the authors propose several possible guidelines for development of certain components:
a) Increase in human capital: Considering the fact that demographic trends in
Croatia indicate that the population has been getting older, and considering the low birth rates, which will result in the lack of student- and working population in the future, it is necessary to enforce measures of pro-birth demographic policy
(increase of maternity benefi ts and child support); the problem of emigration
will be a great challenge to the economic growth of this country in the future, especially the emigration of educated workers, who need to be kept in Croatian work places by provision of additional stimulations.
b) Stimulation of productivity: by stimulating greater investments in research and
development; fi nancing of vocational education in Croatia which has currently
been viewed in a traditional way; by the reform of vocational education; the need for particular practical knowledge and skills should be addressed, such as inter-personal relationships and social competencies; additional investments should be made in college education - such investments in Croatia have currently been too low in comparison with the European average; life-long education should be stimulated - for now, it has mostly been conducted through adult education policy. Good examples should be applied from other European economies; information-communication technology should be applied in education; diverse, innovative learning approaches should be encouraged; direct investments in regional development should be increased.
12 The average income level of highly developed OECD countries according to the World Bank criteria for 2006 amounts to USD 35331
4. Conclusion
The result of the research supports the thesis that the Human Resources Development
Index is insuffi cient in the analysis of economic growth, that trained human resources
provide for technological progress, and that development, application and expansion of new technological achievements have a direct impact on the economic growth
of a country. The main contribution of the paper is refl ected in analysis of the
development of the Republic of Croatia and 110 selected countries in terms of human resource development index components and the components of the Technological Achievement Index.
Although, in global terms, Croatia has been grouped among countries with high Human Resources Development Index (according to the cumulative index of human resources development, research capacity, innovation and technology), Croatia can
be classifi ed among countries of (lower) medium development level. When Croatia
is compared with neighbouring countries, the following is especially evident: it is lagging behind Slovenia in terms of human resources development and research
capacity development; lagging behind Austria in the effi ciency of technology
and innovations; lagging behind Estonia in its ability to absorb knowledge and technology.
Croatia has to additionally invest in the growth of human capital. It is necessary to encourage productivity by stimulating investments in research and development,
by fi nancing and reforming vocational education, by making additional investments
in college education and by encouraging life-long learning. This would facilitate compliance with the pre-requisites for faster absorption of knowledge and technology and reduction of developmental lag. It would also provide for an in competitiveness and reach the average level of development of the European Union Member States as well as the most developed countries in the world.
The calculations are based on data acquired from relevant databases for 110 countries in the world. Data for other countries have not been published, which is a typical limitation in the application of such research methodology. Further research should additionally establish the importance of individual economic growth component derived from the analysed model by statistical and mathematical methods. This
would pave the way for precise determination of specifi c measures for stimulation
of the effi ciency of technology and innovations, the ability to absorb knowledge and
References
Bagolin I. (2008) “Human Development Index (HDI) and its family of indices: an evolving critical review”, Revista de Economia, Vol. 34, No. 2, p. 7-28.
Bagolin I. (2008) “Human Development Index – a poor representation to Human Development Approach” // http://www-1.unipv.it/deontica/ca2004/papers/ bagolin.pdf (7.7.2008.).
Bajo, A. (2003) Financiranje visokog školstva i znanosti, Institut za javne fi nancije,
Zagreb. (Financing of Higher Education and Science).
Becker, G. S., (1993) Human Capital – A Theoretical and Empirical Analysis with Special Reference to Education, The University of Chicago Press, Third edition, Chichago.
Blitzer, J. (2005) “Measuring knowledge stocks: A process of creative destruction”, Kyklos, Vol. 58, No. 3, p. 379-393.
Bowman, M.J.(1968) “Principles in the Valuation of Human Capital”, The Review of Income and Wealth, No. 3., Groningen.
Bujas, G. (2001) “Determinants of Economic Growth with Reference to Transitional Countries”, Proceedings of Rijeka Faculty of Economics, vol. 19., no. 2., p. 19-31.
Dragičević, M. (1996) Ekonomija i novi razvoj, Alineja, Zagreb (Economics and
New Development).
Družić, I. (2004) Resursi i tržišta hrvatskog gospodarstva, Politička kultura, Zagreb.
(Resources and Markets of Croatian Economy).
Drucker, J. (2007) “Assessing the regional economic development impact of universities”, International regional science review, vol. 30, No. 1, p. 20-46. Drucker, P. (1992) Nova zbilja, Novi liber, Zagreb (The New Realities).
Halkos, G. et al. (2008) “Trade effi ciency and economic development: evidence
froma a cross country comparison”, Applied Economics, vol. 40, No. 21, p. 2749-2764.
Harbison, F., Myers, C., A. (1964) Education, Manpower, and Economic Growth, McGraw-Hill Book Company, New York.
Harper-Anderson, E. (2008) “Measuring the connection between workforce development and economic development”, Economic development quarterly, Vol. 22, No. 2, p. 119-135.
Hayton, JC. (2005) “Competing in the new economy: The effect of intellectual capital on corporate entrepreneurship in high-technology new ventures, R&D Management, Vol. 35. No. 2, p. 137-155.
Huang, W.C. (2000.) Human Capital and economic Development, W.E. Upjohn Institute for Employment Research, Michigan.
<http://devdata.worldbank.org/edstats/cd1.asp> (accessed 3/17/2007). <http://go.worldbank.org/JVXVANWYY0> (accessed 29/2/2008).
<http://www.uis.unesco.org/> (accessed 3/12/2009). <http://www.hrvatska21.hr/znanost%2030_6_2003.pdf> (accessed 3/10/2007). <http://nvk.multilink.hr/dokumenti/119___Obrazovanje%20za%20rast%20i%20 razvoj.pdf> (accessed 29/2/2008). <http://www.weforum.org/pdf/Global_Competitiveness_Reports/Reports/ gcr_2006/gcr2006_rankings.pdf> (accessed 15/7/2009).
Jayasuriya, R. et al. (2005) “Measuring and explaining the impact of productive
effi ciencx on economic development”, World Bank Economic Review, vol. 19,
No. 1, p. 121-140.
Karaman Aksentijević, N., Ježić, Z. (2004) “Tehnološki aspekt razvoja proizvodne
strukture hrvatskog gospodarstva”, Društvo i tehnologija, Rijeka. (Technological Aspect of Development of the Production Structure of Croatian Economy).
Karaman Aksentijević, N., Ježić, Z. (2009) „Human Resources Development of
Republic of Croatia and Primorsko-goranska County and their infl uence on
economic growth”, Tourisma and Hospitality Management, vol. 15., No. 1, p. 13-25.
Lowther, J., (2004) „Kvaliteta hrvatskoga formalnog obrazovnog sustava”, Deloitte Touch Tohmats, Washington, http://www.ijf.hr/konkurentnost/lowther.pdf (3/16/2007) (Quality of Croatian Formal Education System).
Measuring productivity (2002) OECD Manual, Paris.
Prava intelektualnog vlasništva (2009), Državni zavod za intelektualno vlasništvo, Zagreb (Intellectual Property Rights).
Soete, L, (2007) “Notes on UIL-Related Policies of National Governments In: How Universities Promote Economic Growth”, The World Bank, Washington.
Stepanov, L.V. (1972) World Economics and World’s Future, In: Bhagwati, J.N.: Ecconomic and World Order From the 1970’s to the 1990’s, Mcmilan Publishing Co., New York.
Sauvy, A.(1952) Theorie Generale de la Population, PUF, Paris.
Schultz, T.W (1985) Ulaganje u ljude, Centar za kulturnu djelatnost, Zagreb (Investing in People).
Todaro, M., P. (2003), Economic Development, Longman, New York. UNCTAD Handbook of Statistics, 2005.
--- (2003) Zakon o patentu, Narodne novine, No. 173, Zagreb (Patent Act). --- (2003) Zakon o žigu, Narodne novine, No. 173, Zagreb (Trademark Act). --- (2005) Human Development Report 2005, UNDP, Oxford.
--- (2008) Human Development Report 2008, UNDP, Oxford.
--- (2008) World Development Indicators 2007, The World Bank, Washington. --- (2009) World Development Indicators 2008, The World Bank, Washington.
Razvijenost ljudskih potencijala i istraživa
č
kih kapaciteta i njihov
utjecaj na ekonomski rast
1Nada Karaman Aksentijević2, Zoran Ježić3
Sažetak
Cilj ovog rada je uz pomoć komponenti indeksa razvijenosti ljudskih potencijala i komponenti indeksa tehnološkog dostignuća analizirati razvijenost Republike Hrvatske i 110 odabranih zemalja. Metodom ptičje perspektive utvrđena su razvojna zaostajanja Republike Hrvatske u promatranim razvojnim pokazateljima i njihovim komponentama te su dani prijedlozi za njihovo poboljšanje. Također, regresijskom analizom utvrđen je utjecaj analiziranih pokazatelja i njegovih komponenti na ekonomski rast Republike Hrvatske i odabranih zemalja. Navedene su moguće smjernice napretka pojedinih komponenti. Rezultati istraživanja dokazuju da indeks razvijenosti ljudskih potencijala nije dovoljan u analizi gospodarske razvijenosti te da postoji očekivana povezanost između osposobljenih ljudskih potencijala, koji čine tehnološki napredak mogućim, i ekonomskog rasta zemlje. S obzirom na primjenom modela utvrđenu vezu između porasta indeksa razvijenosti ljudskih potencijala, istraživačkih kapaciteta, učinkovitosti tehnologije i inovacija te sposobnosti apsorpcije znanja i tehnologije na gospodarski rast, Hrvatska mora ulagati dodatna sredstva u povećanje ljudskog kapitala i produktivnosti rada da bi smanjila razvojna zaostajanja.
Ključne riječi: ljudski potencijali, istraživački kapaciteti, ekonomski rast,
Republika Hrvatska
JEL klasifi kacija: O10, O15, O33, I0
1 Prikazani rezultati proizašli su iz znanstvenog projekta (Ljudski potencijali i ekonomski razvoj
Hrvatske, broj 081-0811403-1409), provođenog uz potporu Ministarstva znanosti, obrazovanja i športa Republike Hrvatske.
2 Redoviti profesor, Sveučilište u Rijeci, Ekonomski fakultet, Ivana Filipovića 4, 51000 Rijeka. Znanstveni interes: teorija i politika ekonomskog razvoja, regionalni razvoj, ekonomska politika, industrijska politika, razvoj ljudskih potencijala. Tel: + 385 51 355 111. Fax: + 385 51 212 268. E-mail: nkaraman@efri.hr.
3 Asistent-znanstveni novak, Sveučilište u Rijeci, Ekonomski fakultet, Ivana Filipovića 4, 51000 Rijeka. Znanstveni interes: razvoj ljudskih potencijala, obrazovanje i ekonomski razvoj. Tel: + 385 51 355 111. Fax: + 385 51 212 268. E- mail: zjezic@efri.hr.
Appendix
Table: Calculation of Human Resources Development Index, Research Capacity
Index, Technology and Innovation Effi ciency Index and the Ability to Absorb
Knowledge and Technology Index for the Selected Countries
No Country Human Resources Development Index Research Capacity Index Technology and Innovation Effi ciency Index Ability to Absorb Knowledge and Technology Index Cumulative Index 1 Japan 0.9560 0.8226 0.8512 0.9476 0.8943 2 Germany 0.9400 0.7783 0.7521 0.9359 0.8516 3 France 0.9550 0.7246 0.7325 0.9478 0.8400 4 United States 0.9500 0.5371 0.8672 1.0000 0.8386 5 United Kingdom 0.9420 0.7095 0.7414 0.9518 0.8362 6 Finland 0.9540 0.7932 0.6319 0.9540 0.8333 7 Canada 0.9670 0.7355 0.6611 0.9689 0.8331 8 Israel 0.9300 0.8883 0.5737 0.9006 0.8232 9 Australia 0.9650 0.6783 0.6565 0.9598 0.8149 10 Sweden 0.9580 0.8479 0.4773 0.9591 0.8106 11 Austria 0.9510 0.6806 0.5582 0.9577 0.7869
12 Korea (Republic of) 0.9280 0.5316 0.7666 0.8986 0.7812
13 Spain 0.9490 0.6104 0.6252 0.9130 0.7744 14 Ireland 0.9600 0.5416 0.5813 0.9881 0.7677 15 Netherlands 0.9580 0.6819 0.4528 0.9622 0.7637 16 Switzerland 0.9550 0.7674 0.3461 0.9655 0.7585 17 Belgium 0.9480 0.6422 0.4893 0.9516 0.7578 18 Norway 0.9680 0.6253 0.4145 0.9891 0.7492 19 Singapore 0.9180 0.4876 0.5906 0.9761 0.7431 20 New Zealand 0.9440 0.5415 0.5732 0.9074 0.7415 21 Denmark 0.9520 0.7018 0.3255 0.9657 0.7362 22 Kuwait* 0.9120 0.3781 0.0000 0.9015 0.7305 23 Iceland** 0.9680 0.0000 0.0000 0.4910 0.7295 24 Greece 0.9470 0.5263 0.4641 0.9081 0.7114 25 Czech Republic 0.8970 0.5521 0.4554 0.8504 0.6887
26 United Arab Emirates* 0.9030 0.1909 0.0000 0.9676 0.6872
27 Slovenia 0.9230 0.5048 0.4250 0.8941 0.6867
28 Hungary 0.8770 0.4882 0.5512 0.8112 0.6819
29 Portugal 0.9000 0.4837 0.4538 0.8655 0.6757
30 Italy 0.9450 0.6201 0.2083 0.9256 0.6747
31
Hong Kong. China
No Country Human Resources Development Index Research Capacity Index Technology and Innovation Effi ciency Index Ability to Absorb Knowledge and Technology Index Cumulative Index 32 Poland 0.8750 0.4923 0.4543 0.7905 0.6530 33 China 0.7620 0.5758 0.5892 0.6597 0.6467 34 Croatia 0.8620 0.4649 0.4354 0.7801 0.6356 35 Mexico 0.8420 0.4307 0.4747 0.7602 0.6269 36 Estonia 0.8710 0.3705 0.3389 0.8973 0.6194 37 Bulgaria 0.8340 0.3753 0.4965 0.7457 0.6129 38 Russian Federation 0.8060 0.3094 0.5663 0.7602 0.6105 39 Turkey 0.7980 0.5052 0.3611 0.7591 0.6058 40 Slovakia 0.8720 0.4164 0.2487 0.8273 0.5911 41 Brazil 0.8070 0.5055 0.3304 0.7047 0.5869 42 Chile 0.8740 0.4197 0.2340 0.8108 0.5846 43 Lithuania 0.8690 0.3933 0.2637 0.8097 0.5839 44 Macedonia (TFYR)* 0.8080 0.0216 0.2760 0.6444 0.5834 45 Latvia 0.8630 0.2474 0.3795 0.8356 0.5814 46 Romania 0.8250 0.3653 0.4457 0.6873 0.5808 47 Thailand 0.7860 0.3546 0.4346 0.7221 0.5743 48 Belarus 0.8170 0.3788 0.3132 0.7614 0.5676 49 Argentina 0.8600 0.4269 0.1153 0.7725 0.5437 50 Ukraine 0.7860 0.2719 0.4521 0.6402 0.5376 51 Uruguay 0.8590 0.3008 0.2324 0.7519 0.5360 52 Iran 0.7770 0.4146 0.2314 0.7137 0.5342 53 Malaysia 0.8230 0.2045 0.3078 0.7854 0.5302 54 Kazakhstan 0.8070 0.1138 0.3130 0.7565 0.4976 55 Tunisia 0.7620 0.3964 0.1497 0.6755 0.4959 56 Albania* 0.8070 0.0000 0.0478 0.6184 0.4911 57 Cuba 0.8550 0.3186 0.1719 0.6160 0.4904 58 Serbia 0.8210 0.2333 0.2456 0.6405 0.4851 59 Georgia 0.7630 0.1853 0.3480 0.6166 0.4782 60 South Africa 0.6700 0.4379 0.0906 0.6873 0.4715
61 Trinidad and Tobago 0.8330 0.0104 0.1023 0.9194 0.4663
62 Peru 0.7880 0.2199 0.2449 0.6088 0.4654 63 Saudi Arabia 0.8350 0.1506 0.0000 0.8209 0.4516 64 Armenia 0.7770 0.0841 0.2295 0.6918 0.4456 65 Costa Rica 0.8470 0.1868 0.0000 0.7366 0.4426 66 Colombia 0.7870 0.2722 0.0346 0.6759 0.4424 67 Philippines 0.7450 0.2031 0.2765 0.5413 0.4415 68 Venezuela 0.8260 0.1634 0.0000 0.7649 0.4386 69 India 0.6090 0.4335 0.1703 0.5172 0.4325
No Country Human Resources Development Index Research Capacity Index Technology and Innovation Effi ciency Index Ability to Absorb Knowledge and Technology Index Cumulative Index 70 Moldova 0.7190 0.1472 0.3260 0.5296 0.4305 71 Azerbaijan 0.7580 0.1974 0.0869 0.6761 0.4296 72 Algeria 0.7480 0.1268 0.2056 0.6349 0.4288 73 Sri Lanka 0.7420 0.1089 0.2470 0.6021 0.4250 74 Ecuador 0.8070 0.0052 0.2022 0.6675 0.4205 75 Bosnia and Herzegovina 0.8020 0.0000 0.1621 0.6925 0.4141 76 Jordan 0.7690 0.2534 0.0000 0.6263 0.4122 77 Angola* 0.4840 0.0000 0.2650 0.4815 0.4102 78 Morocco 0.6460 0.3180 0.0889 0.5687 0.4054 79 Indonesia 0.7260 0.2126 0.0822 0.5905 0.4028 80 Mongolia* 0.7200 0.0276 0.1794 0.2805 0.4025 81 Paraguay 0.7520 0.0069 0.2374 0.6070 0.4008 82 Jamaica 0.7710 0.0522 0.1466 0.6324 0.4005 83 Montenegro* 0.8220 0.0000 0.0000 0.3780 0.4000 84 Uzbekistan 0.7010 0.0852 0.2031 0.5543 0.3859 85 Kyrgyzstan 0.6940 0.0453 0.2200 0.4848 0.3610 86 Bolivia 0.7230 0.1158 0.0317 0.5619 0.3581 87 Ghana* 0.5330 0.1346 0.0000 0.4020 0.3566 88 Cameroon* 0.5140 0.0956 0.0000 0.4181 0.3426 89 Cambodia* 0.5750 0.0043 0.0000 0.4450 0.3414 90 Myanmar* 0.5850 0.0138 0.0000 0.4211 0.3400 91 Uganda 0.4930 0.4974 0.0000 0.3221 0.3281 92 Madagascar* 0.5330 0.0138 0.1387 0.2932 0.3262 93 Turkmenistan 0.7280 0.0000 0.0000 0.5721 0.3250 94 Nigeria* 0.4990 0.0462 0.0000 0.4238 0.3230 95 Viet Nam 0.7180 0.0650 0.0000 0.5066 0.3224 96 Sudan* 0.5260 0.0259 0.0000 0.3910 0.3143 97 Yemen* 0.5670 0.0000 0.1675 0.5184 0.3132 98 Tajikistan 0.6840 0.0086 0.1126 0.4114 0.3042 99 Bangladesh* 0.5240 0.0137 0.0000 0.3569 0.2982 100 Pakistan 0.5620 0.0932 0.2575 0.2640 0.2942 101 Côte d’Ivoire* 0.4310 0.0000 0.0000 0.4118 0.2809
102 Syrian Arab Republic 0.7360 0.0686 0.0000 0.3125 0.2793
103 Kenya 0.5320 0.1651 0.0395 0.3799 0.2791
104 Mozambique* 0.3660 0.0449 0.0000 0.3770 0.2627
105 Senegal* 0.5020 0.0932 0.0000 0.4189 0.2535
No Country Human Resources Development Index Research Capacity Index Technology and Innovation Effi ciency Index Ability to Absorb Knowledge and Technology Index Cumulative Index 107 Burkina Faso 0.3720 0.0155 0.0819 0.3633 0.2082 108 Mali* 0.3910 0.0000 0.0000 0.3511 0.1855 109 Ethiopia* 0.3890 0.0273 0.0000 0.2782 0.1736 110 Congo* 0.3610 0.0415 0.0000 0.0860 0.1221 High income 0.9300 0.5070 0.4350 0.8960 0.7080 Middle income 0.7084 0.1696 0.1661 0.5657 0.4204 Low income 0.4545 0.1064 0.0230 0.2962 0.2587
Note: * Figures of an individual component are zero or tend toward zero (0.001), so the average
cumulative index of these countries was calculated with statistically relevant data. Source: Authors’ calculation