U.S. Census Bureau, Statistical Abstract of the United States: 2000
Population 1
Section 1
Population
This section presents statistics on the
growth, distribution, and characteristics
of the U.S. population. The principal
source of these data is the U.S. Census
Bureau, which conducts a decennial
census of population, a monthly
popula-tion survey, a program of populapopula-tion
estimates and projections, and a number
of other periodic surveys relating to
population characteristics. For a list of
relevant publications, see the Guide to
Sources of Statistics in Appendix I.
Decennial censuses
—The U.S.
Constitu-tion provides for a census of the
popula-tion every 10 years, primarily to establish
a basis for apportionment of members of
the House of Representatives among the
states. For over a century after the first
census in 1790, the census organization
was a temporary one, created only for each
decennial census. In 1902, the Census
Bureau was established as a permanent
Federal agency, responsible for
enumerat-ing the population and also for compilenumerat-ing
statistics on other population and housing
characteristics.
Historically the enumeration of the
popula-tion has been a complete count. That is,
an attempt is made to account for every
person, for each person’s residence, and
for other characteristics (sex, age, family
relationships, etc.). Since the 1940 census,
in addition to the complete count
informa-tion, some data have been obtained from
representative samples of the population.
In the 1990 census, variable sampling
rates were employed. For most of the
country, 1 in every 6 households (about
17 percent) received the long form or
sample questionnaire; in governmental
units estimated to have fewer than 2,500
inhabitants, every other household (50
per-cent) received the sample questionnaire to
enhance the reliability of sample data for
small areas. Exact agreement is not to be
expected between sample data and the
100-percent count. Sample data may be
used with confidence where large numbers
are involved and assumed to indicate
trends and relationships where small
numbers are involved.
Census Bureau data presented here have
not been adjusted for underenumeration.
Results from the evaluation program for
the 1990 census indicate that the overall
national undercount was between 1 and
2 percent. The estimate from the Post
Enumeration Survey (PES) was 1.6 percent,
and the estimate from Demographic
Analysis (DA) was 1.8 percent. Both the
PES and DA estimates show
disproportion-ately high undercounts for some
demo-graphic groups. For example, the PES
estimates of percent net undercount for
Blacks (4.4 percent), Hispanics (5.0
per-cent), and American Indians (4.5 percent)
were higher than the estimated undercount
of non-Hispanic Whites (0.7 percent).
His-torical DA estimates demonstrate that the
overall undercount rate in the census has
declined significantly over the past 50
years (from an estimated 5.4 percent in
1940 to 1.8 percent in 1990), yet the
undercount of Blacks has remained
dispro-portionately high.
U.S. Census Bureau, Statistical Abstract of the United States: 2000
2 Population
While the primary purpose of the CPS is to
obtain monthly statistics on the labor
force, it also serves as a vehicle for
inquir-ies on other subjects. Using CPS data, the
Bureau issues a series of publications
un-der the general title of
Current Population
Reports
, which cover population
character-istics (P20), consumer income (P60),
spe-cial studies (P23), and other topics.
Estimates of population characteristics
based on the CPS will not agree with the
counts from the census because the CPS
and the census use different procedures
for collecting and processing the data for
racial groups, the Hispanic population, and
other topics. Caution should also be used
when comparing estimates for various
years because of the periodic introduction
of changes into the CPS. Beginning in
Janu-ary 1994, a number of changes were
intro-duced into the CPS that effect all data
com-parisons with prior years. These changes
include the results of a major redesign of
the survey questionnaire and collection
methodology and the introduction of 1990
census population controls, adjusted for
the estimated undercount. This change in
population controls had relatively little
im-pact on derived measures such as means,
medians, and percent distribution, but did
have a significant impact on levels.
Population estimates and
projec-tions
— National population estimates start
with decennial census data as benchmarks
and add annual population component of
change data. Component of change data
comes from various agencies, as follows:
National Center for Health Statistics (births
and deaths), Immigration and
Naturaliza-tion Service (legal immigrants), Office of
Refugee Resettlement (refugees), U.S.
Cen-sus Bureau’s International Programs Center
(net movement between Puerto Rico and
the U.S. mainland), Armed Forces,
Depart-ment of Defense, and Office of Personnel
Management (movement of military and
civilian citizens abroad). Emigration and
net undocumented immigration are
pro-jected based on research using census
data. Estimates for states, counties, and
smaller areas are based on the same
com-ponent of change data and sources as the
national estimates. School statistics from
state departments of education and
paro-chial school systems, Federal income tax
returns from the Internal Revenue Service,
group quarters from the Federal-State
Cooperative program and the Veterans
Administration, and medicare data from
the Health Care Financing Administration
are also included.
Data for the population by age for April 1,
1990, (shown in Tables 12, 17, and 18) are
modified counts. The review of detailed
1990 information indicated that
respon-dents tended to provide their age as of the
date of completion of the questionnaire,
not their age as of April 1, 1990. In
addi-tion, there may have been a tendency for
respondents to round up their age if they
were close to having a birthday. A detailed
explanation of the age modification
proce-dure appears in 1990 Census of Population
and Housing Data Paper Listing (CPH-L-74).
Population estimates and projections are
published in the P25 series of
Current
Population Reports
and as
Population
Paper Listings
(PPLs). These estimates
and projections are generally consistent
with official decennial census figures and
do not reflect the amount of estimated
census underenumeration. However,
these estimates and projections by race
have been modified and are not
compa-rable to the census race categories (see
section below under “race”). For details
on methodology, see the sources cited
below the individual tables.
U.S. Census Bureau, Statistical Abstract of the United States: 2000
Population 3
serve as the starting point for these
U.S. Census Bureau, Statistical Abstract of the United States: 2000
4 Population
are set annually by the President in
con-sultation with Congress. After 1 year of
residence in the United States, refugees
are eligible for immigrant status.
The Immigration Reform and Control Act
of 1986 (IRCA) allows two groups of illegal
aliens to become temporary and then
permanent residents of the United States:
aliens who have been in the United States
unlawfully since January 1, 1982
(legaliza-tion applicants), and aliens who were
em-ployed in seasonal agricultural work for a
minimum period of time (Special
Agricul-tural Worker (SAW) applicants). The
applica-tion period for temporary residency for
legalization applicants began on May 5,
1987, and ended on May 4, 1988, while
the application period for SAW applicants
began on June 1, 1987, and ended on
No-vember 30, 1988. Legalization applicants
became eligible for permanent residence
beginning in fiscal year 1989. Beginning
1989 immigrant data include temporary
residents who were granted permanent
residence under the legalization program
of IRCA.
Metropolitan Areas (MAs)
—The general
concept of a metropolitan area is one of
a core area containing a large population
nucleus, together with adjacent
communi-ties that have a high degree of social and
economic integration with that core.
Metro-politan statistical areas (MSAs),
consoli-dated metropolitan statistical areas
(CMSAs), and primary metropolitan
statisti-cal areas (PMSAs) are defined by the Office
of Management and Budget (OMB) as a
standard for Federal agencies in the
prepa-ration and publication of statistics relating
to metropolitan areas. The entire territory
of the United States is classified as
metro-politan (inside MSAs or CMSAs—PMSAs are
components of CMSAs) or nonmetropolitan
(outside MSAs or CMSAs). MSAs, CMSAs,
and PMSAs are defined in terms of entire
counties except in New England, where the
definitions are in terms of cities and towns.
The OMB also defines New England County
Metropolitan Areas (NECMAs) which are
county-based alternatives to the MSAs and
CMSAs in the six New England states. Over
time, new MAs are created and the
bound-aries of others change. The analysis of
historical trends, therefore, must be made
cautiously. For descriptive details and a
listing of titles and components of MAs,
see Appendix II.
Urban and rural
—According to the 1990
census definition, the urban population
comprises all persons living in (a) places of
2,500 or more inhabitants incorporated as
cities, villages, boroughs (except in Alaska
and New York), and towns (except in the
New England states, New York, and
Wis-consin), but excluding those persons living
in the rural portions of extended cities
(places with low population density in
one or more large parts of their area);
(b) census designated places (previously
termed unincorporated) of 2,500 or more
inhabitants; and (c) other territory,
incorpo-rated or unincorpoincorpo-rated, included in
urban-ized areas. An urbanurban-ized area comprises
one or more places and the adjacent
densely settled surrounding territory that
together have a minimum population of
50,000 persons. In all definitions, the
population not classified as urban
consti-tutes the rural population.
U.S. Census Bureau, Statistical Abstract of the United States: 2000
Population 5
the Census Bureau uses reflects
self-identification by respondents; that is the
individual’s perception of his/her racial
identity. The concept is not intended to
reflect any biological or anthropological
definition. Although the Census Bureau
adheres to the overall guidelines of
Direc-tive No. 15, it recognizes that there are
persons who do not identify with a
specific racial group. The 1990 census
race question included an “Other race”
category with provisions for a write-in
entry. Furthermore, the Census Bureau
recognizes that the categories of the race
item include both racial and national origin
or socio-cultural groups.
Differences between the 1990 census and
earlier censuses affect the comparability
of data for certain racial groups and
Ameri-can Indian tribes. The lack of comparability
is due to changes in the way some
respon-dents reported their race as well as
changes in 1990 census procedures related
to the racial classification. (For a fuller
ex-planation, see
1990 Census of Population,
Volume I, General Population
Characteris-tics
(1990 CP-1).)
Data for the population by race for April 1,
1990 (shown in Tables 10, 11, and 15
through 18) are modified counts and are
not comparable to the 1990 census race
categories. These numbers were computed
using 1990 census data by race which had
been modified to be consistent with the
guidelines in Federal Statistical Policy
Directive No. 15 issued by the Office of
Management and Budget. A detailed
expla-nation of the race modification procedure
appears in 1990 Census of Population and
Housing Data Paper Listing (CPH-L-74).
In the CPS and other household sample
surveys in which data are obtained through
personal interview, respondents are asked
to classify their race as: (1) White; (2) Black;
(3) American Indian, Aleut, or Eskimo; or
(4) Asian or Pacific Islander. The
proce-dures for classifying persons of mixed
races who could not provide a single
re-sponse to the race question are generally
similar to those used in the census.
U.S. Census Bureau, Statistical Abstract of the United States: 2000
6 Population
Mobility status
—The U.S. population is
classified according to mobility status on
the basis of a comparison between the
place of residence of each individual at the
time of the survey or census and the place
of residence at a specified earlier date.
Nonmovers are all persons who were living
in the same house or apartment at the end
of the period as at the beginning of the
period. Movers are all persons who were
living in a different house or apartment at
the end of the period than at the beginning
of the period. Movers are further classified
as to whether they were living in the same
or different county, state, or region or were
movers from abroad. Movers from abroad
include all persons, either U.S. citizens or
noncitizens, whose place of residence was
outside the United States at the beginning
of the period; that is, in Puerto Rico, an
outlying area under the jurisdiction of the
United States, or a foreign country.
Living arrangements
—Living
arrange-ments refer to residency in households or
in group quarters. A “household” comprises
all persons who occupy a “housing unit,”
that is, a house, an apartment or other
group of rooms, or a single room that
con-stitutes “separate living quarters.” A
house-hold includes the related family members
and all the unrelated persons, if any, such
as lodgers, foster children, wards, or
em-ployees who share the housing unit. A
per-son living alone or a group of unrelated
persons sharing the same housing unit is
also counted as a household. See text,
Section 25, Construction and Housing, for
definition of housing unit.
All persons not living in housing units are
classified as living in group quarters. These
individuals may be institutionalized, e.g.,
under care or custody in juvenile facilities,
jails, correctional centers, hospitals, or
nursing homes; or they may be residents in
noninstitutional group quarters such as
col-lege dormitories, group homes, or military
barracks.
Householder
—The householder is the
first adult household member listed on the
questionnaire. The instructions call for
list-ing first the person (or one of the persons)
in whose name the home is owned or
rented. If a home is owned or rented jointly
by a married couple, either the husband or
the wife may be listed first. Prior to 1980,
the husband was always considered the
household head (householder) in
married-couple households.
No. 1. Population and Area: 1790 to 1990
[Area figures represent area on indicated date including in some cases considerable areas not then organized or settled, and not covered by the census. Total area figures for 1790 to 1970 have been recalculated on the basis of the remeasurement of states and counties for the 1980 census, but not on the basis of the 1990 census. The land and water area figures for past censuses have not been adjusted and are not strictly comparable with the total area data for comparable dates because the land areas were derived from different base data, and these values are known to have changed with the construction of reservoirs, draining of lakes, etc. Density figures are based on land area measurements as reported in earlier censuses]
Census date
X Not applicable. 1Excludes Alaska and Hawaii. 2Revised to include adjustments for underenumeration in southern states; unrevised number is 38,558,371 (13.0 per square mile). 3Figures corrected after 1970 final reports were issued.
4Total population count has been revised since the 1980 census publications. Numbers by age, race, Hispanic origin, and sex have
not been corrected. 5The April 1, 1990, census count includes count question resolution corrections processed through
December 1997, and does not include adjustments for census coverage errors. 6Data reflect corrections made after publication
of the results.7Comprises Great Lakes, inland, and coastal water. Data for prior years cover inland water only. For further
explanation, see Table 380.
Source: U.S. Census Bureau,1990 Census of Population and Housing, Population and Housing Unit Counts(CPH-2); 1990 Census of Population and Housing Listing (1990 CPH-L-157); and unpublished data.
No. 2. Population: 1960 to 1999
[In thousands, except percent (180,671 represents 180,671,000). Estimates as ofJuly 1. Total population includes Armed Forces abroad; civilian population excludes Armed Forces. For basis of estimates, see text of this section]
Year
Source: U.S. Census Bureau,Current Population Reports, P25-802 and P25-1095; and ‘‘Monthly estimates of the United States population: April 1, 1980, to July 1, 1999; with short-term projections to April 1, 2000’’; published: 24 May 2000; <http://www.census.gov/population/estimates/nation/intfile1-1.txt>.
Population
7
No. 3. Resident Population Projections: 2000 to 2100
[In thousands (275,306 represents 275,306,000). As ofJuly 1. The projections are based on assumptions about future childbearing, mortality, and migration. The level of childbearing among women for the middle series is assumed to remain close to present levels, with differences by race and Hispanic origin diminishing over time. Mortality is assumed to decline gradually with less variation by race and Hispanic origin than at present. International migration is assumed to vary over time and decrease generally relative to the size of the population. Assumptions for the lowest and highest series are summarized in‘‘Methodology and Assumptions for the Population Projections of the United States: 1999 to 2100, Working Paper #38’’]
Year
Middle
series1 seriesLowest2 Highestseries3 Zero
series1 seriesLowest2 Highestseries3 Zero 1Total fertility rate in 2050 = 2,219; life expectancy in 2050 = 83.9 years; and annual net immigration in 2050 = 984,000. These are middle level assumptions. For explanation of total fertility rate; see headnote, Table 82. 2Total fertility rate in 2050 = 1,800; life expectancy in 2050 = 82.2 years; and annual net immigration in 2050 = 169,000. These are lowest level assumptions. 3Total fertility rate in 2050 = 2,647; life expectancy in 2050 = 86.1 years; and annual net immigration in 2050 = 2,812,000. These are highest level assumptions. 4Middle level assumptions for fertility and mortality; zero level assumption for international migration. Source: U.S. Census Bureau,‘‘Annual Projections of the Total Resident Population as of July 1: Middle, Lowest, Highest, and Zero International Migration Series, 2000 to 2100’’; published: 14 February 2000; <http://www.census.gov/population/projections/nation/ summary/np-t1.txt>.
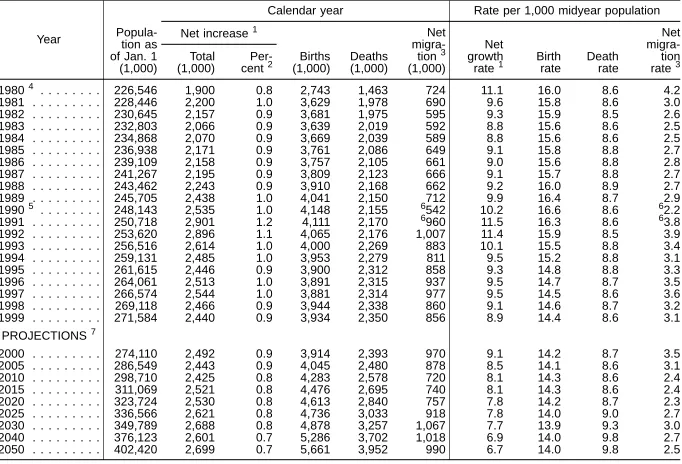
No. 4. Components of Population Change, 1980 to 1999, and Projections,
2000 to 2050
[226,546 represents 226,546,000. Resident population. The estimates prior to 1990 are consistent with the original 1990 census count of 248,709,873. Starting with 1990, estimates reflect the revised April 1, 1990, estimates base count of 248,790,925 which includes count resolution corrections processed through August 1997. It generally does not include adjustments for census coverage errors. However, it includes adjustments estimated for the 1995 Test Census in various localities in California, New Jersey, and Louisiana, and the 1998 census dress rehearsals in localities in California and Wisconsin. These adjustments amounted to a total of 81,052 persons]
Prior to April 1, 1990, includes‘‘error of closure’’(the amount necessary to make the components of change add to the net change between censuses), for which figures are not shown separately. 2Percent of population at beginning of period. 3Covers net international migration and movement of Armed Forces, federally affiliated civilian citizens, and their dependents. 4Data are for period April 1 to December 31. 5Net change for 1990 excludes‘‘error of closure’’for the 3 months prior to the April 1 census date. Therefore, it may not equal the difference between the populations at the beginning of 1990 and 1991. 6Data reflect movement of Armed Forces due to the Gulf War. 7Based on middle series of assumptions. See footnote 1, Table 3.
Source: U.S. Census Bureau,Current Population Reports, P25-1095 and unpublished data; and‘‘Population Projections of the Total Resident Population by Quarter: Middle Series, April 1, 1999, to January 1, 2101’’; published 13 January 2000; <http://www.census.gov/population/projections/nation/summary/np-t2.txt>; and‘‘Components of Change for the Total Resident Population: Middle Series, 1999 to 2100;’’published 13 January 2000; <http://www.census.gov/population/projections/nation/summary/ np-t6-a.txt> and <http://www.census.gov/population/projections/nation/summary/np-t6-b.txt>.
8
Population
No. 5. Immigration: 1901 to 1998
[In thousands, except rate (8,795 represents 8,795,000). For fiscal years ending in year shown; see text, Section 9, State and Local Government. For definition of immigrants, see text of this section. Data represent immigrants admitted. Rates based on Cen-sus Bureau estimates as of July 1 for resident population through 1929 and for total population thereafter (excluding Alaska and Hawaii prior to 1959)]
Period Number Rate1 Year Number Rate1
1901 to 1910 . . . 8,795 10.4 1980 . . . 531 2.3 1911 to 1920 . . . 5,736 5.7 1990 . . . 1,536 6.1 1921 to 1930 . . . 4,107 3.5 1991 . . . 1,827 7.2 1931 to 1940 . . . 528 0.4 1992 . . . 974 3.8 1941 to 1950 . . . 1,035 0.7 1993 . . . 904 3.5 1951 to 1960 . . . 2,515 1.5 1994 . . . 804 3.1 1961 to 1970 . . . 3,322 1.7 1995 . . . 720 2.7 1971 to 1980 . . . 4,493 2.1 1996 . . . 916 3.4 1981 to 1990 . . . 7,338 3.1 1997 . . . 798 3.0 1991 to 1998 . . . 7,605 3.6 1998 . . . 660 2.4 1Annual rate per 1,000 U.S. population. Rate computed by dividing sum of annual immigration totals by sum of annual U.S. population totals for same number of years.
Source: U.S. Immigration and Naturalization Service,Statistical Yearbook, annual.
No. 6. Immigrants Admitted by Class of Admission: 1990 to 1998
[For fiscal year ending September 30. For definition of immigrants, see text of this section]
Class of admission 1990 1994 1995 1996 1997 1998 Immigrants, total . . . 1,536,483 804,416 720,461 915,900 798,378 660,477
New arrivals . . . 435,729 490,429 380,291 421,405 380,719 357,037 Adjustments . . . 1,100,754 313,987 340,170 494,495 417,659 303,440 Preference immigrants, total . . . 272,742 335,252 323,458 411,673 303,938 268,997 Family-sponsored immigrants, total . . . 214,550 211,961 238,122 294,174 213,331 191,480
Unmarried sons/daughters of U.S.
citizens and their children. . . 15,861 13,181 15,182 20,909 22,536 17,717 Spouses, unmarried sons/daughters of
alien residents, and their children . . . 107,686 115,000 144,535 182,834 113,681 88,488 Married sons/daughters of U.S. citizens1. . . . 26,751 22,191 20,876 25,452 21,943 22,257 Brothers or sisters of U.S. citizens1. . . . 64,252 61,589 57,529 64,979 55,171 63,018 Employment-based immigrants, total . . . 58,192 123,291 85,336 117,499 90,607 77,517 Priority workers1. . . . (X) 21,053 17,339 27,501 21,810 21,408 Professionals with advanced degrees1. . . . (X) 14,432 10,475 18,462 17,059 14,384 Skilled workers, professionals, unskilled
workers1. . . . (X) 76,956 50,245 62,756 42,596 34,317 Special immigrants1. . . 4,463 10,406 6,737 7,844 7,781 6,584 Employment creation1. . . (X) 444 540 936 1,361 824 Professional or highly skilled immigrants1 2. . . . 26,546 (X) (X) (X) (X) (X) Needed skilled or unskilled workers1 2 . . . 27,183 (X) (X) (X) (X) (X) Immediate relatives . . . 234,090 251,647 222,254 302,090 322,440 284,270 Spouses of U.S. citizens . . . 125,426 145,247 123,238 169,760 170,263 151,172 Children of U.S. citizens . . . 46,065 48,147 48,740 63,971 76,631 70,472 Orphans . . . 7,088 8,200 9,384 11,316 12,596 14,867 Parents of U.S. citizens . . . 60,189 56,370 48,382 66,699 74,114 61,724 Children born abroad to alien residents . . . 2,410 1,883 1,894 1,660 1,432 902 Refugees and asylees . . . 97,364 121,434 114,664 128,565 112,158 54,645 Refugee adjustments . . . 92,427 115,451 106,827 118,528 102,052 44,645 Asylee adjustments . . . 4,937 5,983 7,837 10,037 10,106 10,000 Other immigrants . . . 932,287 96,083 60,085 73,572 59,842 52,565 Diversity Programs3. . . . 29,161 41,056 47,245 58,790 49,374 45,499 Amerasians (P.L. 100-202)4. . . . 13,059 2,822 939 956 738 346 Immigration Reform and Control Act of 1986
legalization adjustments . . . 880,372 6,022 4,267 4,635 2,548 955 Legalization dependents5. . . . (X) 34,074 277 184 64 21 Other . . . 9,695 12,109 7,357 9,007 7,118 5,744 X Not applicable. 1Includes spouses and children. 2Category was eliminated in 1992 by the Immigration Act of 1990. 3
Includes categories of immigrants admitted under three laws intended to diversify immigration: P.L. 99-603, P.L. 100-658, and P.L. 101-649. 4Under Public Law 100-202, Amerasians are aliens born in Vietnam between January 1, 1962, and January 1, 1976, who were fathered by U.S. citizens. 5Spouses and children of persons granted permanent resident status under provisions of the Immigration Reform and Control Act of 1986.
Source: U.S. Immigration and Naturalization Service,Statistical Yearbook,annual.
Population
9
No. 7. Immigrants by Country of Birth: 1981 to 1998
[In thousands (7,338.1 represents 7,338,100). For fiscal years ending Sept. 30.For definition of immigrants, see text of this section] Soviet Union, former2. 84.0 339.9 49.1 30.2 Armenia . . . (NA) 320.8 2.1 1.1
NA Not available. 1Includes countries not shown separately. 2Includes other republics and unknown republics, not shown separately. 3Covers years 1992-1996.4Data for Taiwan included with China. 5Includes unknown countries.
Source: U.S. Immigration and Naturalization Service,Statistical Yearbook,annual; and releases.
No. 8. Immigrants Admitted as Permanent Residents Under Refugee Acts
by Country of Birth: 1981 to 1998
[For fiscal years ending September 30]
Country of birth 1981-90,
North America1. . 121,840 111,744 32,898 16,372
Cuba. . . 113,367 76,370 30,377 14,915 El Salvador . . . . 1,383 3,623 198 129 Haiti . . . (NA) 7,309 1,074 537 Nicaragua . . . 5,590 21,252 666 316
South America1. . 1,976 3,025 890 712
Peru . . . (NA) 1,285 489 338
NA Not available. 1Includes other countries, not shown separately. 2Includes other republics and unknown republics, not shown separately. 3Covers years 1992-1996. 4Includes Taiwan.
Source: U.S. Immigration and Naturalization Service,Statistical Yearbook,annual; and releases.
10
Population
No. 9. Immigrants Admitted by State and Leading Country of Birth: 1998
[For year ending September 30.For definition of immigrants, see text of this section]
State and other area
Total1 Mexico China India Philip-pines
Domini-can
Republic Vietnam Cuba Jamaica
Total . . . . 660,477 131,575 36,884 36,482 34,466 20,387 17,649 17,375 15,146
Alabama . . . 1,608 178 117 165 85 2 51 29 15 Alaska . . . 1,008 105 56 14 254 32 13 1 1 Arizona. . . 6,211 3,209 253 230 220 7 96 7 7 Arkansas . . . 914 305 46 59 42 2 38 3 -California . . . 170,126 62,113 12,582 7,177 16,202 72 6,519 289 186
Colorado. . . 6,513 2,293 317 218 143 10 287 27 6 Connecticut . . . 7,780 272 304 478 181 186 145 43 856 Delaware . . . 1,063 135 79 141 26 11 23 8 28 District of Columbia . . . . 2,377 42 112 36 80 46 111 4 83 Florida . . . 59,965 2,788 628 1,079 837 1,483 437 14,265 4,795
Georgia . . . 10,445 1,630 435 882 163 44 592 110 211 Hawaii . . . 5,465 75 482 16 3,140 2 101 - 3 Idaho . . . 1,504 984 63 29 25 4 37 1 -Illinois . . . 33,163 10,127 1,357 3,446 1,350 67 306 98 131 Indiana . . . 3,981 904 208 375 117 9 78 20 25
Iowa . . . 1,655 366 78 129 56 4 218 1 1 Kansas. . . 3,184 1,357 91 184 78 4 279 8 6 Kentucky . . . 2,017 141 72 119 50 5 195 243 7 Louisiana . . . 2,193 132 94 129 70 32 201 83 4 Maine. . . 709 9 80 41 9 5 23 8 9
Maryland . . . 15,561 364 697 1,108 625 137 251 44 545 Massachusetts. . . 15,869 105 1,355 958 179 1,138 443 40 340 Michigan. . . 13,943 1,055 557 1,484 330 72 206 124 93 Minnesota . . . 6,981 536 270 455 156 10 328 14 34 Mississippi . . . 701 56 69 94 64 1 31 27 4
Missouri . . . 3,588 491 197 271 139 7 184 23 16 Montana . . . 299 21 42 8 17 - 6 - -Nebraska . . . 1,267 542 52 88 36 2 71 3 1 Nevada . . . 6,106 2,881 231 145 712 14 95 195 9 New Hampshire . . . 1,010 28 73 91 56 28 39 3 8
New Jersey . . . 35,091 772 1,318 4,284 1,648 2,478 271 437 1,037 New Mexico . . . 2,199 1,359 76 116 32 1 43 59 4 New York . . . 96,559 1,616 8,850 4,017 1,490 10,719 646 322 5,874 North Carolina . . . 6,415 880 318 618 151 33 310 78 40 North Dakota . . . 472 12 9 41 9 2 16 18
-Ohio . . . 7,697 311 493 900 221 32 263 18 51 Oklahoma . . . 2,273 812 96 204 60 2 131 3 5 Oregon. . . 5,909 1,879 411 239 165 1 365 81 8 Pennsylvania . . . 11,942 625 938 1,127 265 245 586 78 349 Rhode Island . . . 1,976 27 73 62 38 284 15 1 6 South Carolina. . . 2,125 259 96 182 96 2 63 4 11 South Dakota . . . 356 36 13 8 19 - 6 13 1 Tennessee . . . 2,806 300 148 291 60 9 118 43 19 Texas . . . 44,428 22,956 1,159 2,663 851 97 1,576 218 108 Utah . . . 3,360 1,035 120 101 72 5 133 17 6
Vermont . . . 513 9 30 53 6 4 13 1 2 Virginia. . . 15,686 541 523 910 921 31 686 60 117 Washington . . . 16,920 4,129 843 599 1,159 5 940 47 27 West Virginia . . . 375 10 23 65 20 - 2 5 4 Wisconsin . . . 3,724 680 234 314 106 5 50 4 44 Wyoming . . . 159 42 10 15 7 - 2 -
-Guam . . . 1,835 1 54 10 1,507 - 9 - -Northern Mariana
Islands . . . 103 - 10 1 76 - - - -Puerto Rico . . . 3,251 39 36 1 1 2,647 1 147 -Virgin Islands. . . 979 - 5 12 6 349 - - 9
Armed Services posts . . . 88 1 - - 38 - - -
-Other . . . 6,030 - 1 - - - -- Represents zero. 1Includes other countries, not shown separately.
Source: U.S. Immigration and Naturalization Service,Statistical Yearbook,annual.
Population
11
No. 10. Resident Population—Selected Characteristics, 1790 to 1999,
and Projections, 2000 to 2050
[In thousands (3,172 represents 3,172,000)]
Date
Sex Race
Hispanic origin1 Male Female White Black
Other
Total
American Indian, Eskimo, Aleut
Asian, Pacific Islander
1790 (Aug. 2)2. . . . (NA) (NA) 3,172 757 (NA) (NA) (NA) (NA) 1800 (Aug. 4)2. . . . (NA) (NA) 4,306 1,002 (NA) (NA) (NA) (NA) 1850 (June 1)2. . . . 11,838 11,354 19,553 3,639 (NA) (NA) (NA) (NA) 1900 (June 1)2. . . . 38,816 37,178 66,809 8,834 351 (NA) (NA) (NA) 1910 (Apr. 15)2. . . . 47,332 44,640 81,732 9,828 413 (NA) (NA) (NA) 1920 (Jan. 1)2. . . . 53,900 51,810 94,821 10,463 427 (NA) (NA) (NA) 1930 (Apr. 1)2. . . . . 62,137 60,638 110,287 11,891 597 (NA) (NA) (NA) 1940 (Apr. 1)2. . . . . 66,062 65,608 118,215 12,866 589 (NA) (NA) (NA) 1950 (Apr. 1)2. . . . . 74,833 75,864 134,942 15,042 713 (NA) (NA) (NA) 1950 (Apr. 1) . . . 75,187 76,139 135,150 15,045 1,131 (NA) (NA) (NA) 1960 (Apr. 1) . . . 88,331 90,992 158,832 18,872 1,620 (NA) (NA) (NA) 1970 (Apr. 1)3. . . . . 98,926 104,309 178,098 22,581 2,557 (NA) (NA) (NA) 1980 (Apr. 1)4 5. . . . 110,053 116,493 194,713 26,683 5,150 1,420 3,729 14,609 1990 (Apr. 1)4 6. . . . 121,284 127,507 208,741 30,517 9,534 2,067 7,467 22,379 1991 (July 1)7. . . . . 122,956 129,197 210,975 31,137 10,041 2,112 7,929 23,391 1992 (July 1)7. . . . . 124,424 130,606 212,874 31,683 10,473 2,149 8,324 24,283 1993 (July 1)7. . . . . 125,788 131,995 214,691 32,195 10,897 2,187 8,710 25,222 1994 (July 1)7. . . . . 127,049 133,278 216,379 32,672 11,276 2,222 9,054 26,160 1995 (July 1)7. . . . . 128,294 134,510 218,023 33,116 11,664 2,256 9,408 27,107 1996 (July 1)7. . . . . 129,504 135,724 219,636 33,537 12,055 2,290 9,765 28,099 1997 (July 1)7. . . . . 130,783 137,001 221,333 33,989 12,461 2,326 10,135 29,182 1998 (July 1)7. . . . . 132,030 138,218 222,980 34,427 12,840 2,361 10,479 30,252 1999 (July 1)7. . . . . 133,277 139,414 224,611 34,862 13,217 2,397 10,820 31,337 2000 (July 1)8. . . . . 134,554 140,752 226,266 35,332 13,708 2,433 11,275 32,479 2005 (July 1)8. . . . . 140,698 147,018 234,221 37,619 15,874 2,625 13,251 38,189 2010 (July 1)8. . . . . 146,679 153,183 241,770 39,982 18,109 2,821 15,289 43,688 2015 (July 1)8. . . . . 152,744 159,524 249,468 42,385 20,415 3,016 17,399 49,255 2020 (July 1)8. . . . . 158,856 166,071 257,394 44,736 22,796 3,207 19,589 55,156 2025 (July 1)8. . . . . 165,009 172,806 265,306 47,089 25,419 3,399 22,020 61,433 2050 (July 1)8. . . . . 197,047 206,640 302,453 59,239 41,994 4,405 37,589 98,229 NA Not available. 1Persons of Hispanic origin may be of any race. 2Excludes Alaska and Hawaii. 3The revised 1970 resident population count is 203,302,031; which incorporates changes due to errors found after tabulations were completed. The race and sex data shown here reflect the official 1970 census count. 4The race data shown have been modified; see text of this section for explanation. 5See footnote 4, Table 1. 6The April 1, 1990, estimates base (248,790,925) includes count resolution corrections processed through August 1997. It generally does not include adjustments for census coverage errors. However, it includes adjustments estimated for the 1995 Test Census in various localities in California, New Jersey, and Louisiana; and the 1999 census dress rehearsals in localities in California and Wisconsin. These adjustments amounted to a total of 81,052 persons. 7Estimated. 8Middle series projection; for assumptions, see Table 3.
No. 11. Resident Population Characteristics—Percent Distribution and Median
Age, 1850 to 1999, and Projections, 2000 to 2050
[In percent, except as indicated. For definition of median, see Guide to Tabular Presentation]
Date
Sex Race
Hispanic origin1
Median age (years) Male Female White Black
American Indian, Eskimo, Aleut
Asian and Pacific Islander
1850 (June 1)2. . . . 51.0 49.0 84.3 15.7 (NA) (NA) (NA) 18.9 1900 (June 1)2. . . . 51.1 48.9 87.9 11.6 (NA) (NA) (NA) 22.9 1910 (Apr. 15)2. . . . 51.5 48.5 88.9 10.7 (NA) (NA) (NA) 24.1 1920 (Jan. 1)2. . . . 51.0 49.0 89.7 9.9 (NA) (NA) (NA) 25.3 1930 (Apr. 1)2. . . . . 50.6 49.4 89.8 9.7 (NA) (NA) (NA) 26.4 1940 (Apr. 1)2. . . . . 50.2 49.8 89.8 9.8 (NA) (NA) (NA) 29.0 1950 (Apr. 1) . . . 49.7 50.3 89.3 9.9 (NA) (NA) (NA) 30.2 1960 (Apr. 1) . . . 49.3 50.7 88.6 10.5 (NA) (NA) (NA) 29.5 1970 (Apr. 1) . . . 48.7 51.3 87.6 11.1 (NA) (NA) (NA) 28.0 1980 (Apr. 1)3 4. . . . 48.6 51.4 85.9 11.8 0.6 1.6 6.4 30.0 1990 (Apr. 1)3 5. . . . 48.7 51.3 83.9 12.3 0.8 3.0 9.0 32.8 1995 (July 1)6. . . . . 48.8 51.2 83.0 12.6 0.9 3.6 10.3 34.3 1999 (July 1)6. . . . . 48.9 51.1 82.4 12.8 0.9 4.0 11.5 35.5
2000 (July 1)7. . . . . 48.9 51.1 82.2 12.8 0.9 4.1 11.8 35.8 2025 (July 1)7. . . . . 48.8 51.2 78.5 13.9 1.0 6.5 18.2 38.5 2050 (July 1)7. . . . . 48.8 51.2 74.9 14.7 1.1 9.3 24.3 38.8 NA Not available. 1Persons of Hispanic origin may be of any race. 2Excludes Alaska and Hawaii. 3The race data shown have been modified; see text of this section for explanation. 4See footnote 4, Table 1. 5See footnote 6, Table 10. 6Estimated. 7Middle series projection; for assumptions, see Table 3.
Source of Tables 10 and 11: U.S. Census Bureau,U.S. Census of Population: 1940, Vol. II, Part 1, and Vol. IV, Part 1;1950, Vol. II, Part 1;1960, Vol. I, Part 1;1970, Vol. I, Part B; Current Population Reports, P25-1095;‘‘Resident Population Estimates of the United States by Sex, Race, and Hispanic Origin: April 1, 1990, to July 1, 1999’’; published 24 May 2000; <http://www.census.gov/population/estimates/nation/intfile3-1.txt>; and‘‘National Population Projections-Summary Tables’’; pub-lished 13 January 2000; <http://www.census.gov/population/www/projections/natsum-T3.html>.
12
Population
No. 12. Resident Population by Age and Sex: 1980 to 1999
[In thousands, except as indicated (226,546 represents 226,546,000).1980and1990data are enumerated population as ofApril 1; data forother yearsare estimated population as ofJuly 1. Excludes Armed Forces overseas. For definition of median, see Guide to Tabular Presentation]
Year and sex Total,all years
Under 5 years
5-9 years
10-14 years
15-19 years
20-24 years
25-29 years
30-34 years
35-39 years
40-44 years
45-49 years
50-54 years
55-59 years
60-64 years
65-74 years
75-84 years
85 years and over
5-13 years
14-17 years
18-24 years
Median age (yr.)
1980, total1. . . 226,546 16,348 16,700 18,242 21,168 21,319 19,521 17,561 13,965 11,669 11,090 11,710 11,615 10,088 15,581 7,729 2,240 31,159 16,247 30,022 30.0
Male . . . 110,053 8,362 8,539 9,316 10,755 10,663 9,705 8,677 6,862 5,708 5,388 5,621 5,482 4,670 6,757 2,867 682 15,923 8,298 15,054 28.8 Female . . . 116,493 7,986 8,161 8,926 10,413 10,655 9,816 8,884 7,104 5,961 5,702 6,089 6,133 5,418 8,824 4,862 1,559 15,237 7,950 14,969 31.3
1981, total . . . . 229,466 16,893 16,060 18,300 20,541 21,663 20,169 18,731 14,366 12,028 10,985 11,595 11,554 10,359 15,890 7,982 2,349 30,711 15,609 30,245 30.3 1982, total . . . . 231,664 17,228 15,958 18,145 19,962 21,682 20,704 18,714 15,566 12,464 11,011 11,414 11,463 10,567 16,147 8,203 2,437 30,528 15,057 30,162 30.5 1983, total . . . . 233,792 17,547 16,053 17,869 19,388 21,632 21,141 19,067 16,117 13,150 11,201 11,155 11,457 10,655 16,414 8,429 2,518 30,279 14,740 29,922 30.8 1984, total . . . . 235,825 17,695 16,338 17,450 18,931 21,529 21,459 19,503 16,867 13,636 11,429 10,957 11,352 10,803 16,626 8,656 2,595 30,062 14,725 29,461 31.1 1985, total . . . . 237,924 17,842 16,665 17,027 18,727 21,265 21,671 20,025 17,604 14,087 11,606 10,854 11,229 10,906 16,858 8,890 2,667 29,893 14,888 28,902 31.4 1986, total . . . . 240,133 17,963 17,098 16,474 18,813 20,744 21,893 20,479 18,611 14,398 11,878 10,781 11,135 10,859 17,137 9,129 2,742 30,078 14,824 28,227 31.7 1987, total . . . . 242,289 18,052 17,430 16,377 18,698 20,192 21,857 20,984 18,619 15,608 12,294 10,802 10,968 10,783 17,426 9,376 2,823 30,502 14,502 27,694 32.0 1988, total . . . . 244,499 18,195 17,759 16,496 18,496 19,655 21,739 21,391 18,993 16,188 12,954 10,995 10,722 10,791 17,626 9,612 2,885 31,028 14,023 27,356 32.3 1989, total . . . . 246,819 18,508 17,917 16,797 18,133 19,258 21,560 21,676 19,455 16,960 13,421 11,212 10,534 10,707 17,864 9,850 2,968 31,413 13,536 27,156 32.6
1990, total2. . . 248,791 18,765 18,042 17,067 17,893 19,143 21,336 21,838 19,851 17,593 13,747 11,315 10,489 10,627 18,048 10,014 3,022 31,839 13,345 26,961 32.8
Male . . . 121,284 9,603 9,236 8,742 9,178 9,749 10,708 10,866 9,837 8,679 6,741 5,494 5,009 4,947 7,908 3,745 842 16,301 6,860 13,744 31.6 Female . . . 127,507 9,162 8,806 8,325 8,714 9,394 10,629 10,973 10,014 8,914 7,006 5,821 5,480 5,679 10,140 6,268 2,180 15,538 6,485 13,217 34.0
1991, total . . . . 252,153 19,189 18,205 17,679 17,235 19,156 20,713 22,157 20,530 18,761 14,099 11,648 10,422 10,581 18,271 10,319 3,189 32,470 13,452 26,352 33.1 1992, total . . . . 255,030 19,492 18,293 18,102 17,180 19,047 20,140 22,240 21,098 18,807 15,359 12,055 10,483 10,438 18,442 10,538 3,315 32,943 13,703 25,976 33.4 1993, total . . . . 257,783 19,674 18,442 18,508 17,375 18,785 19,570 22,227 21,605 19,209 15,931 12,728 10,678 10,236 18,629 10,738 3,446 33,382 13,989 25,740 33.7 1994, total . . . . 260,327 19,700 18,752 18,716 17,743 18,389 19,107 22,133 21,978 19,716 16,678 13,195 10,931 10,077 18,703 10,946 3,562 33,713 14,492 25,397 34.1 1995, total . . . . 262,803 19,532 19,096 18,853 18,203 17,982 18,905 21,825 22,296 20,259 17,458 13,642 11,086 10,046 18,757 11,178 3,685 34,195 14,828 25,112 34.3 1996, total . . . . 265,229 19,292 19,439 19,004 18,708 17,508 18,933 21,313 22,553 20,812 18,430 13,928 11,356 9,997 18,690 11,466 3,800 34,604 15,213 24,843 34.7 1997, total . . . . 267,784 19,099 19,754 19,097 19,146 17,488 18,820 20,739 22,636 21,378 18,467 15,158 11,755 10,061 18,528 11,744 3,913 35,005 15,499 24,980 34.9 1998, total . . . . 270,248 18,989 19,929 19,242 19,542 17,678 18,575 20,168 22,615 21,883 18,853 15,722 12,403 10,263 18,390 11,947 4,050 35,396 15,518 25,476 35.2
1999, total . . . . 272,691 18,942 19,947 19,548 19,748 18,026 18,209 19,727 22,545 22,268 19,356 16,446 12,875 10,514 18,218 12,147 4,175 35,603 15,654 26,011 35.5
Male . . . 133,277 9,683 10,208 10,012 10,151 9,183 9,055 9,771 11,216 11,039 9,501 7,998 6,183 4,968 8,199 4,871 1,241 18,223 8,055 13,276 34.3 Female . . . 139,414 9,259 9,739 9,537 9,597 8,843 9,154 9,956 11,329 11,229 9,856 8,448 6,693 5,546 10,020 7,275 2,936 17,379 7,600 12,736 36.6 Percent:
19801. . . 100.0 7.2 7.4 8.1 9.3 9.4 8.6 7.8 6.2 5.2 4.9 5.2 5.1 4.5 6.9 3.4 1.0 13.8 7.2 13.3 (X) 19902. . . 100.0 7.5 7.3 6.9 7.2 7.7 8.6 8.8 8.0 7.1 5.5 4.5 4.2 4.3 7.3 4.0 1.2 12.8 5.4 10.8 (X)
1999. . . . 100.0 6.9 7.3 7.2 7.2 6.6 6.7 7.2 8.3 8.2 7.1 6.0 4.7 3.9 6.7 4.5 1.5 13.1 5.7 9.5 (X)
Male . . . 100.0 7.3 7.7 7.5 7.6 6.9 6.8 7.3 8.4 8.3 7.1 6.0 4.6 3.7 6.2 3.7 0.9 13.7 6.0 10.0 (X) Female . . . 100.0 6.6 7.0 6.8 6.9 6.3 6.6 7.1 8.1 8.1 7.1 6.1 4.8 4.0 7.2 5.2 2.1 12.5 5.5 9.1 (X) X Not applicable. 1Total population count has been revised since the 1980 census publications. Numbers by age, race, Hispanic origin, and sex have not been corrected. 2The data shown have been modified from the official 1990 census counts. See text of this section for explanation. The April 1, 1990, estimates base (248,790,925) includes count resolution corrections processed through August 1997. It generally does not include adjustments for census coverage errors. However, it includes adjustments estimated for the 1995 Test Census in various localities in California, New Jersey, and Louisiana; and the 1998 census dress rehearsals in localities in California and Wisconsin, These adjustments amounted to a total of 81,052 persons.
Source: U.S. Census Bureau,Current Population Reports, P25-1095; and‘‘Resident Population Estimates of the United States by Age and Sex: April 1, 1990, to July 1, 1999; with short-term projections to April 1, 2000’’; published 24 May 2000; <http://www.census.gov/population/estimates/nation/intfile2-1.txt>.
Population
13
U.S.
Census
Bureau,
Statistical
Abstract
of
the
United
States:
No. 13. Resident Population by Sex and Age: 1999
[In thousands, except as indicated (272,691 represents 272,691,000). As ofJuly 1. For derivation of estimates, see text of this section]
Source: U.S. Census Bureau,‘‘Monthly Postcensal Resident Population, by single year of age, sex, race, and Hispanic origin’’; published June 2000; <http://www.census.gov/population/www/estimates/nat90s1.html>.
14
Population
No. 14. Resident Population Projections by Sex and Age: 2000 to 2050
[In thousands, except as indicated (275,306 represents 275,306,000). As ofJuly. Data shown are for middle series; for assumptions, see Table 3]
Age 2000 2005 2010
2015 2020 2025 2030 2035 2040 2045 2050
Percent distribution
Total Male Female Total Male Female Total Male Female 2000 2005 2010
Total . . . 275,306 134,554 140,752 287,716 140,698 147,018 299,862 146,679 153,183 312,268 324,927 337,815 351,070 364,319 377,350 390,398 403,687 100.0 100.0 100.0
Under 5 years . . . 18,865 9,639 9,227 19,212 9,815 9,397 20,099 10,272 9,827 21,179 21,951 22,551 23,183 24,016 25,014 26,013 26,914 6.9 6.7 6.7 5 to 9 years. . . 19,781 10,122 9,659 19,122 9,774 9,348 19,438 9,936 9,502 20,321 21,403 22,197 22,845 23,509 24,358 25,364 26,366 7.2 6.6 6.6 10 to 14 years . . . 19,908 10,196 9,712 20,634 10,564 10,069 19,908 10,183 9,724 20,229 21,146 22,289 23,166 23,870 24,571 25,459 26,503 7.2 7.2 6.6 15 to 19 years . . . 19,897 10,227 9,670 20,990 10,788 10,202 21,668 11,132 10,536 20,892 21,224 22,203 23,449 24,380 25,100 25,813 26,715 7.2 7.3 6.6 20 to 24 years . . . 18,518 9,433 9,085 20,159 10,269 9,889 21,151 10,776 10,375 21,748 21,020 21,411 22,481 23,748 24,660 25,360 26,054 6.7 7.0 6.3 25 to 29 years . . . 17,861 8,876 8,984 18,351 9,144 9,207 19,849 9,901 9,948 20,765 21,384 20,761 21,257 22,333 23,552 24,430 25,104 6.5 6.4 6.1 30 to 34 years . . . 19,580 9,682 9,898 18,582 9,146 9,436 19,002 9,385 9,617 20,484 21,410 22,111 21,615 22,174 23,254 24,475 25,354 7.1 6.5 6.5 35 to 39 years . . . 22,276 11,071 11,205 20,082 9,927 10,155 19,039 9,380 9,659 19,442 20,938 21,926 22,728 22,281 22,845 23,928 25,152 8.1 7.0 6.5 40 to 44 years . . . 22,618 11,218 11,400 22,634 11,222 11,412 20,404 10,069 10,334 19,346 19,773 21,308 22,374 23,222 22,783 23,349 24,436 8.2 7.9 6.3 45 to 49 years . . . 19,901 9,776 10,125 22,230 10,965 11,264 22,227 10,967 11,260 20,057 19,034 19,473 21,031 22,112 22,953 22,522 23,072 7.2 7.7 5.8 50 to 54 years . . . 17,265 8,398 8,867 19,661 9,578 10,082 21,934 10,739 11,195 21,929 19,804 18,818 19,318 20,884 21,966 22,798 22,373 6.3 6.8 5.6 55 to 59 years . . . 13,324 6,397 6,927 16,842 8,101 8,741 19,177 9,248 9,929 21,400 21,412 19,366 18,452 18,989 20,543 21,622 22,445 4.8 5.9 5.7 60 to 64 years . . . 10,677 5,046 5,631 12,848 6,086 6,762 16,252 7,725 8,528 18,519 20,696 20,759 18,853 18,027 18,575 20,123 21,199 3.9 4.5 6.1 65 to 69 years . . . 9,436 4,334 5,102 10,086 4,661 5,425 12,159 5,640 6,520 15,410 17,598 19,717 19,844 18,104 17,349 17,962 19,477 3.4 3.5 5.8 70 to 74 years . . . 8,753 3,876 4,877 8,375 3,757 4,618 8,995 4,066 4,929 10,897 13,864 15,886 17,878 18,068 16,555 15,912 16,537 3.2 2.9 4.7 75 to 79 years . . . 7,422 3,103 4,319 7,429 3,172 4,257 7,175 3,110 4,065 7,772 9,484 12,159 14,029 15,895 16,170 14,908 14,407 2.7 2.6 3.6 80 to 84 years . . . 4,913 1,866 3,047 5,514 2,157 3,356 5,600 2,247 3,353 5,484 6,024 7,439 9,638 11,220 12,820 13,140 12,225 1.8 1.9 2.2 85 to 89 years . . . 2,705 883 1,821 3,028 1,046 1,982 3,476 1,242 2,234 3,612 3,611 4,045 5,077 6,678 7,884 9,123 9,463 1.0 1.1 1.2 90 to 94 years . . . 1,179 319 861 1,402 404 998 1,625 497 1,128 1,930 2,074 2,135 2,457 3,155 4,243 5,115 6,030 0.4 0.5 0.6 95 to 99 years . . . 364 81 283 442 104 338 556 139 417 678 844 948 1,015 1,213 1,606 2,226 2,764 0.1 0.2 0.3 100 years and over . 65 12 53 96 18 77 129 26 103 177 235 313 381 441 551 757 1,095 (Z) (Z) 0.1 5 to 13 years . . . 35,775 18,309 17,465 35,475 18,144 17,331 35,321 18,056 17,265 36,497 38,361 40,054 41,377 42,592 44,004 45,740 47,582 13.0 12.3 11.9 14 to 17 years . . . 15,734 8,096 7,637 16,931 8,709 8,222 16,681 8,583 8,098 16,437 16,839 17,741 18,653 19,325 19,881 20,477 21,252 5.7 5.9 5.3 18 to 24 years . . . 26,596 13,572 13,023 28,498 14,543 13,956 30,163 15,388 14,774 30,254 29,593 30,305 31,910 33,590 34,803 35,779 36,804 9.7 9.9 9.0 16 years and over . . 212,810 102,573 110,237 224,447 108,336 116,111 236,301 114,175 122,126 246,455 256,230 266,342 277,222 288,108 298,453 308,456 318,601 77.3 78.0 78.8 18 years and over . . 204,932 98,509 106,423 216,098 104,030 112,068 227,761 109,768 117,993 238,155 247,776 257,469 267,857 278,386 288,450 298,168 307,938 74.4 75.1 76.2 10 to 49 years . . . 160,558 80,479 80,079 163,661 82,026 81,635 163,247 81,794 81,453 162,961 165,929 171,482 178,100 184,120 189,717 195,335 202,390 58.3 56.9 50.8 16 to 64 years . . . 177,974 88,100 89,874 188,077 93,017 95,059 196,586 97,208 99,377 200,496 202,498 203,701 206,903 213,334 221,276 229,314 236,602 64.6 65.4 60.3 55 years and over . . 58,836 25,916 32,920 66,060 29,505 36,555 75,145 33,939 41,206 85,878 95,841 102,766 107,624 111,790 116,295 120,888 125,643 21.4 23.0 30.4 65 years and over . . 34,835 14,473 20,362 36,370 15,318 21,052 39,715 16,966 22,749 45,959 53,733 62,641 70,319 74,774 77,177 79,142 81,999 12.7 12.6 18.5 85 years and over . . 4,312 1,294 3,018 4,968 1,572 3,396 5,786 1,904 3,882 6,396 6,763 7,441 8,931 11,486 14,284 17,220 19,352 1.6 1.7 2.2 Median age (years). . 35.8 34.6 36.9 36.7 35.4 37.9 37.4 36.0 38.8 37.6 38.1 38.5 38.9 39.1 39.0 38.8 38.8 (X) (X) (X)
X Not applicable. Z Less than 0.05 percent.
Source: U.S. Census Bureau,‘‘National Population Projections-Summary Tables’’; published 13 January 2000; <http://www.census.gov/population/www/projections/natsum-T3.html>.
Population
15
U.S.
Census
Bureau,
Statistical
Abstract
of
the
United
States:
No. 15. Resident Population by Race, 1980 to 1999, and Projections,
2000 to 2050
[In thousands, except as indicated (226,546 represents 226,546,000). As ofJuly, except as indicated. These data are consis-tent with the 1980 and 1990 decennial enumerations and have been modified from the official census counts; see text of this sec-tion for explanasec-tion]
Year
Total White Black
American Indian, Eskimo, Aleut
Asian, Pacific Islander 1980 (April)1. . . . 226,546 194,713 26,683 1,420 3,729 1981 . . . 229,466 196,635 27,133 1,483 4,214 1982 . . . 231,664 198,037 27,508 1,537 4,581 1983 . . . 233,792 199,420 27,867 1,596 4,909 1984 . . . 235,825 200,708 28,212 1,656 5,249 1985 . . . 237,924 202,031 28,569 1,718 5,606
1986 . . . 240,133 203,430 28,942 1,783 5,978 1987 . . . 242,289 204,770 29,325 1,851 6,343 1988 . . . 244,499 206,129 29,723 1,923 6,724 1989 . . . 246,819 207,540 30,143 2,001 7,134 1990 (April)2. . . . 248,791 208,741 30,517 2,067 7,467
1991 . . . 252,153 210,975 31,137 2,112 7,929 1992 . . . 255,030 212,874 31,683 2,149 8,324 1993 . . . 257,783 214,691 32,195 2,187 8,710 1994 . . . 260,327 216,379 32,672 2,222 9,054 1995 . . . 262,803 218,023 33,116 2,256 9,408
1996 . . . 265,229 219,636 33,537 2,290 9,765 1997 . . . 267,784 221,333 33,989 2,326 10,135 1998 . . . 270,248 222,980 34,427 2,361 10,479 1999 . . . 272,691 224,611 34,862 2,397 10,820
PROJECTIONS3
2000 . . . 275,306 226,266 35,332 2,433 11,275 2005 . . . 287,716 234,221 37,619 2,625 13,251 2010 . . . 299,862 241,770 39,982 2,821 15,289 2015 . . . 312,268 249,468 42,385 3,016 17,399 2020 . . . 324,927 257,394 44,736 3,207 19,589 2025 . . . 337,815 265,306 47,089 3,399 22,020 2030 . . . 351,070 273,079 49,535 3,599 24,858 2040 . . . 377,350 287,787 54,462 4,006 31,095 2050 . . . 403,687 302,453 59,239 4,405 37,589 Percent distribution:
2000. . . 100.0 82.2 12.8 0.9 4.1 2005. . . 100.0 81.4 13.1 0.9 4.6 2010. . . 100.0 80.6 13.3 0.9 5.1 2015. . . 100.0 79.9 13.6 1.0 5.6 2020. . . 100.0 79.2 13.8 1.0 6.0 2025. . . 100.0 78.5 13.9 1.0 6.5 2030. . . 100.0 77.8 14.1 1.0 7.1 2040. . . 100.0 76.3 14.4 1.1 8.2 2050. . . 100.0 74.9 14.7 1.1 9.3
Percent change:
2000-2010 . . . 8.9 6.9 13.2 16.0 35.6 2010-2020 . . . 8.5 6.5 12.7 14.9 31.3 2020-2030 . . . 8.4 6.5 11.9 13.7 28.1 2030-2040 . . . 8.2 6.3 11.1 12.7 26.6 2040-2050 . . . 8.0 6.1 10.7 12.2 26.9 1See footnote 4, Table 1. 2The April 1, 1990, estimates base (248,790,925) includes count resolution corrections processed through August 1997. It generally does not include adjustments for census coverage errors. However, it includes adjustments estimated for the 1995 Test Census in various localities in California, New Jersey, and Louisiana; and the 1999 census dress rehearsals in localities in California and Wisconsin. These adjustments amounted to a total of 81,052 persons. 3Based on middle series of assumptions. See footnote 1, Table 3.
Source: U.S. Census Bureau,Current Population Reports, P25-1095;‘‘Annual Population Estimates by Sex, Race, and Hispanic Origin, selected years from 1990 to 2000’’; published 26 May 2000; <http://www.census.gov/population/www/estimates/ nation3.html>; and‘‘(NP-T4) Projections of the Total Resident Population by 5-year Age Groups, Race, and Hispanic Origin with Special Age Categories: Middle Series, 1999 to 2100’’; published 13 January 2000; <http://www.census.gov/population/www/ projections/natsum-T3.html>.
16
Population
No. 16. Resident Population by Hispanic-Origin Status, 1980 to 1999, and
Projections, 2000 to 2050
[In thousands, except as indicated (226,546 represents 226,546,000). As ofJuly, except as indicated. These data are consis-tent with the 1980 and 1990 decennial enumerations and have been modified from the official census counts; see text of this sec-tion for explanasec-tion]
Year
Total
Hispanic origin1
Not of Hispanic origin
White Black
American Indian, Eskimo, Aleut
Asian, Pacific Islander 1980 (April)2. . . . 226,546 14,609 180,906 26,142 1,326 3,563 1981 . . . 229,466 15,560 181,974 26,532 1,377 4,022 1982 . . . 231,664 16,240 182,782 26,856 1,420 4,367 1983 . . . 233,792 16,935 183,561 27,159 1,466 4,671 1984 . . . 235,825 17,640 184,243 27,444 1,512 4,986 1985 . . . 237,924 18,368 184,945 27,738 1,558 5,315
1986 . . . 240,133 19,154 185,678 28,040 1,606 5,655 1987 . . . 242,289 19,946 186,353 28,351 1,654 5,985 1988 . . . 244,499 20,786 187,012 28,669 1,703 6,329 1989 . . . 246,819 21,648 187,713 29,005 1,755 6,698 1990 (April)3. . . . 248,791 22,379 188,315 29,304 1,797 6,996
1991 . . . 252,153 23,391 189,634 29,858 1,831 7,439 1992 . . . 255,030 24,283 190,726 30,346 1,858 7,817 1993 . . . 257,783 25,222 191,697 30,795 1,884 8,184 1994 . . . 260,327 26,160 192,538 31,210 1,909 8,511 1995 . . . 262,803 27,107 193,328 31,590 1,932 8,846 1996 . . . 265,229 28,099 194,037 31,951 1,956 9,186 1997 . . . 267,784 29,182 194,746 32,339 1,979 9,537 1998 . . . 270,248 30,252 195,414 32,718 2,002 9,863 1999 . . . 272,691 31,337 196,049 33,092 2,026 10,186
PROJECTIONS4
2000 . . . 275,306 32,479 196,670 33,490 2,048 10,620 2005 . . . 287,716 38,189 199,414 35,446 2,171 12,497 2010 . . . 299,862 43,688 201,956 37,483 2,300 14,436 2015 . . . 312,268 49,255 204,590 39,551 2,428 16,444 2020 . . . 324,927 55,156 207,145 41,549 2,550 18,527 2025 . . . 337,815 61,433 209,340 43,528 2,668 20,846 2030 . . . 351,070 68,168 210,984 45,567 2,787 23,564 2040 . . . 377,350 82,692 212,475 49,618 3,023 29,543 2050 . . . 403,687 98,229 212,991 53,466 3,241 35,760 Percent distribution:
2000. . . 100.0 11.8 71.4 12.2 0.7 3.9 2005. . . 100.0 13.3 69.3 12.3 0.8 4.3 2010. . . 100.0 14.6 67.3 12.5 0.8 4.8 2015. . . 100.0 15.8 65.5 12.7 0.8 5.3 2020. . . 100.0 17.0 63.8 12.8 0.8 5.7 2025. . . 100.0 18.2 62.0 12.9 0.8 6.2 2030. . . 100.0 19.4 60.1 13.0 0.8 6.7 2040. . . 100.0 21.9 56.3 13.1 0.8 7.8 2050. . . 100.0 24.3 52.8 13.2 0.8 8.9
Percent change:
2000-2010 . . . 8.9 34.5 2.7 11.9 12.3 35.9 2010-2020 . . . 8.5 29.0 2.6 11.6 11.8 31.6 2020-2030 . . . 8.4 26.3 2.6 10.8 10.9 28.3 2030-2040 . . . 8.2 24.7 2.3 10.1 9.9 26.8 2040-2050 . . . 8.0 23.6 1.9 9.7 9.3 27.2 1Persons of Hispanic origin may be of any race. 2See footnote 4, Table 1. 3The April 1, 1990, estimates base (248,790,925) includes count resolution corrections processed through August 1997. It generally does not include adjustments for census coverage errors. However, it includes adjustments estimated for the 1995 Test Census in various localities in California, New Jersey, and Louisiana; and the 1999 census dress rehearsals in localities in California and Wisconsin. These adjustments amounted to a total of 81,052 persons. 4Based on middle series of assumptions. See footnote 1, Table 3.
Source: U.S. Census Bureau,Current Population Reports, P25-1095;‘‘Annual Population Estimates by Sex, Race, and Hispanic Origin, selected years from 1990 to 2000’’; published 26 May 2000; <http://www.census.gov/population/www/estimates/ nation3.html>; and‘‘(NP-T4) Projections of the Total Resident Population by 5-year Age Groups, Race, and Hispanic Origin with Special Age Categories: Middle Series, 1999 to 2100’’; published 13 January 2000; <http://www.census.gov/population/www/ projections/natsum-T3.html>.
Population
17
No. 17. Resident Population by Race and Age, 1990 to 1999, and Projections, 2000 and 2010
[In thousands (208,741 represents 208,741,000), except as indicated. As ofJuly 1, except 1990as ofApril 1. For definition of median, see Guide to Tabular Presentation. Projections are based on middle series of assumptions; see footnote 1, Table 3]
Age group
White Black American Indian, Eskimo, Aleut Asian, Pacific Islander
1990 1995 1999 2000,proj. 2010,proj. 1990 1995 1999 2000,proj. 2010,proj. 1990 1995 1999 2000,proj. 2010,proj. 1990 1995 1999 2000,proj. 2010,proj.
Total . . . 208,741 218,023 224,611 226,266 241,770 30,517 33,116 34,862 35,332 39,982 2,067 2,256 2,397 2,433 2,821 7,467 9,408 10,820 11,275 15,289
Under 5 years . . . 14,963 15,452 15,043 14,948 15,609 2,943 3,039 2,796 2,784 3,103 221 204 202 203 240 639 837 902 930 1,147 5 to 9 years. . . 14,505 15,137 15,706 15,575 15,127 2,715 3,017 3,146 3,087 2,953 210 228 219 212 232 613 715 875 908 1,126 10 to 14 years . . . 13,672 14,993 15,389 15,626 15,506 2,633 2,872 3,087 3,173 2,977 197 234 249 254 237 565 753 824 855 1,187 15 to 19 years . . . 14,357 14,481 15,648 15,755 16,804 2,718 2,831 3,044 3,056 3,444 191 204 235 238 242 627 688 822 848 1,178 20 to 24 years . . . 15,644 14,369 14,367 14,732 16,524 2,658 2,654 2,697 2,787 3,303 179 189 194 202 255 662 771 768 797 1,068 25 to 29 years . . . 17,643 15,302 14,505 14,166 15,586 2,783 2,596 2,611 2,592 2,915 188 182 193 192 240 723 823 900 909 1,109 30 to 34 years . . . 18,192 17,939 15,927 15,749 14,891 2,720 2,825 2,675 2,659 2,775 181 187 181 184 208 745 875 944 988 1,127 35 to 39 years . . . 16,654 18,476 18,504 18,209 14,894 2,362 2,791 2,902 2,900 2,744 157 179 186 185 193 678 850 953 983 1,207 40 to 44 years . . . 15,003 16,945 18,443 18,691 16,247 1,884 2,393 2,751 2,816 2,775 132 157 173 177 182 575 764 902 934 1,199 45 to 49 years . . . 11,828 14,855 16,206 16,625 18,095 1,415 1,855 2,240 2,326 2,855 100 126 143 148 175 405 622 767 802 1,102 50 to 54 years . . . 9,746 11,724 14,044 14,689 18,119 1,178 1,382 1,689 1,810 2,676 79 94 113 118 159 312 442 601 648 980 55 to 59 years . . . 9,132 9,534 11,077 11,450 16,041 1,042 1,139 1,289 1,331 2,194 64 72 84 86 130 252 341 425 457 813 60 to 64 years . . . 9,381 8,718 9,056 9,163 13,824 972 990 1,056 1,086 1,676 53 58 65 66 101 220 281 337 362 652 65 to 69 years . . . 8,985 8,720 8,189 8,156 10,393 860 922 935 940 1,230 43 47 50 51 71 179 237 273 289 465 70 to 74 years . . . 7,192 7,912 7,770 7,723 7,724 639 698 743 758 872 30 38 40 41 52 121 183 217 231 346 75 to 79 years . . . 5,519 6,047 6,585 6,658 6,237 484 513 558 564 648 22 25 31 33 39 80 115 156 166 251 80 to 84 years . . . 3,567 4,076 4,381 4,458 4,976 288 320 331 342 428 12 17 19 20 28 42 66 86 93 168 85 to 89 years . . . 1,858 2,148 2,389 2,461 3,131 150 165 181 185 230 6 9 11 12 18 20 30 43 47 96 90 to 94 years . . . 690 916 1,034 1,061 1,453 50 83 89 92 118 2 4 6 6 10 6 13 18 20 44 95 to 99 years . . . 184 239 300 317 485 17 24 35 37 49 1 1 2 3 5 2 3 6 7 16
100 years and over . . . . 29 41 50 54 105 6 6 7 9 17 - - 1 1 3 1 1 1 1 4
5 to 13 years . . . 25,561 27,150 28,019 28,116 27,494 4,844 5,315 5,635 5,653 5,334 369 415 418 415 421 1,065 1,314 1,531 1,590 2,072 14 to 17 years . . . 10,665 11,770 12,380 12,424 12,940 2,059 2,306 2,406 2,423 2,593 151 176 195 198 194 470 575 673 689 955 18 to 24 years . . . 21,951 20,060 20,710 21,148 23,527 3,821 3,754 3,933 4,026 4,750 257 263 283 293 351 932 1,036 1,085 1,129 1,534 16 years and over . . . 162,943 169,436 175,463 177,010 192,336 21,717 23,586 25,242 25,676 30,313 1,401 1,543 1,678 1,714 2,065 5,533 6,955 8,050 8,409 11,587 18 years and over . . . 157,552 163,651 169,169 170,778 185,727 20,671 22,456 24,026 24,472 28,952 1,326 1,460 1,582 1,616 1,967 5,293 6,681 7,715 8,066 11,115 16 to 64 years . . . 134,920 139,337 144,766 146,122 157,833 19,223 20,855 22,361 22,749 26,720 1,285 1,402 1,517 1,547 1,837 5,083 6,307 7,250 7,556 10,196 55 years and over . . . 46,536 48,350 50,831 51,501 64,369 4,508 4,859 5,226 5,343 7,462 233 272 310 320 459 923 1,269 1,563 1,672 2,855 65 years and over . . . 28,023 30,099 30,698 30,888 34,504 2,494 2,731 2,881 2,927 3,592 116 142 161 167 228 450 648 800 853 1,391 85 years and over . . . 2,761 3,344 3,773 3,893 5,174 223 278 313 322 414 9 15 20 22 37 29 48 68 75 161 Median age (yrs) . . . 33.7 35.4 36.6 36.9 38.8 27.9 29.2 30.1 30.3 32.3 26.0 26.8 27.6 27.8 29.3 29.4 30.7 31.7 32.0 33.7
- Represents or rounds to zero.
Source: U.S. Census Bureau,‘‘Monthly Postcensal Resident Population, by single year of age, sex, race and Hispanic origin’’published June 2000; <http://www.census.gov/population/www/estimates/nat90s1,html>; ‘‘Annual Population Estimates by Sex, Race, and Hispanic origin, selected years from 1990 to 2000’’; published 26 May 2000; <http://www.census.gov/population/www/estimates/nation3.html>; and‘‘Projections of the Total Resident Population by 5-year Age Groups, Race, and Hispanic Origin with Special Age Categories: Middle Series, 1999 to 2100’’; published 13 January 2000; <http://www.census.gov/population/www/projections/ natsum-T3.html>.
18
Population
U.S.
Census
Bureau,
Statistical
Abstract
of
the
United
States: