Report
of the
Malaysian
N
ational
Neonatal
Registry
2004
A Study of Critically Ill Babies in
N e o n a t a l I n t e n s i v e C a re U n i t s
Edited by:
Nyok-Ling Lim
NNR Steering Committee:
Nyok-Ling Lim
Report of the
Malaysian
National
Neonatal
Registry
2004
A Study of Critically Ill Babies in Neonatal Intensive Care Units
Edited by: Nyok-Ling Lim
NNR Steering Committee: Nyok-Ling Lim
Jimmy Lee Irene Cheah Anna Padma Soosai
The Malaysian National Neonatal Registry is located at:
National Neonatal Registry Unit Hospital Selayang,
Lebuhraya Selayang-Kepong, 68100, Batu Caves,
Selangor Darul Ehsan.
Tel: (603) 61352008 / 61203233 Ext. 8011
Fax: (603) 61352008
E-mail: nnr@acrm.org.my
Website: http://www.acrm.org.my/nnr
This report is copyright. However it may be freely reproduced without the permission of the National Neonatal Registry. Acknowledgement would be appreciated.
Suggested citation is:
Lim Nyok Ling for the MNNR. The 2004 report of the Malaysian National Neonatal Registry, Kuala Lumpur MNNR 2006.
Main Sponsors of the NNR 2004
• Office of the Deputy Director General of Health Malaysia (Research and Technical Support) Ministry of Health , Malaysia
CONTENTS
LISTING OF TABLES... 3
LISTING OF FIGURES... 5
FOREWORD ... 7
ACKNOWLEGEMENTS ... 8
PARTICIPATING CENTRES ... 9
ADVISORY COMMITTEE... 10
LIST OF SITE COORDINATORS... 11
STAFF OF NATIONAL NEONATAL REGISTRY UNIT... 14
1. Organisation Of The Malaysian National Neonatal Registry (NNR) ... 15
1.1History... 15
1.2 Structure ... 15
1.3 Funding ... 16
2. Data Set... 16
2.1 Registration Criteria... 16
2.2 Data Set Variables... 16
2.3 Data Collection Technique ... 16
2.4 Data Verification ... 17
3. Results… ... 18
3.1 In General ... 18
3.1.1 Registrants Per Unit ... 19
3.1.2 Levels Of Neonatal Care... 19
3.2 The Mother ... 20
3.3 Antenatal Events ... 20
3.3.1 Antenatal Corticosteroids ... 20
3.4 The Baby ... 20
3.4.1 Multiple Births ... 20
3.5 Birth... 21
3.5.1 Inborn Vs Outborn Babies ... 21
3.5.2 Mode Of Delivery ... 22
3.5.3 Condition Of Vlbw Babies (Bw <1500gm) ... 23
3.5.4 Need For Ventilatory Support (VS)... 24
3.6 Morbidity ... 24
3.6.1 Respiratory Distress... 25
3.6.1.1 Respiratory Distress Syndrome (RDS) ... 25
3.6.1.2 Congenital Pneumonia (C Pneu) ... 25
3.6.1.4 Neonatal Encephalopathy (NE)... 26
3.6.1.5 Congenital Anomalies (CA) ... 26
3.6.1.6 Pneumothorax (PTX) ... 26
3.6.1.7 Exogenous Surfactant ... 27
3.6.2 Cerebral Ultrasound Scan (CUS) ... 27
3.6.3 Eye Examinations... 28
3.6.4 Necrotising Enterocolitis... 28
3.6.5 Neonatal Infections... 28
3.7 Outcome ... 30
3.7.1 Perinatal And Neonatal Mortality Rates... 32
3.7.2 Discharge... 33
4. Tables…. ... 34
5. Additional Tables ... 64
Appendix I. ... 86
Appendix II... 88
Appendix III ... 92
Appendix IV ... 103
LISTING OF TABLES
Table 1. Use of antenatal steroids according to gestational age group, 2004... 34
Table 2. Inborn-outborn distribution according to the birthweight group, 2004... 34
Table 2a. Inborn-outborn distribution according to gestational age and birthweight group, 2004 ... 35
Table 2b. Growth status at birth according to gestational age group, 2004 ... 35
Table 3. Ventilatory support according to gestational age group, 2004... 36
table 3a. Ventilatory support according to birthweight group, 2004 ... 36
Table 4. Total NICU admissions according to centre (based on census returns), 2004 ... 37
Table 5. Baby distribution (babies admitted into study) according to centre, 2004 ... 38
Table 6. Ethnicity according to birthweight group, 2004... 38
Table 7. Baby distribution and survival according to mother’s marital status, 2004 ... 39
Table 8. Maternal age, mean birthweight, mean gestational age, duration of ventilatory support and duration of hospital stay according to birthweight group, 2004... 39
Table 9. Multiplicity of births according to gestational age group, 2004... 40
Table 10. Mode of delivery according to gestational age group, 2004 ... 40
Table 10a. Mode of delivery according to birthweight group, 2004... 41
Table 11. Mean CRIB score and mortality rate according to centre, 2004 ... 42
Table 12. Ventilatory support mode according to gestational age group, 2004 (part 1) ... 43
Table 12a. Ventilatory support mode according to birthweight group, 2004 ... 43
Table 12b. Ventilatory support mode according to gestational age group, 2004 (part 2) ... 43
Table 13. Duration of ventilatory support (VS) according to gestational age group, 2004... 45
Table 13a. Duration of ventilatory support (VS) according to birthweight group, 2004 ... 45
Table 14. Respiratory distress syndrome (RDS) according to gestational age group, 2004 ... 45
Table 14a. Respiratory distress syndrome (RDS) according to birthweight group, 2004... 46
Table 15. Congenital pneumonia according to gestational age group, 2004... 47
Table 15a. Congenital pneumonia according to birthweight group, 2004 ... 47
Table 16. Meconium aspiration syndrome (MAS) according to gestational age group, 2004 ... 48
Table 17. Neonatal encephalopathy (NE) according to gestational age group, 2004... 49
Table 17a. Neonatal encephalopathy (NE) according to birthweight group, 2004 ... 49
Table 18. Congenital anomalies (CA) according to gestational age group, 2004 ... 50
Table 18a. Congenital anomalies (CA) according to birthweight group, 2004... 50
Table 19. Pneumothorax according to birthweight group, 2004 ... 51
Table 20. Use of surfactant in RDS according to birthweight group, 2004 ... 51
Table 20a. Use of surfactant in non-RDS cases according to birthweight group, 2004... 52
Table 21. Chronic lung disease according to birthweight group, 2004 ... 52
Table 22. Cerebral ultrasound scanning (CUS) and intraventricular haemorrhage (IVH) according to birthweight group, 2004 ... 53
Table 23. Acquired periventricular cysts of newborn according to birthweight group,2004 ... 54
Table 24. Retinopathy of prematurity (ROP) according to gestational age group, 2004 ... 54
Table 24a. Retinopathy of prematurity (ROP) according to birthweight group, 2004... 55
Table 25 Necrotising enterocolitis (NEC) according to birthweight group, 2004... 56
Table 25a. Necrotising enterocolitis (NEC) according to gestational age group, 2004 ... 56
Table 26. Frequency of ‘infections’ and associated mortality rates, 2004 ... 57
Table 27. Survival according to gestational age, 2004... 58
Table 28. Survival according to birthweight group, 2004... 59
Table 29. Duration of hospital stay according to gestational age, 2004... 60
Table 29a. Duration of hospital stay according to gestational age, 2004... 61
Table 30. Duration of hospital stay according to birthweight group, 2004... 62
Table 30a. Duration of hospital stay according to birthweight group, 2004... 63
Table 31. Use of antenatal steroid according to centres, 2004 (Inborn)... 64
Table 31a. Use of antenatal steroid according to centres, 2004 (Outborn) ... 65
Table 32. Use of surfactant in Respiratory Distress Syndrome (RDS) according to centres, 2004 ... 66
Table 33. Use of parenteral nutrition (PN) according to centres, 2004... 67
Table 34. Pneumothorax according to centres, 2004 ... 68
Table 36. Cerebral ultrasound scanning ( CUS )and intraventricular haemorrhage (IVH) (babies with
birthweight 501-1500g) according to centres, 2004... 70
Table 37. Retinopathy of prematurity (ROP) (babies < 32 weeks gestation) according to centres, 2004... 71
Table 38. Retinopathy of prematurity (ROP) (babies with BW <1250g) according to centres, 2004... 72
Table 39. Cephalhaematoma, Sub-aponeurotic haemorrhage , Erb’s palsy and Birth Trauma according to centres, 2004 ... 73
Table 40. Necrotising enterocolitis (NEC) (babies with BW 501-1500g) according to centres, 2004 ... 74
Table 41. Confirmed bacterial sepsis according to centres, 2004 ... 75
Table 42. Confirmed bacterial sepsis in very low birthweight babies (BW 501-1500g) according to centres, 2004 ... 76
Table 43. Fungal sepsis in very low birthweight babies (BW 501-1500g) according to centres, 2004 ... 77
Table 44. Perinatal and neonatal death and mortality rate according to centres, 2004 ... 77
Table 45. Survival of extremely preterm (22-27 weeks’ gestation) and very preterm (28-31 weeks’ gestation) infants according to centres, 2004 ... 79
Table 46. Survival of extremely low birthweight (501-1500g BW) and very low birthweight (1001-1500g BW) infants according to centres, 2004... 80
Table 47. Survival of cases with ventilatory support according to centres, 2004 ... 80
Table 48. Duration of hospital stay (BW 501-750g) according to centres, 2004 ... 81
Table 49. Duration of hospital stay (BW 751-1000g) according to centres, 2004 ... 83
Table 50. Duration of hospital stay (BW 1001-1250g) according to centres, 2004 ... 83
LISTING OF FIGURES
Fig 1. Case distribution according to gestational age group, 2004 ...18
Fig 2. Case distribution according to birthweight group...18
Fig 3. Case distribution according to sex, 2004 ...21
Fig 4. Case distribution according to BW groups and inborn - outborn status, 2004 ...22
Fig 5. Mode of delivery according to gestation, 2004 ...22
Fig 6. Mortality of VLBW babies according to centre and mean CRIB score, 2004...23
Fig 7. Ventilatory support according to gestational age group, 2004 ...24
Fig 8. Mean duration of Ventilatory Support (for VS >=24 hours) according to gestational group, 2004 ...25
Fig 9. Mortality rate according to specific condition, 2004 ...26
Fig 10. Use of surfactant in Respiratory Distress Syndrome, 2004 ...27
Fig 11. Types of infecting organisms in confirmed bacterial sepsis, 2004 ...29
Fig 12. Survival according to birthweight and gestational age group, 2004 ...30
Fig 13. Survival according to BW group for VLBW babies (BW up to 1500g), 2004 ...31
Fig 14. Survival according to gestation for very preterm babies (gestation < 32 weeks), 2004 ...31
Fig 15. Total births and neonatal deaths and mortality rates, 2004...32
FOREWORD
It is with a great sigh of relief and satisfaction that this report is finally ready. As it is the report of the result of the first year study of the ‘Outcome of Critically Ill Babies in the Neonatal Intensive Care Units (NICUs) in Malaysia’ analysis of the data has been kept at quite a minimal level. The various outcomes e.g. survival rates, rates of infections and rates of screening for retinopathy of prematurity are described largely as overall outcomes in the main section of the report. Nevertheless data of a variety of outcome measures according to participating centres are also included in tables at the back section of the report.
The steering committee has identified some individual participants to use the data that has been captured in the NNR to study in further detail some important aspects of outcome of this group of ill babies e.g. ‘Outcome of extremely low birth weight babies’ and ‘NICU outcome according to socioeconomic status of states’. These papers will be presented at certain forums and conferences and it is hoped that a few will be published in journals. We encourage all source data producers to be involved in more detailed report-writing of some specific aspects of NICU outcomes.
We appreciate the great amount of work and effort each hospital has put in to realise the establishment of this registry and we urge each centre to study its performance in relation to other centres. It will be seen that some centres may have better outcome in terms of mortality while others in terms of morbidity eg infection rate and duration of hospital stay.
It is important that we identify weaknesses and strengths of each centre to facilitate quality improvement strategies to be implemented. Some problems may pertain to infrastructure and equipment while others to expertise and manpower.
It is hoped that this registry will grow each year in terms of engaging participation of increasing numbers of NICUs, and in sophistication of the design and study protocol and data analysis. It is also hoped that it will be the stimulus for auditing of NICU performance and further research activity and hence serve as a vital source of data-based evidence on which to formulate best-care practices for sick newborns in the country.
Dato’ Dr Lim Nyok Ling Chairman
ACKNOWLEGEMENTS
The National Neonatal Registry would like to express its grateful appreciation to all who have contributed in various ways to make the NNR a success.
We would like to especially thank the following:
• Y.B. Dato’ Dr Chua Soi Lek, the Honorable Minister of Health for his encouragement and support.
• Yang Bahagia Datuk Dr Mohd Ismail Merican the Director-General of Health,
Malaysia for approving a research grant to study the ‘Outcome of critically ill
babies in NICUs’ in 2004 and hence spearheading the NNR project.
• Dato’ Dr Zaki Morad B Mohd Zaher the chairman of the Ministry of Health
Research Committee for his inspiration and challenge to clinicians to be involved
in outcome studies and his guidance in setting up the Registry.
• Staff of the Clinical Research Centre of Ministry of Health for their technical
support.
• Members of the Advisory Committee who provided conceptual and intellectual
input to set the objectives, directions, policies and progress of the Registry • Our dedicated source data providers consisting of all the doctors and nurses from
the participating centres who continue to work hard at this project amidst their
very hectic service load and other commitments in the NICUs.
• And of course not forgetting our sponsors and supporters from the professional
bodies, industry, other institutions and individuals not listed here.
Perinatal Society of Malaysia Malaysian Paediatric Foundation Abbott Laboratories (M) Sdn Bhd
Yayasan Budi Penyayang Malaysia (PENYAYANG) Sekolah Menengah Sri Kuala Lumpur
Dumex Sciences
Mead Johnson Malaysia Frisenius Kabi Malaysia Hwang DBS (M) Berhad Lejadi Holdings Sdn Bhd
PARTICIPATING CENTRES
1. Alor Setar Hospital
2. Ipoh Hospital
3. Kajang Hospital
4. Kuala Lumpur Hospital
5. Kuala Terengganu Hospital
6. Likas Hospital
7. Melaka Hospital
8. Pulau Pinang Hospital
9. Putrajaya Hospital
10.Raja Perempuan Zainab II Hospital
11.Sarawak General Hospital
12.Seberang Jaya Hospital
13.Selayang Hospital
14.Seremban Hospital
15.Seri Manjung Hospital
16.Sibu Hospital
17.Sultanah Fatimah Specialist Hospital
18.Taiping Hospital
19.Teluk Intan Hospital
20.Temerloh Hospital
21.Tengku Ampuan Afzan Hospital
22.Tengku Ampuan Rahimah Hospital
23.Tengku Fuziah Hospital
ADVISORY COMMITTEE
Member
Designation and Institution
Dato’ Dr Lim Nyok Ling(Chairperson) Head of Paediatric Department, Selayang Hospital
Dato’ Dr Jimmy Lee Kok Foo
Head of Paediatric Department, Kuala Terengganu Hospital
Dr Angeline Wan Seng Lian Head of Paediatric Department, Muar Hospital
Dr Angeline Yeoh Head of Paediatric Department, Seberang Jaya Hospital
Dr Chan Lee Gaik Head of Paediatric Department, Sarawak General Hospital
Dr Chin Choy Nyok Head of Paediatric Department, Tengku Ampuan Afzan Hospital
Dr Hussain Imam b Hj
Mohammad Ismail Head of Paediatric Institute, Hospital Kuala Lumpur
Dr Irene Cheah Head of Neonatal Unit, Paediatric Institute, Kuala Lumpur Hospital
Dr Jamaiyah Haniff Head, Epidemiology Unit, CRC, HKL
Dr Leow Poy Lee Consultant Paediatrician, Melaka Hospital
Dr Mohd. Hanifah b Mohd Jamil
Head of Paediatric Department, Raja Perempuan Zainab II Hospital
Dr Neoh Siew Hong Head of Paediatric Department, Taiping Hospital
Dr Nooraziah bt Zainal Abidin
Principal Assistant Director, Medical Development Division, Ministry of Health Malaysia
Dr S Padma Soosai Consultant Paediatrician and Neonatologist, Paediatric Department, Tengku Ampuan Rahimah Hospital
Dr S. Yogeswery Sithamparanathan
Head of Paediatric Department, Tengku Ampuan Rahimah Hospital
LIST OF SITE COORDINATORS
Institution
Head of Department
Coordinators
Paediatric Department
Alor Setar Hospital Dr Teh Keng Hwang
Dr Teh Keng Hwang Sr Nooraini bt Suhud S/N Rabiah
Paediatric Department
Ipoh Hospital Dr Amar Singh
Prof Dr Jackie Ho Sr Jamaliah bt Md Rif S/N Tan Hai Hon
Paediatric Department
Kajang Hospital Dr Soo Min Hong
Dr Soo Min Hong Sr. Lim Beaw
S/N Normadiah bt Majuddin
Paediatric Department Kuala Lumpur Hospital
Dr Hussain Imam b Hj Mohammad Ismail
Dr Irene Cheah
Sr Sudha A/P Krishnan Kutty S/N Vanaja A/P Ramasamy Pillay
S/N Sharifah bt Adam S/N Norida bt Ibrahim
S/N Aishah bt Hassan
Paediatric Department
Likas Hospital Dr. Soo Thian Lian
Dr. Soo Thian Lian Sr Tomblow bt Nagadiran S/N Susie Sulinol
Paediatric Department
Melaka Hospital Dr Kuan Geok Lan
Dr Leow Poy Lee Sr Lim Geok Poh
Paediatric Department
Putrajaya Hospital Dr Fuziah bt Md Zain
Institution
Head of Department
Coordinators
Paediatric Department Raja Perempuan Zainab II Hospital
Dr Mohd Hanifah b Mohd Jamil
Dr Hasmawati bt Hassan S/N Nolmawati bt Hassan S/N Noriyah bt Mat
Paediatric Department
Sarawak General Hospital Dr Chan Lee Gaik
Dr Chan Lee Gaik Sr Maria Kilat
S/N Sabariah bt Kiflie
Paediatric Department
Seberang Jaya Hospital Dr Angeline Yeoh
Dr Angeline Yeoh
Sr Ku Azini Ku Mohamad S/N Lee Soon Mui
Paediatric Department
Selayang Hospital Dato’ Dr Lim Nyok Ling
Dr Chew Thean Meng Sr Fatimah bt Ahmad
S/N Narayani A/P Kunjiraman S/N Khatijah bt Yusof
Paediatric Department
Seremban Hospital Dr Tan Kah Kee Dr Ummathevi Sr Latifah bt Dato’ Hj Nawawi S/N Sumathi Ramasamy
Paediatric Department
Seri Manjung Hospital Datin Dr Chan Sow Keng
Datin Dr Chan Sow Keng Sr Ainan Abdul Karim S/N Tham Ngun Lee
Paediatric Department
Sibu Hospital Dr Wong See Chang
Dr Audrey Chieng Chae Hee Sr Mary Tang Sing Chuo S/N Ting Meng Ling
Paediatric Department Sultanah Fatimah Specialist Hospital
Dr Angeline Wan Seng Lian
Dr Angeline Wan Seng Lian Sr Loh Siew Lin
S/N Radiah Md. Said S/N Lon bt Ahmad
Paediatric Department
Taiping Hospital Dr Neoh Siew Hong
Institution
Head of Department
Coordinators
Paediatric Department
Teluk Intan Hospital Dr Jeyaseelan P. Nachiappan
Dr Jeyaseelan P. Nachiappan Sr Hamedah Mian
S/N Che Noor Zaini
Paediatric Department
Temerloh Hospital Dr K. Yogavijayan Kandasamy
Dr Priadarshini Somasundaram Sr Rokiah bt Ismail S/N Rosmawani
Paediatric Department Tengku Ampuan Afzan
Hospital Dr Chin Choy Nyok
Dr Chin Choy Nyok
S/N Zalimah bt Tukmim
Paediatric Department
Tengku Fuziah Hospital Dr Jamaluddin b Mohammad
Dr Jamaluddin b Mohammad Sr Zarinah Ahmad
S/N Zarini bt Johari
Paediatric Department Universiti Sains Malaysia Hospital
Dr Norizan bt Majid
Prof.Dr Hans van Rostenberghe Sr Fatimah bt Ismail S/N Tan Beng Geok
Paediatric Department
Pulau Pinang Hospital Dr Revathy Nallusamy
STAFF OF NATIONAL NEONATAL REGISTRY UNIT
Clinical Registry Manager Ms. Jennifer Loong
Clinical Registry Assistants Ms. Sabariah bt Abdullah Ms. Shahirah bt Safian
SUPPORTING STAFF FROM THE CLINICAL RESEARCH
CENTRE
The Clinical Research Centre (CRC) of the Ministry of Health provides technical support for the National Neonatal Registry. The clinical epidemiologists provide methodological and epidemiological input while the database is supported on CRC’s IT infrastructure.
Director Dr Zaki Morad B Mohamad Zaher
Head Dr. Lim Teck Onn
Clinical Epidemiologist Dr. Jamaiyah Haniff
Clinical Epidemiologist Dr. Anita Das
Information & Communication Ms. Celine Tsai Pao Chien
Technology (ICT) Manager
Network Administrator Mr. Kevin Ng Hong Heng
Assistant Network Administrator Mr. Adlan Ab. Rahman
Database Administrator Ms. Lim Jie Ying
Webmaster Mr. Patrick Lum See Kai
Programmer Mr.Sebastian Thoo / Mr. John Chong
Desktop publisher Ms. Azizah Alimat
BIOSTATISTICAL CONSULTANTS
Biostatistician Dr. Sharon Chen Won Sun
1. Organisation of the Malaysian National Neonatal Registry (NNR)
1.1History
In October 2001 at a National Paediatricians’ meeting it was decided that a registry should be set up to study the outcome of sick babies admitted to Neonatal Intensive Care Units in the country. It was recognised that a minimum data set and a data collection system at a national level are important to monitor mortality and morbidity of infants admitted to NICUs
In collaboration with the Clinical Research Centre (CRC), Ministry of Health of Malaysia, a pilot study was first conducted from 1st October to 31st December in which 14 centres participated. A report of this study has been published in October 2003. It was concluded that the NNR is feasible and very useful information can be obtained for purposes of clinical management, resource allocation and policy development. The NNR proper was then launched on 1st January 2004 and 24 Neonatal Intensive Care Units (NICUs) were recruited.
The Malaysian NNR aims:
1. To determine the frequency and distribution of critically ill neonates in Malaysia. These are useful measures of the health burden arising of neonatal critical illness and its care in the country.
2. To study the mortality and some morbidity outcomes of babies admitted to NICU in participating hospitals.
3. To calculate the perinatal, neonatal, and stillbirth mortality rates of inborn babies. 4. To compare outcomes between various centres.
5. To develop indicators for standard of care in various areas e.g. acceptable septicaemic rates among ill babies in NICUs.
6. To study in further detail outcome of very low birth weight babies.
7. To stimulate and facilitate research on neonatal critical illness and its management.
1.2 Structure
The NNR consisted of an Advisory Committee and administrative staff. The Advisory Committee was made up of senior pediatricians and neonatologists of participating units, three academic neonatologists from the Universities, a clinical biostatistician and epidemiologist. This committee was to monitor and direct the functions of MNNR and to approve request of use of data when the necessary.
1.3 Funding
The Ministry of Health of Malaysia provided a research grant for 2 years in 2004 and 2005 to ‘Study the outcome of critically ill babies in NICUs’. Considerable funding was also obtained from the Perinatal Society of Malaysia, the Malaysian Paediatric Foundation, Penyayang, Abbott Laboratories, Sekolah Menengah Sri KL, Subang Jaya, Frisenius Kabi and Hwang DBS. Some other institutions and individuals had also made invaluable contribution to fund the NNR. We thank all involved for their very generous and encouraging support.
2. Data Set
2.1 Registration Criteria
The NNR audit of critically ill babies admitted to a Neonatal Unit (NNU) included
A. All babies admitted to a Neonatal Unit who
1. Had a gestation of <32 weeks i.e. up to 31 weeks + 6 days. 2. Had with a birth weight of 1500 grams and below
3. Were ventilated .
B. All neonatal deaths (i.e. newborn babies (<28days) who die in the NNU, delivery room i.e. OT and labour room, and other wards)
Both inborn and out born babies will be included but out born babies who expire before arrival will be excluded. Babies who are admitted to the NNU at a corrected gestation of > 44/52 will not be considered a neonatal case and hence will be omitted from the study.
2.2 Data Set Variables
In the pilot study centres had the option of collecting data for all babies admitted to the NNU or only a sub-group of babies i.e. babies with birthweights <1.5 kg or babies who were ventilated. In the 2004 registry data collection was standardized in all centres to only babies with selected criteria as listed above. Data on all inborn births was also collected to facilitate calculation on perinatal and neonatal mortality rates of each hospital. (Appendix I Birth Census)
2.3 Data Collection Technique
The Case Report Forms (CRF) consisted of 4 pages of forms. (AppendixII CRF) The first page had 4 sections. Section 1 consisted of Patient Particulars, Section 2 Birth History, Section 3 Neonatal Events and Section 4 Outcome.
Babies discharged/transferred out to non-paediatric wards (e.g. paediatric surgical wards) in the same hospital or to other hospitals will have only one set of CRFs completed and readmission of the same babies into the NNU will require a new set of CRFs.
A baby who was transferred between neonatal and paediatric wards under the same department will be considered to be the same admission and the discharge CRF is to be completed after complete discharge from the hospital.
A first time admission to the NNU concerned was considered as a new case (even if it had been previously admitted else where) while a subsequent admission to the same NNU would be considered as a readmission. This would be accordingly indicated on the 1st sheet of the CRF. Information for Section 2 (Birth History) was not necessary to be provided again for a readmission while for Section 3 (Neonatal Event) only events occurring during the said admission needed to be recorded.
For Section 4 (Outcome) only information pertaining to the respective admission and for Section 5 only Diagnoses and Problems that were encountered or still being encountered during the said admission needed to be entered in the data sheet.
Hard copies CRFs were used and completed CRFs were sent to the Neonatal Registry Unit (NRU) after a defined period. (See below on monthly census and tracking of CRF forms).
2.4 Data Verification
3. Results
3.1 In General
In 2004, total births in the 24 participating centres totalled 196824 of which 1884 were stillbirths and 194940 were live births.
A total of 7350 babies however were admitted (admissions included outborns who were not delivered in respective hospitals of the participating centres) who met the criteria to be included in the MNNR. Of these 2522 (34.3%) were less than 32 completed weeks (Table 1) and 2753 (37.4%) had birthweights of 501-1500grams. (Table 2) There were 38 babies with BWs of less than or equal to 500grams.
In terms of growth status 1277 (17%) of the whole study population was small for gestational age (SGA < 10th centile for gestation according to Lubchenko chart). The SGA rate for VLBW infants (BW 501-1500g) was 28%. (Table 2b)
Fig 1. Case distribution according to gestational age group, 2004
Fig 2. Case distribution according to birthweight group
Ventilatory support of whatever modes was given to a total of 6310 (85.8%) babies.(Table 3)
While the babies who met the criteria for the study were generally babies requiring the most care they do not include many other babies admitted to the NICUs for other treatments and observation.
In this report babies are referred to as ‘very preterm’ if they are less than 32 completed weeks gestation, ‘preterm’ if they are less than 37 completed weeks’ gestation, and ‘term’ if born at 37 week’s gestation or more. Very low birth weight (VLBW) babies are babies with birthweight (BW) 501-1500g and extremely low birthweight (ELBW) babies are babies with BW 501-1000g.
3.1.1 Registrants per Unit
Admissions of inborn babies to each Neonatal Unit are as shown in Table 4 and registrants in the study from each centre in Table 5. The number of babies who met the criteria for this audit ranged from 70 to 705 babies per centre. These numbers reflected the size of the centre, the case mix of their patients and the geography and population distributions of each area.
3.1.2 Levels of Neonatal Care
Care for the newborn is provided at three levels. ‘Level I’ care is for normal healthy babies, some of whom may need short-term observation during the first few hours of life. Level I care is mostly given to babies who are rooming –in with their mothers in obstetric wards
Level II or ‘special care’ refers to a nursery that generally has babies born at 32-36 weeks gestation or weighing around 1500-2500 grams at birth. It includes the care of babies who require intravenous therapy or antibiotics, and/or those who are convalescing after intensive care, and/or those who need their heart rate or breathing monitored, and/or those who need short term oxygen therapy. Babies who are above 35 weeks’ gestation and have birth weights above 1.8 kg but are otherwise well are usually not admitted but managed in the obstetric wards.
Level III or intensive care refers to the care of newborn infants who require specialized care and treatment. It includes most babies born at less than 32 weeks gestation or less than birthweight 1500 grams birthweight, and others who may require intravenous feeding, and/or surgery, and/or cardio-respiratory monitoring for management of apnoea or seizures, and/or supplemental oxygen over 40% or long term oxygen.
3.2 The Mother
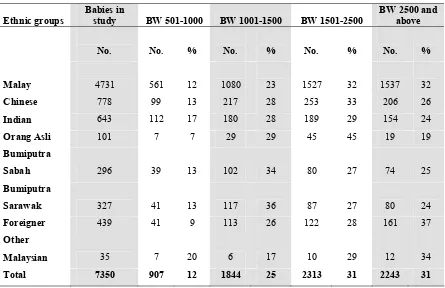
Ethnicity as identified by the mother was reported as 64.4% Malays, 10.6% Chinese, 8.7 % Indians, 1.4 % Orang Asli, 4.0% Bumiputra Sabah, 4.4% Bumiputra Sarawak, 0.5% other Malaysians and 6.0% foreigners. (Table 6) Ethnic distribution of the population in Malaysia in 2004 was reported as 50.4% Malays, 23.7% Chinese, 7.1% Indians, 11% indigenous and 7.8% others (Information and Documentation Unit, Planning and Development Division, Ministry of Health Malaysia).
Single mothers accounted for 109 cases (1.5%) in the study out of which 24 (22.0%) died. (Table 7) This is identical to an overall mortality of 23.5% in the whole group.
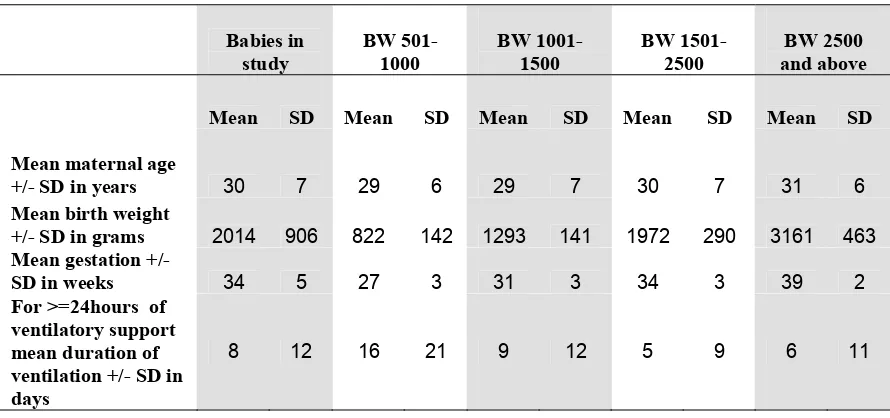
The mean maternal age in the study group was 30 +/- 7 years. (Table 8)
3.3 Antenatal events
3.3.1 Antenatal corticosteroids
Corticosteroids are administered to the mother to enhance the maturation of her baby’s lungs when it is thought she will deliver before 34 weeks’ gestation. The first randomized controlled trail of steroid use was in New Zealand in 1970 (Liggins & Howie, 1972). A systematic review reported antenatal steroids to be efficacious in helping to promote maturation of the lungs and preventing death (Crowley, 2003). This therapy also has other beneficial effects such as reduction of the incidence of necrotizing enterocolitis, without harmful effects for mother and baby. The Perinatal Society of Malaysia in collaboration with the Ministry of Health of Malaysia has recommended that maternal corticosteroids should be considered before all births at less than 34 weeks in order to improve neonatal outcomes. (PSM Clinical Practice Guidelines, 1995 updated 2001)
This therapy was given to mothers of 2219 (61.2%) out of 3630 babies < 34 weeks (note babies 32-33 weeks who are not VLBW, and did not require ventilatory support or not died were not included in the study ) and 60.3% < 32 weeks. (Table 1)
3.4 The baby
3.4.1 Multiple births
There were 6696 (91.1%) singletons, 597 (8.1%) twins, 54 (0.7%) triplets and 1 quadruplet in the study. (Table 9)
Fig 3. Case distribution according to sex, 2004
58% 42%
0%
Males Females Indeterminate
3.5 Birth
3.5.1 Inborn vs. Outborn Babies
Babies are usually cared for in the hospital of their births. However some high-risk babies may need to be transferred to a hospital with a level III NICU, if care is being received at a hospital without NICU facilities. When this risk is anticipated both mother and baby may be transferred before birth (in-utero), or if risk is not anticipated baby is transferred only after being born (ex-utero). Transfer is usually made to the nearest NICU with an available bed, and in most places an escort transport system is practised. Sometimes this transfer may have to be made to an NICU which is quite far away from the referring unit. It is generally recommended that all babies <34 weeks should be delivered in an obstetric unit in a hospital with an NICU.
Fig 4. Case distribution according to BW groups and inborn – outborn status, 2004
All cases Up to 500 501-1500 >1500
Inborn Outborn
NICUs are generally placed in general hospitals, university hospitals and some district hospitals with specialist. Some private hospitals also provided neonatal intensive care to sick babies either in a separate NICU or as part of a general ICU. In the 2004 study however none of the private hospitals participated. Some babies delivered in private hospitals however have been transferred to NICUs in the participating hospitals.
3.5.2 Mode of delivery
Fig 5. Mode of delivery according to gestation, 2004
The overall spontaneous vertex delivery rate was 53.9 (3961/7350) and LSCS rate
(Emergency and elective combined) 40% (n=2677+262 i.e. 2939)
For very preterm (<32 weeks) babies the combined LSCS rate was 34.5%. (869/2522) (Table 10)
No of cases
BW groups in grams 79%
Upto 27 28-31 32-36 37 and
above
Total
SVD Breech Forceps Ventouse LSCS
Gestation in weeks SVD: 53.9%
3.5.3 Condition of VLBW babies (BW <1500gm)
A ‘clinical risk index for babies’ (CRIB) score was performed based on six variables, derived from routine data recorded within 12 hours of birth that are independently associated with hospital deaths. (Appendix II CRF).
It is a tool for assessing initial risk and comparing performance of neonatal intensive care units.
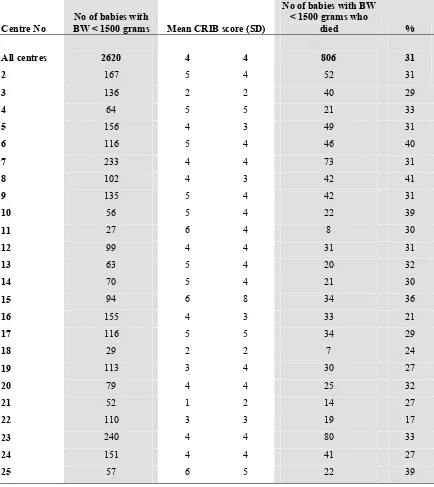
The mean CRIB score of babies with BW < 1500gm was 4 +/- 4 and of overall mortality was 30.8%.
There was a weak correlation of CRIB score (Corr coeff of 0.53) with mortality rates among the centres (Table 11)
Fig 6. Mortality of VLBW babies according to centre and mean CRIB score, 2004
0 5 10 15 20 25 30 35 40 45
0 2 4 6 8
Mortality rate (%)
3.5.4 Need for Ventilatory Support (VS)
All newborn babies admitted to NICUs with a gestation of < 32 weeks at birth were included in this study. Of these 1984/2522 (78.8%) received ventilatory support which included CPAP, IMV, IMV + PTV, HFPPV, HFOV and NO as a single modality or in combination. CPAP alone as a mode of ventilatory support was given to 298 (11.8%) these very preterm babies. (Table3.)
Fig 7. Ventilatory support according to gestational age group, 2004
0 500 1000 1500 2000 2500
<22 22-27 28-31 32-36 37 and
above
No cases No with VS No with CPAP alone
It is noteworthy that of the 6310 babies requiring VS, 2359 (37.4%) were term babies.
High frequency oscillatory ventilation (HFOV) is a specialized form of mechanical ventilation given at 8-15 hertz per second, in contrast to conventional IPPV which is given at about one breath or less per second. Of the very preterm babies 66 (2.6%) was given HFOV. Table 12. Use of other modes of ventilatory support is also as shown in the Table.
3.6 Morbidity
There is a high rate of morbidity amongst babies admitted to a level III NICU. These are principally associated with preterm births and complications arising in term babies necessitating ventilatory support.
The criteria for entry into study have selected those babies most at-risk of morbidity and mortality. The outcomes reported are those identifiable while the baby is in hospital, and many of these outcomes have also been shown to be predictors of later morbidity.
No of cases
3.6.1 Respiratory Distress
The adaptation to life outside the uterus can cause problems for both preterm and term babies. Respiratory distress is a major cause of morbidity and accounts for large a proportion of the use of resources in these sick babies.
Use of ventilatory support according to gestation has been alluded to above.
For preterm babies the duration of ventilatory support increased with decreasing gestational age. Duration of VS for term babies however was slightly longer on average (Mean of 5.8 +/- 10.2 days) compared to borderline preterm babies of 32-36 weeks gestation. (Mean of 5.6 +/- 8.9 days).
(Table 13.)
This is further illustrated in Fig 8.
Fig 8. Mean duration of Ventilatory Support (for VS >=24 hours) according to gestational group, 2004
0 2 4 6 8 10 12 14 16 18
22-27 28-31 32-36 37 and above
Overall
Specific conditions in relation to respiratory morbidity
3.6.1.1 Respiratory distress syndrome (RDS)
Respiratory distress syndrome was the predominant respiratory diagnosis for babies in this study, being present in 3138 babies out of which 2867 (91.4%) needed ventilatory support. Overall mortality was 19% but was 52% for babies of 22-27 weeks gestation. (Table 14)
3.6.1.2 Congenital Pneumonia (C Pneu)
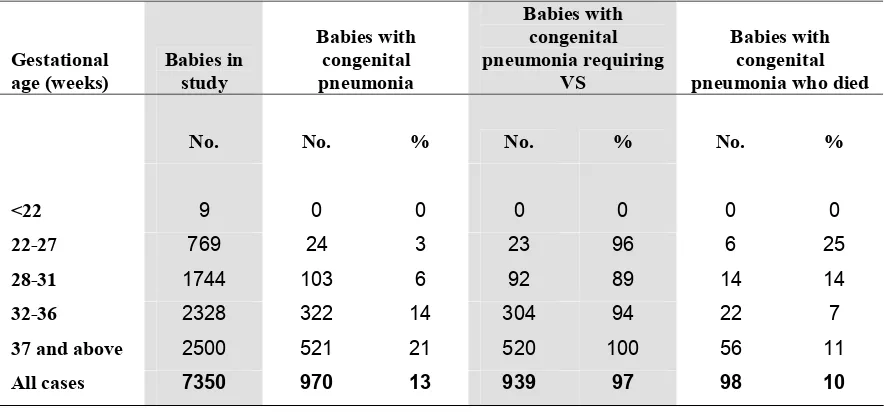
There were 970 babies with congenital pneumonia of which 939 (96.8%) required VS and 98 (10.1%) died. (Table 15)
3.6.1.3 Meconium Aspiration Syndrome (MAS)
There 552 babies with MAS, 544 (98.6%) required VS and 91 (16.5%) died. (Table 16)
3.6.1.4 Neonatal Encephalopathy (NE)
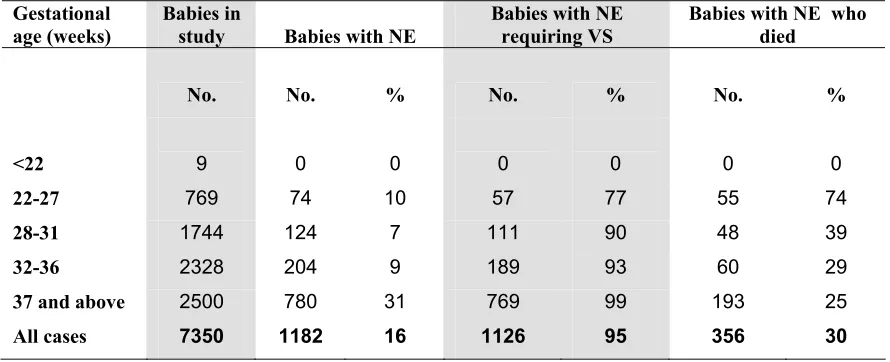
A total of 1182 babies had NE of whom 1126 (95.3%) were given VS and 356 (30.1%) died.
(Table 17)
3.6.1.5 Congenital Anomalies (CA)
Only babies with congenital anomalies who required VS or had died were included in the study. Some with congenital anomalies were included based on other criteria of being very preterm or VLBW. These consisted of various abnormalities and many were heart defects. Of the 452 babies with CA, 271 (60.0%) were ventilated and 312 (69.0%) died. (Table 18) By nature of the inclusion criteria other babies with congenital anomalies who were not ventilated were either very preterm, VLBW or had died without being ventilated.
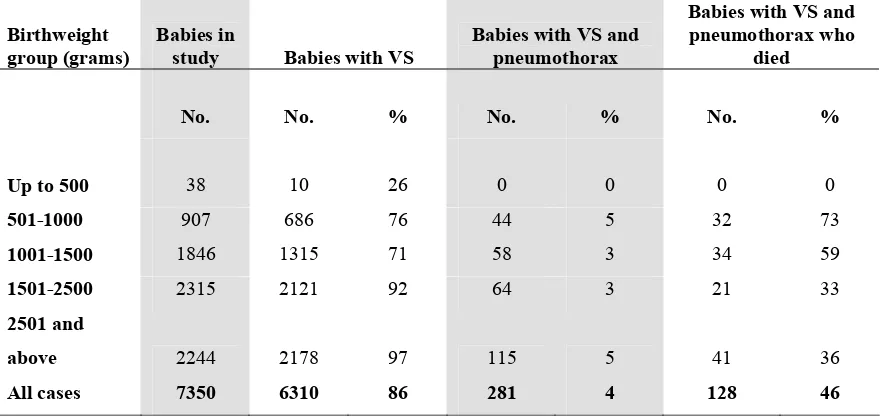
3.6.1.6 Pneumothorax (PTX)
Pneumothorax often complicates mechanical ventilation and contributes to further morbidity and mortality of babies. (Fig 9). A total of 281 (4.5%) babies who had ventilatory support developed pneumothorax out of which 128 died (45.6%) (Table 19)
Fig 9. Mortality rate according to specific condition, 2004
0 10 20 30 40 50 60 70
RDS C Pneu MAS NE CA PTX
% Mortality
3.6.1.7 Exogenous Surfactant
Exogenous surfactant is a treatment primarily for RDS and is given soon after birth via the endotracheal tube. Its efficacy was confirmed by a systematic review (Soll, 2003) and this treatment in the Malaysian CPG is recommended for babies who are ventilated for RDS. In this study of those who had RDS and required ventilatory support 1614 (56.3%) were treated with surfactant.
(Table 20)
Fig 10. Use of surfactant in Respiratory Distress Syndrome, 2004
0 2000 4000 6000 8000
Total babies No with RDS No with VS No RDS with VS given surfactant
Very rarely surfactant may be given for other conditions e.g. meconium aspiration syndrome and hypoplastic lung with persistent pulmonary hypertension. A total of 243 (7.1%) babies who had VS but did not have RDS were also treated with surfactant. (Table 20a)
Chronic lung disease (CLD) or bronchopulmonary dysplasia (BPD) which we used interchangeably as defined by clinical respiratory distress with oxygen dependency at 28 days of life in a background of acute lung injury in 1st 2 weeks of life (Appendix III InstructionManual) occurred in 233 (3.2%) cases in the study. The highest incidence of chronic lung disease was among the ELBW babies i.e. 100 (11.0%) of 907 babies with BW 501-1000g. Mortality occurred in 48 (20.6%) babies of the total 233 with CLD. (Table 21)
3.6.2 Cerebral Ultrasound Scan (CUS)
Ultrasound imaging of the head of very preterm babies is performed to detect both intraventricular haemorrhage (IVH) and the formation of cysts and ventricular dilatation (hydrocephalus). An initial ultrasound is generally performed during the first week of life to detect signs of IVH. These IVHs are graded according to an internationally recognized method (Papile et al. 1978). Grade 1 and 2 are milder grades and generally do not affect outcome adversely while Grade 3 and 4 are markers of possible later disability.
Of the 2753 babies with BW 501-1500 g, 1655 (60.1%) had CUS and 191 (11.5%) had Grade 3 or 4 IVH. Combined mortality rate from Grade 3 and 4 IVH was 58.1%. (Table 22)
43% 91% 56%
7350 cases
Later ultrasound examinations detect cystic lesions (e.g. porencephalic cysts and periventricular leukomalacia) and post-haemorrhagic hydrocephalus. These are strong predictors of later abnormality. This study however did not specifically look at the time ultrasound scanning was performed but data was captured on the incidence of ‘acquired periventricular cysts of newborn’. (Table 23)
3.6.3 Eye Examinations
Eyes of very preterm babies are examined to monitor vascularisation which, if disrupted, can result in retinopathy of prematurity (ROP). The staging criteria for ROP were set by the International Committee for the classification of ROP (1984). Threshold disease i.e. Stage III plus or Stage IV usually necessitates laser or cryotherapy to preserve vision. Criteria that is being used for ROP screening in Malaysia are babies with birth weights of <1250 grams or gestation < 32 weeks. Other babies out of these BW and gestation criteria are also screened if significant risk is perceived by the doctors taking care of these babies. First screening is generally recommended at 4-6 weeks of life. This audit did not study the exact time screening was done of the survivors who satisfy the criteria for screening. However of these babies who survived the rate of ROP screening and the presence of ROP is as shown in Table 24.
About 88% of extremely preterm and ELBW survivors had ROP screening. An overall total of 79 (1.4%) survivors developed Grade 3 or 4 ROP, 66 (7.1%) in babies with BW <1250 gm and 13 (0.3%) with BW 1250 gm and above.
3.6.4 Necrotising Enterocolitis
Necrotising Enterocolitis (NEC) is a disease of the gut which usually affects the large intestine (colon). It is associated with a high morbidity and mortality in preterm babies and occasionally in term babies. It is generally associated with factors such as low gestational age, hypoxic events and infections.
An overall NEC rate of 4.3% was recorded. Extremely low birth weight (ELBW) and extremely preterm infants had the highest incidence of NEC i.e. 9.0% in BW 501-1000g and 8.4% in 22-27 weeks gestation.. In these BW and gestation groups however mortality was higher among those babies who did not develop NEC. This was likely due to earlier demise of these very ‘fragile’ babies’ even before NEC could set in. (Table 25)
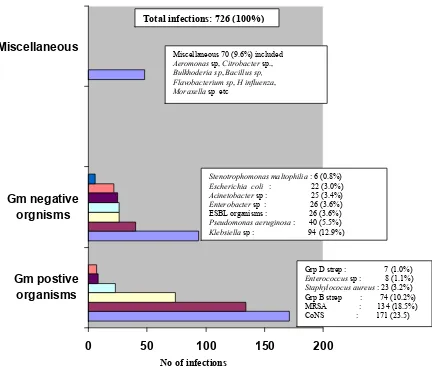
3.6.5 Neonatal infections
The frequency of infections and the associated mortality rates are as shown in Table 26. Each infant might have more than 1 type of infection and also >1 episode of a specific infection. i.e. infections in various categories are not mutually exclusive. Also the number of episodes of each infection was not captured in this study. If a baby had 2 episodes of infections due to coagulase negative staphylococcus (CoNs) it will be recorded as 1 infection while an episode of infection caused by Klebsiella sp and an episode caused by CoNs will be recorded as 2 infections.
As for confirmed bacteraemic infections a total of 681 infants (9.3%) experienced 726 infections. Infection rate was highest among the extremely low birthweight babies with an incidence of 16.4 %.
Types of infecting organisms in bacterial blood-stream infections (BSI) are as shown in Fig 11.
Fig 11. Types of infecting organisms in confirmed bacterial sepsis, 2004
0 50 100 150 200
The most common was Coagulase-negative Staphylococcus (CoNS) which accounted for 171 (23.5%) of the 726 infections. Of the Gram-negative infections Klebsiella species was the most common accounting for 94 (12.9%) infections. There were 26 (3.6%) infections due to extended spectrum beta lactamase (ESBL) producing organisms. The specific ESBL organisms were not specified but many were likely to be Klebsiella sp too.
No of infections
Total infections: 726 (100%)
Grp D strep : 7 (1.0%)
Enterococcus sp : 8 (1.1%)
Staphylococus aureus : 23 (3.2%) Grp B strep : 74 (10.2%) MRSA : 134 (18.5%) CoNS : 171 (23.5)
Stenotrophomonas maltophilia : 6 (0.8%)
Escherichia coli : 22 (3.0%) Miscellaneous 70 (9.6%) included
Aeromonas sp, Citrobacter sp.,
Bulkhoderia sp, Bacillus sp,
Flavobacterium sp, H influenza,
3.7 Outcome
The overall survival at discharge of this high risk group of babies was 5624 (out of 7350) ie 76.5%. (Table 27) Survival is dependent on many factors including gestational age and birthweight. No babies of gestation 22 weeks and below and no babies of BW <500gms survived. Up to 31 weeks and up to 1500gms survival improved progressively with increasing gestation and BW. (Table 28) Babies who were 32 weeks and above and babies of BW > 1500gms were entered into the study only if they had required ventilatory support or had died, hence the survival were rather low in these more mature and bigger babies.
Nearly half (49.5%) of babies of 26 weeks’ gestation survived and slightly more than half (53.1%) of babies with BW 801-900 grams survived. (Table 27 and Table 28)
Overall survival of BW groups and gestation groups are as shown in Fig 12 and survival of VLBW and very preterm babies are as shown in Fig 13 and Fig 14.
Fig 12. Survival according to birthweight and gestational age group, 2004
0 20 40 60 80 100
BW group Gestational age group
* Babies with gestation of 32 weeks and above and birthweight > 1500g were in the study only if they were ventilated or had died, hence survival was not as high as it otherwise would have been.
% Survival
501-1000g 22-27 weeks
1001-1500g 28-31 weeks
1501-2500g 32-36 weeks
Fig 13. Survival according to BW group for VLBW babies (BW up to 1500g), 2004
0
9 16 34
53 65
74
84 87 88 88
0 20 40 60 80 100
<501 501- 601- 701- 801- 901- 1001- 1101- 1201- 1301
1401-Fig 14. Survival according to gestation for very preterm babies (gestation <32 weeks) 2004
0 4
13 31
50
62 69
80 84 90
0 20 40 60 80 100
22 23 24 25 26 27 28 29 30 31
% Survival
Gestation in weeks % Survival
3.7.1 Perinatal and Neonatal Mortality Rates
These are important indicators of both obstetric and neonatal outcomes.
The births are obtained by records of all births in the hospitals of each neonatal unit and the mortality rates are calculated pertaining to that for inborn babies only.
Perinatal mortality rate =
No stillbirths + neonatal deaths < 7 days (BW 500gm and above
or gestation 22 weeks and above x 1000 TBs No total births (TBs)
Early Neonatal mortality rate
No neonatal deaths < 7 days (BW 500gm and above
or gestation 22 weeks and above x 1000 LBs No live births (LBs)
Neonatal mortality rate
No neonatal deaths < 28 days (BW 500gm and above
or gestation 22 weeks and above x 1000 LBs No live births (LBs)
Fig 14 shows the number of total births and neonatal deaths in all the centres in the study. The perinatal, early neonatal and neonatal mortality rates were calculated to be 14.3 per 1000 TBs, 4.8 and 6.2 per 1000 LBs respectively.
Fig. 15. Total births and neonatal deaths and mortality rates, 2004
Total Births 196824 No Stillbirths 1884 No Live births 194940
Inborn deaths <7 days (early neonatal deaths) 934 Inborn deaths < 28 days (neonatal deaths) 1209
Perinatal mortality rate 14.3 per 1000 TBs Early neonatal mortality rate 4.8 per 1000TBs Neonatal mortality rate 6.2 per 1000 LBs
3.7.2 Discharge
Babies are usually discharged straight home from the participating NICUs in the hospital. Some may have been discharged from a paediatric ward following extended care after NICU stay (e.g. babies with prolonged oxygen requirement) or rarely transferred elsewhere.
The duration of hospital stay is dependent on many factors especially gestational age and birth weight and whether babies survived.
Of all the babies (1726) who died 642 (37.2%) died within 24 hours. For those who died after the 1st day mean duration of hospital stay were 15.0 +/- 26.2 days.
Of the survivors some stayed for < 24 hours (either discharged at own risk or had very mild illnesses). Of the other survivors the mean duration of hospital stay was 26.3 +/- 25.0 days. (Table 29 and Table 30) The duration of hospital stay for survivors decreased with increasing gestation and BWs. Fig 16.
Fig 16. Mean duration of hospital stay for survivors who stayed beyond 24 hours according to gestational age and BW group, 2004
0 20 40 60 80 100 120
22/501 24/701 26/901 28/1101 30/1301 32/1501 34
# ## Stay in days
Gestation in weeks/ BW groups in grams
Foot note
4. Tables
Table 1. Use of antenatal steroids according to gestational age group, 2004
Gestational age (weeks) Babies in study Antenatal steroid given
No. No. %
22 9 0 0
22-24 168 48 29
25-27 601 354 59
< 28 778 402 52
28-31 1744 1117 64
<32 2522 1519 60
32 -33 1107 700 63
<34 3629 2219 61
34 and above 3721 462 12
All gestation 7350 2681 36
Table 2. Inborn-outborn distribution according to the birthweight group, 2004
Birthweight group
(grams) Babies in study Inborn Outborn
No. No. % No. %
All cases 7350 5819 79 1531 21
BW up to 500 38 36 95 2 5
BW 501-1500 2753 2252 82 501 18
Table 2a. Inborn-outborn distribution according to gestational age and birthweight group, 2004
Birthweight group (grams) and
gestational age (weeks) Babies in study Inborn Outborn
No. No. % No. %
All cases 7350 5819 79 1531 21
Up to 500 38 36 95 2 5
BW 501-1500 2753 2252 82 501 18
BW 501-1000 907 750 83 157 17
Gestation 22 -33 3620 2974 82 646 18
Gestation 22-31 2513 2048 81 465 19
Table 2b. Growth status at birth according to gestational age group, 2004
Babies in
study SGA AGA LGA
For survivors mean weight on discharge +/- SD in
grams
No. No. % No. % No. %
All babies in
study 7350 1277 17 5819 79 254 3 2315 735
Babies 22 -31 weeks
gestation 2513 374 15 2083 83 56 2 1841 422
Babies
501-1500g 2753 762 28 1983 72 8 0 1813 414
Babies 32-36 weeks
gestation 2328 539 23 1740 75 49 2 2041 478
Babies 37 weeks and
Table 3. Ventilatory support according to gestational age group, 2004
Table 3a. Ventilatory support according to birthweight group, 2004
Birthweight group
(grams) Babies in study
Babies with ventilatory support
Babies with CPAP alone
No. No. % No. %
Up to 500 38 10 26 3 8
501-1000 907 686 76 90 10
1001-1500 1846 1315 71 230 12
1501-2500 2315 2121 92 493 21
2501 and above 2244 2178 97 331 15
All cases 7350 6310 86 1147 16
Gestational age
(weeks) Babies in study
Babies with ventilatory support
Babies with CPAP alone
No. No. % No. %
<22 9 1 11 0 0
22-27 769 567 74 66 12
28-31 1744 1416 81 232 16
32-36 2328 1967 84 508 26
37 and above 2500 2359 94 341 14
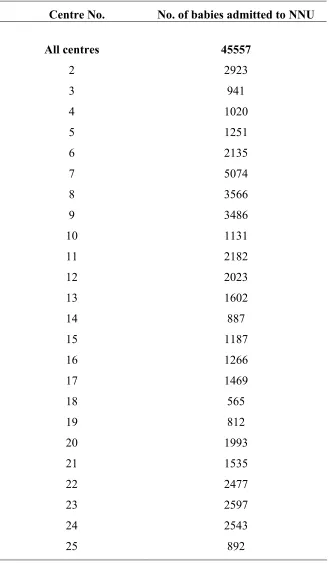
Table 4. Total NICU admissions according to centre (based on census returns), 2004
Centre No. No. of babies admitted to NNU
All centres 45557
2 2923
3 941
4 1020
5 1251
6 2135
7 5074
8 3566
9 3486
10 1131
11 2182
12 2023
13 1602
14 887
15 1187
16 1266
17 1469
18 565
19 812
20 1993
21 1535
22 2477
23 2597
24 2543
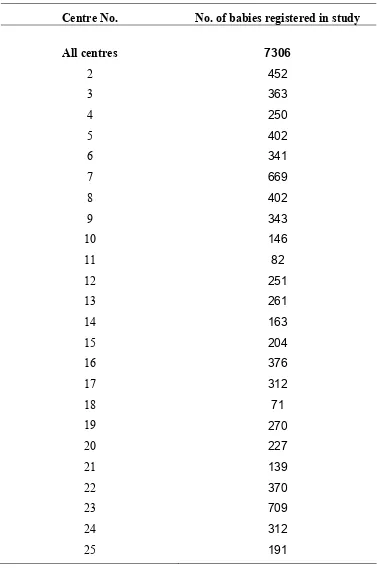
Table 5. Bably distribution (babies admitted into study) according to centre, 2004
Centre No. No. of babies registered in study
All centres 7306
2 452
3 363
4 250
5 402
6 341
7 669
8 402
9 343
10 146
11 82
12 251
13 261
14 163
15 204
16 376
17 312
18 71
19 270
20 227
21 139
22 370
23 709
24 312
Table 6. Ethnicity according to birthweight group, 2004
Table 7. Baby distribution and survival according to mother’s marital status, 2004
Marital status
Babies in study
Babies who survived
Babies with gestation <32
weeks
Babies with gestation <32 weeks who
survived
No. No. % No. No. %
Overall 7350 5624 77 2522 1745 69
Married 7229 5534 77 2465 1705 69
Divorced 9 3 33 5 2 40
Widowed 3 2 67 0 0 0
Single 109 85 78 52 38 73
Ethnic groups
Babies in
study BW 501-1000 BW 1001-1500 BW 1501-2500
BW 2500 and above
No. No. % No. % No. % No. %
Malay 4731 561 12 1080 23 1527 32 1537 32
Chinese 778 99 13 217 28 253 33 206 26
Indian 643 112 17 180 28 189 29 154 24
Orang Asli 101 7 7 29 29 45 45 19 19
Bumiputra
Sabah 296 39 13 102 34 80 27 74 25
Bumiputra
Sarawak 327 41 13 117 36 87 27 80 24
Foreigner 439 41 9 113 26 122 28 161 37
Other
Malaysian 35 7 20 6 17 10 29 12 34
Table 8. Maternal age, mean birthweight, mean gestational age, duration of
ventilatory support and duration of hospital stay according to birthweight group, 2004
Table 9. Multiplicity of births according to gestational age group, 2004
Gestational
age (weeks) Babies in study Singletons Twins Triplets Others
No. No. % No. % No. % No. %
<22 9 9 100 0 0 0 0 0 0
22-27 769 648 84 109 14 12 2 0 0
28-31 1744 1488 85 234 13 22 1 0 0
32-36 2328 2096 90 212 9 19 1 1 0
37 and above 2500 2455 98 44 2 1 0 0 0
Total 7350 6696 599 54 1
Babies in study
BW 501-1000
BW 1001-1500
BW 1501-2500
BW 2500 and above
Mean SD Mean SD Mean SD Mean SD Mean SD
Mean maternal age
+/- SD in years 30 7 29 6 29 7 30 7 31 6
Mean birth weight
+/- SD in grams 2014 906 822 142 1293 141 1972 290 3161 463
Mean gestation +/-
SD in weeks 34 5 27 3 31 3 34 3 39 2
For >=24hours of ventilatory support mean duration of ventilation +/- SD in days
Table 10. Mode of delivery according to gestational age group, 2004
Table 10a. Mode of delivery according to birthweight group, 2004
Table 11. Mean CRIB score and mortality rate according to centre, 2004
• CRIB score not available for 133 babies with BW 501-1500gm Centre No
No of babies with
BW < 1500 grams Mean CRIB score (SD)
No of babies with BW < 1500 grams who
died %
All centres 2620 4 4 806 31
2 167 5 4 52 31
3 136 2 2 40 29
4 64 5 5 21 33
5 156 4 3 49 31
6 116 5 4 46 40
7 233 4 4 73 31
8 102 4 3 42 41
9 135 5 4 42 31
10 56 5 4 22 39
11 27 6 4 8 30
12 99 4 4 31 31
13 63 5 4 20 32
14 70 5 4 21 30
15 94 6 8 34 36
16 155 4 3 33 21
17 116 5 5 34 29
18 29 2 2 7 24
19 113 3 4 30 27
20 79 4 4 25 32
21 52 1 2 14 27
22 110 3 3 19 17
23 240 4 4 80 33
24 151 4 4 41 27
Table 12. Ventilatory support mode according to gestational age group, 2004
(part 1)
* Exclude those with CPAP/ HFOV/ NO/ others
Table 12a. Ventilatory support mode according to birthweight group, 2004
Birthweight group (grams)
Babies with IMV or IMV + PTV or
* Exclude those with CPAP/ HFOV/ NO/ others Gestational age
(weeks)
Table 12b. Ventilatory support mode according to gestational age group, 2004 (part 2)
Gestational age (weeks)
Babies
Admitted CPAP IMV IMV + PTV
No. No. % No. % No. %
All babies 7350 2537 35 4383 60 615 8
<22 9 0 0 1 11 0 0
22-27 769 245 32 406 53 75 10
28-31 1744 739 42 1004 58 151 9
32-36 2328 959 41 1284 55 128 5
37 and above 2500 594 24 1688 68 261 10
Gestational age
(weeks) HFPPV HFOV Nitric Oxide Others
No. % No. % No. % No. %
All babies 80 1 146 2 25 0 50 1
< 22 0 0 0 0 0 0 0 0
22-27 8 1 34 4 1 0 4 1
28-31 24 1 32 2 2 0 14 1
32-36 25 1 25 1 5 0 15 1
Table 13. Duration of ventilatory support (VS) according to gestational age group,
Table 14. Respiratory distress syndrome (RDS) according to gestational age group,
2004
Gestational age (weeks)
Babies in
study Babies with RDS
Babies with RDS requiring VS
Babies with RDS who died
No. No. % No. % No. %
<22 9 4 44 0 0 4 100
22-27 769 564 73 491 87 296 52
28-31 1744 1279 73 1164 91 213 17
32-36 2328 1180 51 1101 93 85 7
37 and above 2500 111 4 111 100 9 8
All cases 7350 3138 43 2867 91 607 19
Table 14a. Respiratory distress syndrome (RDS) according to birthweight group,
2004
Birthweight group (grams)
Babies in
study Babies with RDS
Babies with RDS requiring VS
Babies with RDS who died
No. No. % No. % No. %
Up to 500 38 13 34 7 54 13 100
501-1000 907 674 74 591 88 354 53
1001-1500 1846 1195 65 1043 87 165 14
1501-2500 2315 1127 49 1097 97 67 6
2501 and above 2244 129 6 129 100 8 6
Table 15. Congenital pneumonia according to gestational age group, 2004
Table 15a. Congenital pneumonia according to birthweight group, 2004
Birthweight group (grams)
Babies in study
Babies with congenital pneumonia
Babies with congenital pneumonia requiring VS
Babies with congenital pneumonia who died
No. No. % No. % No. %
Up to 500 38 0 0 0 0 0 0
501-1000 907 30 3 30 100 9 30
1001-1500 1846 113 6 89 79 12 11
1501-2500 2315 311 13 304 98 29 9
2501and above 2244 516 23 516 100 48 9
All cases 7350 970 13 939 97 98 10
Gestational age (weeks)
Babies in study
Babies with congenital pneumonia
Babies with congenital pneumonia requiring
VS
Babies with congenital pneumonia who died
No. No. % No. % No. %
<22 9 0 0 0 0 0 0
22-27 769 24 3 23 96 6 25
28-31 1744 103 6 92 89 14 14
32-36 2328 322 14 304 94 22 7
37 and above 2500 521 21 520 100 56 11
Table 16. Meconium aspiration syndrome (MAS) according to gestational age group, 2004
Table 16a. Meconium aspiration syndrome (MAS) according to birthweight group,
2004
Birthweight group (grams)
Babies in
study Babies with MAS
Babies with MAS requiring VS
Babies with MAS who died
No. No. % No. % No. %
Up to 500 38 0 0 0 0 0 0
501-1000 907 0 0 0 0 0 0
1001-1500 1846 7 0 6 86 0 0
1501-2500 2315 75 3 72 96 15 20
2501 and
above 2244 470 21 466 99 76 16
All cases 7350 552 8 544 99 91 16
Gestational age (weeks)
Babies in
study Babies with MAS
Babies with MAS requiring VS
Babies with MAS who died
No. No. % No. % No. %
<22 9 0 0 0 0 0 0
22-27 769 0 0 0 0 0 0
28-31 1744 4 0 3 75 0 0
32-36 2328 33 1 31 94 6 18
37 and above 2500 515 21 510 99 85 17
Table 17. Neonatal encephalopathy (NE) according to gestational age group, 2004
Table 17a. Neonatal encephalopathy (NE) according to birthweight group, 2004
Birthweight group (grams)
Babies in
study Babies with NE
Babies with NE requiring VS
Babies with NE who died
No. No. % No. % No. %
Up to 500 38 1 3 0 0 1 100
501-1000 907 88 10 68 77 63 72
1001-1500 1846 116 6 103 89 39 34
1501-2500 2315 281 12 269 96 85 30
2501 and
above 2244 696 31 686 99 168 24
All cases 7350 1182 16 1126 95 356 30
Gestational age (weeks)
Babies in
study Babies with NE
Babies with NE requiring VS
Babies with NE who died
No. No. % No. % No. %
<22 9 0 0 0 0 0 0
22-27 769 74 10 57 77 55 74
28-31 1744 124 7 111 90 48 39
32-36 2328 204 9 189 93 60 29
37 and above 2500 780 31 769 99 193 25