Backg
R
Senior
ground
RPJMN
r Second
Educat
Study
N
for Ed
dary, Voc
tion Fina
for the
ucation
Part 2
cational
ancing a
2015
e Prepa
n 2015
and Hig
nd Gove
aration
5 – 201
her Edu
ernance
of the
9
Back
Educ
Part 2
Educa
Publishe © 2015 ISBN: The Bac Childhoo years and The chap a small t by a ser stakehol governm The Back does not Governm Chapters recogniz quality aPart 1 c Quality A Measure Childhoo
Part 2 c Upgradin Environm
kground
cation 2
2: Senior
ation Fina
d by: M N Ja 9 kground Stu od through tod identifies ch pters were pre eam of natio ries of Focus
ders from al ment organiza kground Stud t claim to be ment of Indon s of the Stud zed that issue
ssurance imp ontains the f Assurance an
d by Nation od Education contains the ng the Skills ment for Enha
d Study
2015 -
Seconda
ancing a
Ministry of Nat National Deve
akarta 978-602-1154
dy is a serie o Higher Educ hallengesfor t epared jointly onal and inter
Groups, Wo l levels of g ation represen
dy is intended definitive and nesia nor any o y have been es such as a pact across the
following cha nd Minimum nal Exams; Q
and Develop following ch of the Labo anced Produc
y for th
2019
ary, Voca
and Gove
tional Develo elopment Plan -45-8es of chapter cation. Each c the future tog y by Bappena rnational expe rkshops and overnment, ntatives.
d to be a use d the views e other particul grouped in ccess, educa e whole secto apters: Access Service Stan Quality of Stu ment; and Te hapters: Achi or Force in I tivity in Indon
he Prep
ational a
rnance
opment Plann nning Agency
rs covering k chapter review gether with p as staff of the erts. The prep
Consultation also civil soc
eful summary expressed in t
lar organisati two books fo ation governa
or.
s to Quality E ndards for Ba udent Learni eacher Quality ieving Unive Indonesia; St nesia; Educat
aration
nd Highe
ning/ y (BAPPENAS)key issues in ws progress a roposed direc e Education an paration of th ns in Jakarta ciety membe
y document o the documen
ons.
or the ease o ance, educati
Education; Ku
asic Educatio ng as Measu y and Manage rsal 12 Years trengthening ion Financing
n of the
er Educat
n the educat nd achievem ctions. nd Religious A he Backgroun
and Regiona ers, teachers,
of achieveme t do not repr
of the reader ion financing
rikulum 2013
n; Quality of ured by Inte ement.
s of Educatio Skills Provid g; and Govern
e
RPJM
tion,
ion sector fr ments over the
Affairs Directo nd Study was
al areas invo academics a
ents and chal resent the vie
r. However, it g, teacher qu
3; Character E f Student Lea ernational Te
on; Higher E ders and the nance and Ed
MN
for
rom Early e past five
orate and enriched lving key and
non-llenges. It ews of the
Background Study for the Preparation of the
RPJMN
for Education 2015 – 2019
Part 2
Senior Secondary, Vocational and Higher Education
Foreword
We give praise to God the Almighty for blessing us in the completion of the Background Study for the Preparation of the RPJMN for Education Plan 2015-2019. This analytic work serves as one of the inputs for the development of the Technocratic Draft of the Plan (RPJMN) and will guide our efforts to constantly improve the quality of education for all Indonesians.
The overall approach to the Background Study has been to review current achievements, challenges faced, policy options and proposed directions for each sub-sector - early childhood, basic, secondary, vocational and higher education.
Specific issues examined within the sub-sectors included: access to quality education, review of the inputs to education (e.g. minimum service standards, character education and the quality of the teaching workforce); analysis of the learning outcomes (as measured by national exams and international tests); and the
environment for provision of quality education and skills training including the financing and governance of education and the role of the private sector in education, especially in vocational skills training and in higher education.
The Background Study drew on a considerable body of contemporary education research in Indonesia. Additional secondary research was commissioned to fill in gaps and to address emerging issues such as the options for universal 12 years education and strengthening skills for the labour market. The complete Background Study is the product of an iterative cycle of analysis and consultation with counterparts and stakeholders drawn from government at national and local levels, education institutions, research institutions, civil society organisations and development partners.The Study was greatly enriched by the wise counsel of present and former senior government officials and education academics.
I would like to acknowledge the contributions of the following –
Technical Coordinator:
Ir. Subandi Sardjoko, M.Sc, Ph.D. (Director of Education Bappenas)
Technical Team Members in Bappenas:
Ir. Suharti MA, Ph.D.; Drs. Amich Alhumami, MA, MEd, Ph.D.; Suprapto Budinugroho, ST, M.Eng.; Kalihputro Fachriansyah, ST; Dimas Suryo Sudarso, S.Mn.
I would also like to express my appreciation to our international partners, namely the Australian Department of Foreign Affairs and Trade (DFAT) and the World Bank for their contribution of international experts in specific topic areas. The Analytical and Capacity Development Partnership (ACDP), jointly funded by DFAT and the European Union and managed by the Asian Development Bank (ADB) also contributed experts and played a key role in managing the consultation processes, translation, printing and logistics.
Experts and Supporting Team Members:
Hetty Cislowski, Samer Al Samarrai, Susiana Iskandar, Pedro Cerdan-Infates, Andrew Ragatz, Amer Hasan, Rosfita Roesli, Cristobal Ridao-Cano, Gutama, Adam Rorris, Soebagyo Mulyodiharjo, Satryo Soemantri
It has been my pleasure to lead and work alongside this very dedicated team and to engage with and learn from the many committed and enthusiastic members of the focus groups and discussions held across Indonesia.
Finally, I would also like to express my deep gratitude and appreciation to Prof. Armida.S Alisjahbana, MA. Ph.D., Minister of National Development Planning/Chair of National Development Planning Agency (BAPPENAS) and Ir. Lukita Dinarsyah Tuwo, MA, Ph.D., Vice Minister of National Development Planning/Vice Chair of National Development Planning Agency (BAPPENAS) of the Cabinet United Indonesia II, 2009-2014, for their valuable guidance and support in the implementation of this Education Sector Review. I would also like to convey my great appreciation to Prof. DR. Fasli Jalal, Ph.D., Dr. Ir.Taufik Hanafi, MUP, Wolfgang Kubitzki Principal Social Sector Economist, Asian Development Bank and Ms Hannah Birdsey Counsellor Education and Scholarships from the Australian Department of Foreign Affairs and Trade, for their rich and valuable contributions in numerous discussions when the Background Study was first initiated and during implementation.
My earnest wish is that this document will provide guidance and direction for the government and stakeholders and that it will also stimulate continuing and robust enquiry into the very complex issues which affect the delivery of quality education for all Indonesians.
Dra. Nina Sardjunani, MA
Deputy Minister for Human Resource and Cultural Affairs,
Table of Contents Part 2
Foreword ... v
Abbreviations ... xii
Overview ... xvii
Chapter 9. Achieving Universal 12 Years of Education ... 1
Introduction ... 1
1. Why should Indonesia expand enrollment in senior secondary? ... 2
2. What are the existing challenges in senior secondary enrollment? ... 5
3. The challenges of universalizing ... 10
4. Policy directions ... 25
Chapter 10. Higher Education ... 35
1. Introduction ... 35
2. Indonesia’s achievements in higher education ... 35
3. Challenges in higher education ... 39
4. Recommended Policy directions ... 48
Appendix 1. Logical Framework for Higher Education... 56
Chapter 11. Upgrading the Skills of the Labor Force in Indonesia ... 59
1. Why worry about skills upgrading? ... 60
2. What can be done to upgrade the skills of the labor force in the short and medium term? 70 3. Policy directions ... 79
Chapter 12. Strengthening Skills Providers and the Training Environment for Enhanced Productivity in Indonesia ... 81
1. Skills and National Development ... 81
2. Improving The Quality And Relevance Of Skills Providers ... 86
3. The enabling environment, including governance and financing ... 96
4. Reducing regional disparities ... 99
5. Conclusion and policy options ... 100
Annex A. Factsheet on TVET (2012 data) ... 110
Chapter 13. Education Financing – Achieving the Goals of the Next RPJM through More Efficient and Effective
Public Spending ... 115
1. Introduction ... 115
2. Looking back over the last medium term development plan - education spending and efficiency ... 116
3. Looking forward: The importance of improved efficiency to achieve future education goals ... 123
4. Improving efficiency through better teacher management and strengthening financing mechanisms ... 125
5. The potential for improved efficiency to provide the resources necessary for sector objectives over the next RPJM ... 136
6. Conclusions ... 137
Chapter 14. Governance and Education ... 141
1. Introduction ... 141
2. Achievements in governance of education during the current period of the RPJM ... 142
3. Governance achievements in the financing of education ... 146
4. Remaining challenges ... 150
5. Proposed policy directions and strategies ... 155
List of Figures Figure 1. Public expenditure on education, 2001-2013 ... xix
Figure 2. Education participation rates, 2003-2013 ... xx
Figure 3. Share of students at each PISA proficiency level in mathematics and reading in selected countries, 2006 and 2012 ... xx
Figure 4. PISA calculations of student resilience based on the percentage of top-scoring students coming from the lowest socio-economic quartile ... xxiii
Figure 5. Estimates of student learning over six years of Primary School based on teacher knowledge vs. degree ... xxiv
Figure 6. Trends in gross enrollment rates, 2001-2013 ... 2
Figure 7. Educational attainment of the labor force, 2001-12 ... 3
Figure 8. Trends in average wage by level of education, all labor force and younger than 35, 2001-10 ... 3
Figure 9. The demand for skills is increasing ... 4
Figure 10. Education Attainment Comparing Poorest and Richest Income Quintile ... 4
Figure 11. Government spending trends by level of education ... 5
Figure 12. Share of children enrolled in school by age and quintile, 2006-2013 ... 6
Figure 13. Senior Secondary Education Enrollment by quintile, stream and type ... 6
Figure 14. Gross enrollment rates in senior secondary by province, 2007-2013 ... 7
Figure 15. Senior Secondary Education Providers Based on the Number of Students Enrolled ... 7
Figure 16a. Senior Secondary Education Providers and Student enrollment changes between 2004 and 2012 ... 8
Figure 16b. Senior Secondary Student enrollment changes over time ... 8
Figure 17. Enrollment by type of institution for the poorest 2 quintiles, 2009-2012 ... 9
Figure 18. Share of total spending by level born by households, 2009-2012 ... 9
Figure 21. Share of out of school 7 - 19 year olds by quintile, Urban and Rural Areas ... 12
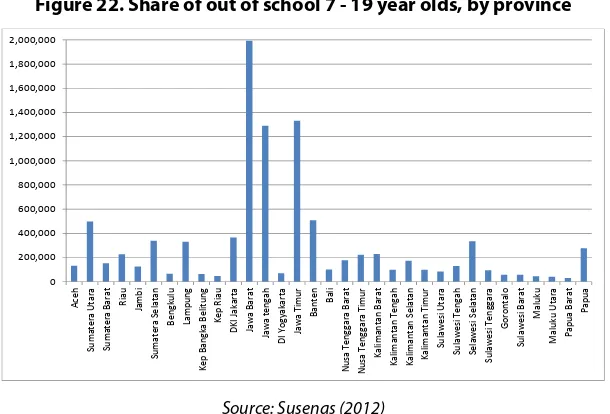
Figure 22. Share of out of school 7 - 19 year olds, by province ... 12
Figure 23. Share of out of school 7 - 19 year olds by quintile and gender ... 13
Figure 24. Distance between house and school ... 14
Figure 25. Average transportation cost per day by level of education ... 14
Figure 26. Number of Applicants and Entrants (by type of Senior Secondary School) ... 15
Figure 27. Student Class Ratio and Class to Classroom Ratio (by type of Senior Secondary School) ... 15
Figure 28. Percentage of SMAs and SMKs with laboratories and other facilities, by provider and tracks ... 16
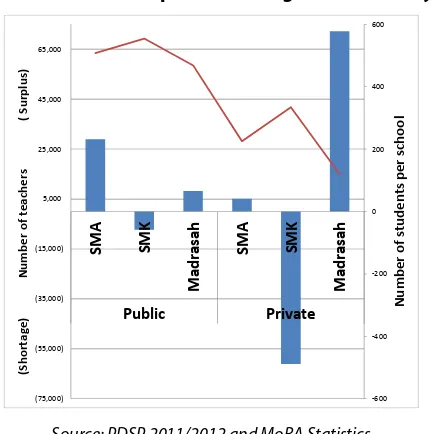
Figure 29. Number of surplus or shortage of teachers by track ... 17
Figure 30. Household education spending by level of education ... 18
Figure 31. Household expenditure in private schools is higher than in public schools ... 19
Figure 32. Share of household education spending by quintile ... 19
Figure 33. Proportion enrolled by quintile ... 19
Figure 34. Household expenditure by quintile and BSM amount ... 20
Figure 35. Average household spending by track and type of provider by quintile ... 20
Figure 36. Percentage of SMA, SMK and MA graduates who continue to higher education ... 21
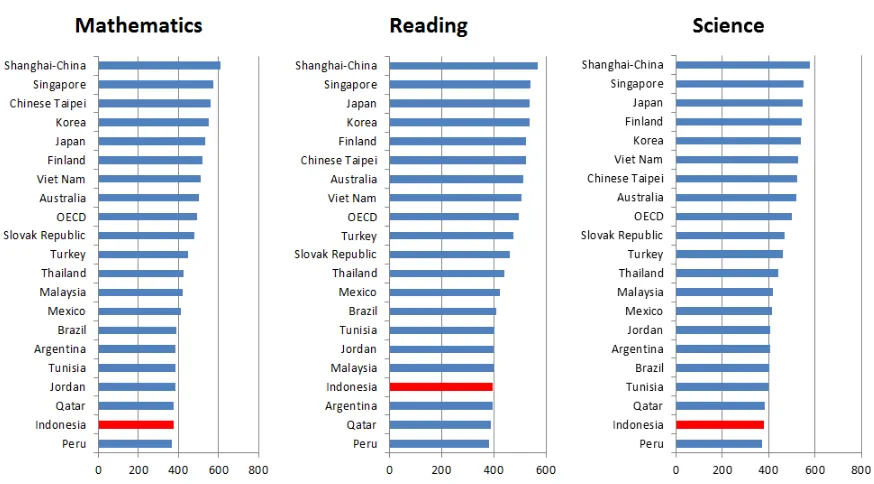
Figure 37. Average score in math science and reading, 2012 ... 21
Figure 38. Improvements in learning over recent times have been small ... 22
Figure 39. The proportion of Indonesian students leaving basic education without a strong skills base is very high ... 22
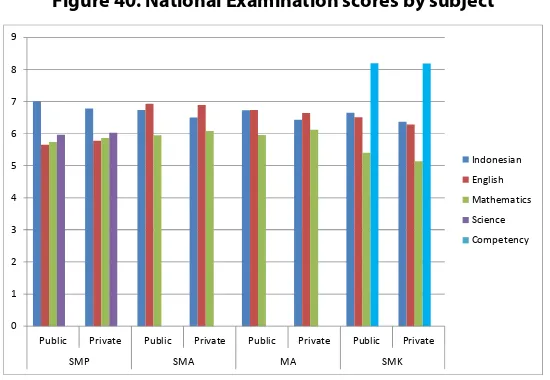
Figure 40. National Examination scores by subject ... 23
Figure 41. Share of schools accredited at each level, by stream and provider ... 24
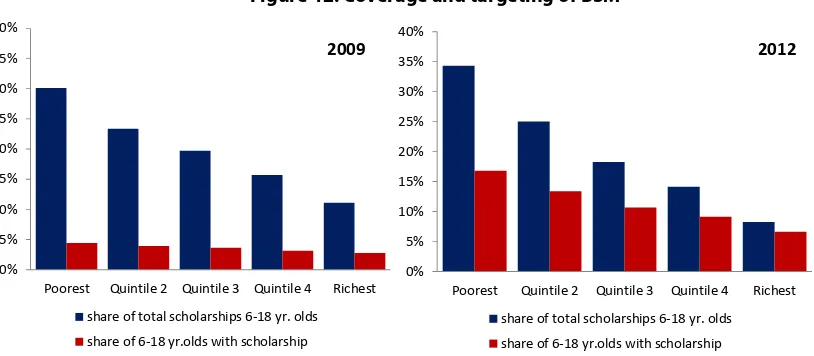
Figure 42. Coverage and targeting of BSM ... 26
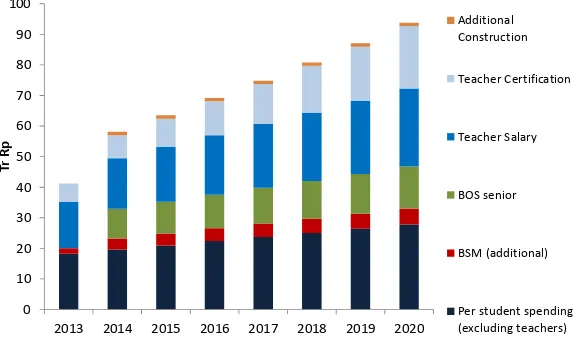
Figure 43. Cost estimates of attaining universal to 12 years of education by 2020 ... 27
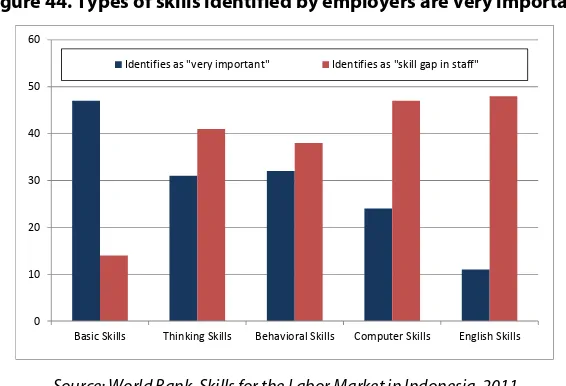
Figure 44. Types of skills identified by employers are very important ... 29
Figure 45. Unemployment Rate for SMA and SMK Graduates ... 30
Figure 46. Relative wage SMK to SMA Graduates ... 31
Figure 47. Employers Opinion of Quality of Employees with Senior Secondary Education (%) ... 31
Figure 48. Conceptualisation of mission differentiation in higher education ... 40
Figure 49. Institutional mission and its differentiated outputs ... 48
Figure 50. The demand for skills is increasing ... 61
Figure 51. Unemployment rate of 20-24 year olds. ... 61
Figure 52. Changes in skill composition of labor force and in skill premia ... 62
Figure 53. Enrollment rates by level of education, 2001-10 ... 62
Figure 54. Educational attainment by age group, 2010 ... 63
Figure 55. Labor force by level of education, 2001-2010 ... 63
Figure 56. Labor force by level of education compared to other countries in the region, 2010 ... 64
Figure 57. Share of firms identifying the task of finding workers very or rather hard, by type of job ... 65
Figure 58. Reasons for skills mismatches according to employers, 2008 ... 66
Figure 59. Unemployment rates by level of education, 20-29 year olds ... 67
Figure 60. Type of occupation for senior secondary graduates, 2001-2010 ... 67
Figure 61. Trends in returns to education, all labor force and younger than 35, 2001-10 ... 68
Figure 62. Returns to tertiary education in the public service sector, with and without education, 2001-2010 ... 68
Figure 63. Average wage of tertiary graduates working in the education by age, 2010 ... 69
Figure 64. Enrollment growth in education and non-education higher education programs, 2005-2010 ... 69
Figure 65. Projected educational composition of the labor force if enrollment targets are met in 2020 ... 70
Figure 67. Share of students at each PISA proficiency level in mathematics and reading in selected
countries, 2006 and 2012 ... 72
Figure 68. Types of skills identified by employers as very important ... 73
Figure 69. A framework of accountability of higher education institutions ... 74
Figure 70. Equivalency Program Enrollment, 2011 ... 75
Figure 71. Share of people who report having received training ... 75
Figure 72. Share of firms providing training opportunities to employees, 2009 ... 76
Figure 73. Share of firms providing in-house or outside training to staff ... 76
Figure 74. A picture of vocational education and training providers ... 77
Figure 75. A picture of the complexity of accreditation systems ... 78
Figure 76. Value Added per Worker (2005 PPP$) ... 82
Figure 77. Demographic Dividend ... 84
Figure 78. Informal Employment (age 15+, %) ... 85
Figure 79. Aligning Skills Acquisition with Skills Utilisation ... 85
Figure 80. TVET Skills Providers within Life-long Learning Framework ... 87
Figure 81. Main Weaknesses of SMKs as Perceived by Employees ... 89
Figure 82. Distribution of BLKs in Indonesia (by Region) ... 91
Figure 83. Distribution of Polytechnics in Indonesia (by Region) ... 92
Figure 84. Proportion of Higher Education Students by Fields of Study ... 95
Figure 85. Enhancing Environment for Skills Development ... 97
Figure 86. Diversified TVET financing system ... 98
Figure 87. Public and private expenditure on education, 2001-2013 ... 117
Figure 88. Public expenditure on education as a share of total government expenditure and as a share of GDP and GDP per capita, selected countries in 2010 ... 118
Figure 89. Total education spending by level of education, 2008-2013 ... 119
Figure 90. Annual household spending on education ... 120
Figure 91. Government and non-government enrolment and household spending, 2012 ... 120
Figure 92. Share of 6-22 year old children enrolled in school by age and quintile ... 121
Figure 93. Average levels of learning achievement in selected countries, 2006 and 2012 PISA ... 122
Figure 94. Share of students at each PISA proficiency level in mathematics and reading in selected countries, 2006 and 2012 ... 122
Figure 95. Budget outlook over the next RPJM ... 123
Figure 96. Cost and resource projections for the education sector, 2014-2020 ... 125
Figure 97. Student-teacher ratios in primary and secondary schools in Indonesia, 1995-2010 ... 126
Figure 98. Potential savings associated with student teacher ratio changes ... 127
Figure 99. Improving the efficiency of public spending on teachers ... 128
Figure 100. Transfers and fund flows in the education sector ... 130
Figure 101. An approximate breakdown of key sources of public education funding, 2013 ... 132
Figure 102. Composition of BOS spending in public primary schools, 2011 ... 134
Figure 103. Strengthening education financing mechanisms ... 135
Figure 104. Affordability of existing commitments with an increase in student ratios ... 137
Figure 105. The quality of local governance in 50 Indonesian districts ... 150
Figure 106. School providers by level, 2010 ... 154
Figure 107. Governance: Proposed policy directions and strategies ... 155
Table 3. Accredited study programs ... 38
Table 4. Number of Indonesian higher education institutions ... 40
Table 5. Gross Enrolment Rate (GER) by income brackets, using Susenas data ... 44
Table 6. Poverty by region in September 2012 ... 45
Table 7. Differences in key education indicators from different information sources for three districts 151 List of Boxes Box 1. Good Practice in SMK-Industry Linkages ... 89
Box 2. The Bandung Polytechnic for Manufacturing and Politeknik Aceh ... 93
Box 3. DACUM as a system for developing curriculum ... 94
Box 4. An Innovation in University and Agricultural Sector Linkages ... 94
Box 5. China: University-Industry Linkages ... 95
Box 6. The Malaysian Human Resource Development Fund (HRDF) ... 98
Box 7. Basic assumptions for the baseline cost projections ... 124
Box 8. An overview of the main mechanisms used to fund the education sector ... 130
Box 9. Assessing school based management in Indonesia ... 133
Box 10. Enhancing equity and performance through local school grants ... 134
Abbreviations
ACDP Analytical and Capacity Development Partnership AIDS Acquired Immune Deficiency Syndrome
AK Akademi Komunitas (Community Academy)
APBD Anggaran Pendapatan dan Belanja Daerah (sub-national budgets)
APBN Anggaran Pendapatan dan Belanja Nasional (central government budget) AQRF ASEAN Qualifications Reference Framework
ASEAN The Association of Southeast Asian Nations
ATMI Akademi Tehnik Mesin Industri (Technical College for Mechanical Engineering)
BAN-PT Badan Akreditasi Nasional Perguruan Tinggi (National Accreditation Board for Higher Education)
BAN-SM Badan Akreditasi Nasional Sekolah Menengah (National Accreditation Board for Senior Secondary Education)
BEC-TF The multi-donor Basic Education Capacity Trust Fund
BERMUTU Better Education through Reformed Management and Universal Teacher Upgrading
BKB Bina Keluarga Balita (Under-five Child Family Development)
BKD Badan Kepegaiwan Daerah (Regional Employment Board)
BKN Badan Kepegawaian Nasional (National Employment Board)
BLK Balai Latihan Kerja (Vocational Centres)
BLU Badan Layanan Umum (Public Service Agency)
BOPTN Biaya Operasional PTN (Operational Cost for Public University)
BOS Bantuan Operasional Sekolah (School Operational Assistance Grant)
BOSDA Bantuan Operasional Sekolah Daerah (Local School Grant)
BPKB Balai Pengembangan Kegiatan Belajar (Center for Learning and Development Activities) BRIICS Brazil, Russia, India, Indonesia, China and South Africa
BSM Bantuan Siswa Miskin (Program of assistance for poor students)
BSNP Badan Standar Nasional Pendidikan (National Education Standards Agency) CAS Creativity, Action, Service
CIMU Central Independent Monitoring Unit CME Civics and Moral Education
CPD Continuous Professional Development Program
CREATE Consortium for Research on Educational Access, Transitions and Equity CSR Corporate Social Responsibility
DACUM Develop A Curriculum
DAK Dana Alokasi Khusus (Special Allocation Fund)
DAPODIK Data Pokok Pendidikan (School Self Evaluation and Essential School Data)
DAU Dana Alokasi Umum (General Allocation Fund)
DBH Dana Bagi Hasil (Shared Fund)
DFID UK Department for International Development DGHE The Directorate-General of Higher Education
DID Dana Insentif Daerah (Regional Incentive Fund)
DITJEN DIKTI Direktorat Jenderal Pendidikan Tinggi (Directorate General of Higher Education)
DIPA Daftar Isian Penggunaan Anggaran (Ministry Budget Implementation Documents)
DISNAKER Dinas Tenaga Kerja (Local Government Labour Office)
EAP East Asia and Pacific
EBTANAS Evaluasi Belajar (national exam prior to the current Ujian Nasional). ECER The Early Childhood Environment Rating Scale
EMIS Education Management Information Systems EQAS Education Quality Assurance System
ESCS Economic, Social and Cultural Status
EU European Union
GDP Gross Domestic Product
GER Gross Enrollment Ratio
GoI Government of Indonesia
GPI Gender Parity Index
GRDP Gross Regional Domestic Product
GTT Guru Tidak Tetap (Public school-hired teachers)
GTY Guru Tetap Yayasan (Permanent foundation-hired teachers HI ECED Holistic and Integrated Early Childhood Education Development HIV The Human Immunodeficiency Virus
HPEQ Health Professional Education Quality
HRDF Human Resource Development Fund
ICCS International Civics and Citizenship Study ICT Information, Communication and Technology
IDR Indonesian Rupiah
IEA International Education Association
IGTKI Ikatan Guru Taman Kanak-kanak Indonesia (Association of non-formal ECED and Kindergarten teachers)
ILEGI Indonesian Local Education Governance Indicator IMF International Monetary Fund
INAP Indonesian National Assessment Program
INPRES SD Instruksi Presiden untuk Sekolah Dasar (Presidential instruction for the elementary school construction program)
INSTIPER Institut Pertanian STIPER Yogyakarta (Yogyakarta Institute of Agriculture)
IPB Institut Pertanian Bogor (Bogor Institute of Agriculture)
ITB Institut Teknologi Bandung (Bandung Institute of Technology)
ITS Institut Teknologi Surabaya (Surabaya Institute of Technology)
JPS Jaringan Pengaman Social (Social Safety Net)
KB Kelompok Bermain (Play Group)
KKG Kelompok Kerja Guru (Teacher Working Group)
KTSP Kurikulum Tingkat Satuan Pendidikan (School-based curriculum development)
LAM Lembaga Akreditasi Mandiri (Independent accreditation agencies)
LKP Lembaga Keterampilan & Pendidikan (Institute for Skills development and Education)
LMIC Lower middle income
LMS Learning Management System
LPMP Lembaga Penjaminan Mutu Pendidikan (Institutes for Education Quality Assurance)
LPTK Lembaga Pendidik dan Tenaga Kependidikan (Teacher Pre-service Training Institutes)
ME Monitoring and Evaluation
MenPanRB Menteri Pendayagunaan Aparatur Negara (Minister of State Apparatus and Bureaucratic Reform)
MET Measures of Effective Teaching
MGMP Musyawarah Guru Mata Pelajaran (Subject Teachers Forum)
MI Madrasah Ibtidayah (private Islamic elementary school) MoEC Ministry of Education and Culture
MoF Ministry of Finance
MoMT Ministry of Manpower MOOC Mass Open Online Courses
MoRA Ministry of Religious Affairs
MoU Memorandum of Understanding
MP3EI Masterplan for Acceleration and Expansion of the Indonesia Economic Development
MSS Minimum Service Standards
MT Madrasah Tsanawiyah (private Islamic junior secondary school)
MWA Majelis Wali Amanat (Board of Trustees)
NER Net Enrolment Ratio
NGO Non-Governmental Organization
NPSD National Program for Skills Development NQF National Qualifications Framework NSPK Norms, Standards, Procedures and Criteria
NUPTK Nomor Unik Pendidik dan Tenaga Kependidikan (Teachers’ unique ID number)
DL Open and Distance Learning
OECD The Organisation for Economic Co-operation and Development OMR Optical Mark Recognition
P2TKPAUDNI Pembinaan Pendidik dan Tenaga Kependidikan, Pendidikan Anak Usia Dini, Non-formal dan Informal (Professional Development program for educators and personnel in the ECED, Non-formal Education and Informal Education sectors)
P4TK Pusat Pengembangan Pemberdayaan Pendidik dan Tenaga Kependidikan (Centres for Development and Empowerment of Teachers and Education Personnel)
PBPU Program Bantuan Peningkatan Mutu (Quality Enhancement Support Program)
PBS Pengakuan Sebelum Belajar (Recognition of prior learning)
PE Physical Education
PEDP Polytechnic Education Development Project
PENS Politeknik Elektronika Negeri Surabaya (Surabaya National Electronics Polytechnic)
PerMenPanRB Peraturan Menteri PANRB (Regulation from the Minister for State Apparatus and Bureaucratic Reform)
PIRLS Progress in International Reading Literacy Study PISA Program for International Student Assessment
PKG Penilaian Kinerja Guru (annual appraisal of work performance)
PMDK-PN Penelusuran Minat dan Kemampuan Politeknik Negeri (national selection for public polytechnics by invitation)
PMU Program Menengah Universal (Program for universal 12 years education)
PNS Pegawai Negeri Sipil (civil servant)
PODES Pendataan Potensi Desa (Statistical indicator of village potential)
PolMan Politeknik Manufaktur (Polytechnic for the manufacturing industries)
POM Performance Oversight and Monitoring (for the DFAT Education Partnership Program)
Posyandu Pos Pelayanan terpadu (Integrated Services Post)
PP Peraturan Presiden (Presidential Decree)
PPAS Program Peningkatan Akses (Program to increase access to junior secondary education)
PPP Public–Private Partnerships
PTN-BH Perguruan Tinggi Negeri-Berbadan Hukum (Autonomous university)
QA Quality Assurance
QSL Quality of School Life questionnaire
RENSTRA Rencana Strategis (strategic plan) RCGP Central Government within the Province
ROHIS Kelompok Rohani Islam (Islamic Student Spiritual Mentors)
RSBI Rintisan Sekolah Berbasis Internasional (International Standard Pilot School)
SD Sekolah Dasar (Elementary School)
SMA Sekolah Menegah Atas (Academic Senior Secondary School) SME Small to Medium Enterprise
SMK Sekolah Menengah Kejuruan (Vocational Senior Secondary School)
SMP Sekolah Menegah Pertama (Junior Secondary School)
SNMPTN Seleksi Nasional Masuk Perguruan Tinggi Negeri (National Entrance Test for Public Universities)
SPN Standar Pendidikan Nasional (National Education Standards) SSC Sector Skills Councils
SSE School Self Evaluation SSN National Standard Schools
Susenas Survei Sosial dan Ekonomi Nasional (National Social and Economic Survey)
TAPP The Aceh Politeknik Program
TIMSS Trends in International Mathematics and Science Study
TK Taman Kanak-Kanak (Kindergarten) TMOE Taiwan Ministry of Education
TP Tugas Pembantuan (Assistance Task)
TPA Day Care Center
TVET Technical and Vocational Sector
UAS Ujian Akhir Nasional (National Exams)
UGM University of Gajah Mada UI University of Indonesia
UK United Kingdom
UKG Uji Kompetensi Guru (Competency Testing)
UKK Promotion Examination
UN Ujian Nasional (National Exam)
UNESCAP The Economic and Social Commission for Asia and the Pacific UNESCO The United Nations Educational, Scientific and Cultural Organization
UT Universitas Terbuka (Open University)
UU Undang Undang (Law/Legislation)
WB The World Bank
Overview
The role of education in achieving the broader goals of the RPJMN
Education can play a key role in achieving the overarching goal of the RPJMN for inclusive and sustainable development. Underlying this goal are three key principles. First, the plans outlined in the RPJM must be economically feasible and support strong economic growth. Second, the development path over the next five years must be socially acceptable. It will need to improve social harmony, encourage community participation and narrow inequalities across regions and between socio-economic groups. A third key principle underlying the RPJM is the need for greater sustainability and the need to protect the environment for future generations. A strong, vibrant and good quality education system can support all of these underlying principles.
The education sector can contribute to the improvements in economic productivity required to sustain higher rates of economic growth. The provision of good quality education can equip all citizens with the skills the economy needs to raise productivity and prosper in a region that is becoming increasingly more competitive. Recent international research shows that ensuring all children leave school with strong foundation skills can raise annual per-capita growth by up to one percentage point. This shows the importance of the role that education can play in supporting the transformation necessary if Indonesia is to maintain its strong record of economic growth and avoid the middle-income trap other countries have fallen into.
A strong and good quality education system can also lay the foundation for more inclusive development. Over the last five years, income inequality has been growing across regions and between different groups in Indonesia.Disparities in access to education are likely to be an important causal factor driving these growing inequalities. Failure to tackle this growing inequality has the potential to both lower future economic growth and also sow the seeds of future social tensions. Providing good quality educational opportunities to all children, regardless of the circumstances that they are born into, can reduce inequality and give children the skills they need to participate constructively in Indonesia’s economy and its lively democracy.
Education can also be an important vehicle for promoting social harmony and building an environmentally responsible nation. It has a vital role to play in promoting social cohesion and building a peaceful and secure Indonesia. Schools can provide children with the skills and understanding needed to live peacefully and to build an awareness and tolerance of the religious, ethnic and linguistic diversity of Indonesia.Schools can also be used to highlight the importance of sustainability and to foster personal behavior that protects the environment for future generations. The education system can also support the development of the skills needed to encourage the necessary innovations to better adapt to the impacts of environmental change that will be seen in the coming years.
Key strategies to underpin the steps towards 12 years quality education
Ensuring all children receive 12 years of good quality primary and secondary education is a key step towards Indonesia’s objective of inclusive and sustainable development. A good quality primary and secondary education system provides the basic cognitive and behavioral skills that employers are demanding and which labor market entrants increasingly need to be successful. It also provides young adults with a strong foundation to continue their studies to the tertiary level. While there are many strategies that will be needed to universalize access to 12 years of education they may be seen to fall under 4 main areas:
1. Raising the quality of primary and secondary education. Despite a considerable reform effort, international assessments of student achievement show that the quality of the education system remains low. Efforts to improve the quality of education need to be reinvigorated otherwise universalizing access to 12 years of education will not bring about the expected benefits in terms of development. While the required focus of quality improvement is in primary and secondary schools it is also important to strengthen early childhood development to ensure children are ready to learn when they start primary school.
2. Increasing equitable access to senior secondary schooling. There are approximately 6 million children who do not complete 12 years of education. The challenge of extending opportunities to these children is enormous and will require a combination of increased supply as well as a range of demand side measures to support children from poor households.
3. Improving access to good quality educational opportunities for all. In order to universalize access to 12 years of good quality education it is vital to develop effective strategies to support regions and population groups that lag behind. Despite significant gains in educational attainment amongst poor and vulnerable households over the last 10 years, a concerted effort is still required to reach children that are being left behind.
4. Raising the efficiency of the education system. Efforts to raise levels of attainment and increase the quality of education will not be successful without adequate investment. However, a large part of the required investment will need to be realized from efficiency savings in the current education budget as well as strengthening partnerships with the private sector.
Strategies aimed at achieving good quality primary and secondary education can also support the RPJMN
goals for tertiary education. Increasing demand for tertiary education graduates in the labor market implies a need to expand access. In particular, the overarching RPJMN goal of inclusive development places a priority on expanding tertiary access for the poorest households. In order to do this, it is vital that children from poor and vulnerable families are able to complete a full cycle of good quality primary and secondary education. Ensuring that the governance of tertiary education institutions enables good quality provision that is relevant for the labor market, is also a critical challenge for the RPJMN.
Achievements in the education sector over the last 5 years
Across all subsectors of education services, the government also developed processes for quality assurance including introduction of minimum service standards, expansion of the program for accreditation of the school and higher education sectors, new laws for governance of the higher education sector, performance assessment of teachers and the framework for continuous professional development (CPD) of principals.
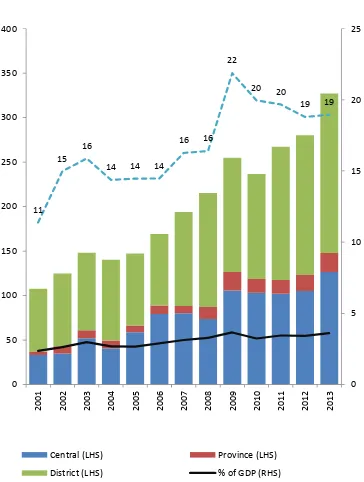
Despite significant global turmoil in 2008, the reforms above were backed up with substantial increases in public education investments. In 2009, a constitutional obligation to devote a fifth of the national budget was achieved for the first time. This resulted in a more than doubling of public education spending in real terms between 2001 and 2009, a rate seen in few other countries. Since then, public investment in education has continued to grow rapidly. Over the last four years (2009-2013), increases in the overall national budget have supported annual growth in public education spending of about 6.5 percent in real terms (Figure 1).
So far the reforms and increases in public investment have led to an expansion of educational opportunities, particularly for the poorest children. Universal primary enrolment has largely been achieved and by 2013, almost all children, including the poorest were in school between the
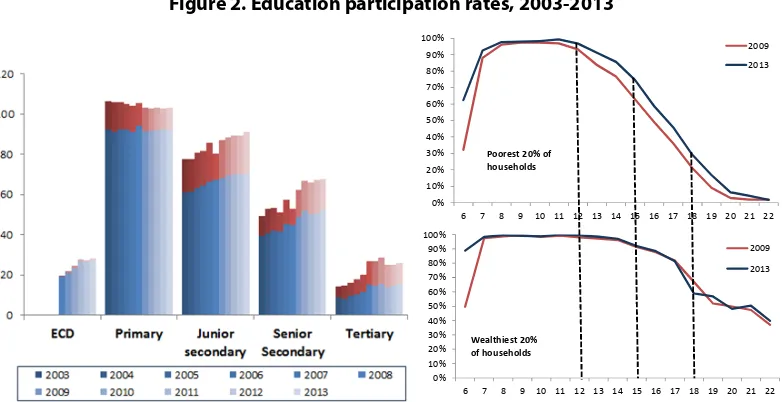
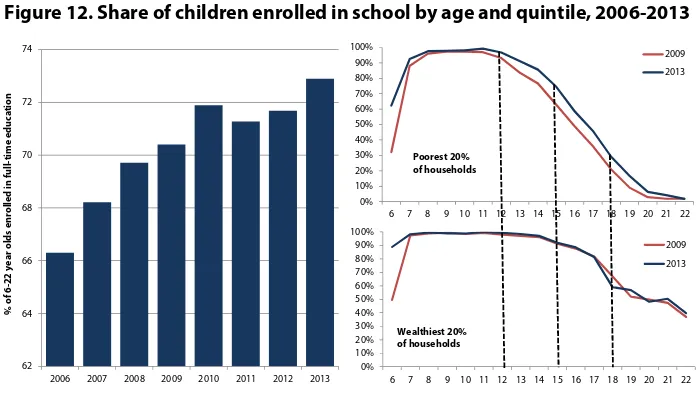
ages of 7 and 12. Enrolment rates in secondary schooling also increased significantly (Figure 2) and are now comparable to other lower middle income countries. Enrolments in tertiary education have continued to rise. Overall, the share of 6 -22 year olds that are enrolled in education has increased from 66 percent in 2006 to 73 percent in 2013. This means that since the beginning of the current RPJM (2010) an additional 7 million children and young adults have enrolled in the education system.
The improved participation rate has been driven mainly by the increased participation in education of the poorest households and has led to significant reductions in educational inequality (Figure 2). While enrolment for the wealthiest children has remained high and largely unchanged over the current RPJM, enrolment rates for children from the poorest households have increased significantly. For example, the share of 15 year olds in the poorest 20 percent of Indonesian households enrolled in school has increased from 63 percent to 74 percent between 2009 and 2013. A similar trend for poor and wealthy households can be observed for later ages and illustrates the reduction in inequality seen over this period. However, significant enrolment gaps remain. For example, in 2013, 59 percent of 18 year-olds in the wealthiest households were still in school compared to 29 percent in the poorest households.
Figure 1. Public expenditure on education, 2001-2013
Source: 2010-2013 revised plan budget laws, MoF, BPS for Susenas and GDP and CPI deflators
11 15
16
14 14 14 16 16
22 20 20
19 19
0 5 10 15 20 25
0 50 100 150 200 250 300 350 400
20
01
20
02
20
03
20
04
20
05
20
06
20
07
20
08
20
09
20
10
20
11
20
12
20
13
Percent IDR Trillion (2012 Prices)
Figure 2. Education participation rates, 2003-2013
Source: Susenas, 2003-2013
While increased investment has led to some notable achievements in increasing educational opportunity, changes in learning achievement have been more mixed. The teacher law and the certification program have increased the proportion of teachers with a bachelor’s degree from 36% to 63% between 2006 and 2012. This improvement in teacher qualifications is expected to improve the quality of teaching in the long-term. However, Indonesia has performed relatively poorly in international learning assessments when compared to other countries. For example, Indonesia fell below other countries in the region such as Thailand and Malaysia in the 2012 OECD PISA assessment. Trends in learning also show a mixed picture. Since 2006, learning achievement amongst Indonesian 15-year olds has improved in Reading but has not shown improvement in Mathematics and Science.
Average levels of learning also hide significant differences across countries in mathematics and reading proficiency levels (Figure 3). In Indonesia, the majority of 15 year-olds fall below level 2 proficiency, a level that is associated, in some countries, with difficulties for students wishing to continue into higher education or transition into the labor force. In 2012, three-quarters of Indonesian students were at level 1 or below where students are able to do ‘very direct and straightforward mathematical tasks, such as reading a single value from a well-labeled chart or table’. Trends also suggest a drop in mathematics proficiency levels between 2006 and 2012.
Figure 3. Share of students at each PISA proficiency level in mathematics and reading in selected countries, 2006 and 2012
Mathematics Reading
0% 10% 20% 30% 40% 50% 60% 70% 80% 90% 100%
6 7 8 9 10 11 12 13 14 15 16 17 18 19 20 21 22 2009 2013
Poorest 20% of
households 0% 10% 20% 30% 40% 50% 60% 70% 80% 90% 100%
6 7 8 9 10 11 12 13 14 15 16 17 18 19 20 21 22 2009 2013
Wealthiest 20% of households
100 80 60 40 20 0 20 40 60 80 100 100 80 60 40 20 0 20 40 60 80 100
2006 2012 2009 2012 2006 2012 2006 2012 2006 2012 2006 2012 2009 2012 2006 2012 2009 2012
Indonesia Malaysia Thailand Turkey OECD Vietnam Singapore Korea
Shanghai-China % g e o f 15 y ear o ld st ud en ts
level 5 and above
level 2-4
below level 2
100 80 60 40 20 0 20 40 60 80 100 100 80 60 40 20 0 20 40 60 80 100
2006 2012 2006 2012 2009 2012 2006 2012 2006 2012 2009 2012 2006 2012 2006 2012 2009 2012
Indonesia Thailand Malaysia Turkey OECD Singapore Vietnam Korea
Shanghai-China %ge o f 1 5 y ear o ld stu dents
level 5 and above
level 2-4
Data from national examinations also show significant disparities in learning between students, schools and regions. For example, students who have parents with low levels of education or low incomes tend to do less well at school. Moreover, female students also tend to do better in national examinations than their male counterparts. These findings highlight the need to provide all children with access to good quality education opportunities in order for them to fulfil their full potential.
A comparison between the achievements and the increases in spending on education over the last five years also highlights a concern over efficiency in the sector. In particular, a large proportion of additional education spending has been directed towards hiring new teachers and paying them more through professional allowances associated with the national teacher certification program. While increased teacher spending has put significant additional burdens on the education budget it is not clear that it has had an impact on education outcomes and particularly learning achievement. Weaknesses in the mechanisms used to allocate resources to local governments and schools have also reduced the impact of public spending increases on education outcomes.
Key challenges that must be addressed in the next five years
On the 2014 Pearson Learning Curve rating, which is a composite score based on international test results and assessment of adult competencies, Indonesia is ranked at 40/40. One of the key lessons identified by the Pearson Report which is pertinent for this moment in Indonesia is that “developing countries must teach basic skills more effectively before they start to consider the wider skills agenda. There is little point in investing in pedagogies and technologies to foster 21st century skills, when the basics of numeracy and literacy aren’t in
place”.
With this in mind, a strong focus on the quality of basic education is still needed and thekey priority for the next five years must be to improve the learning outcomes of students from schooling, from vocational skills training and from the higher education sector. High pass rates and high graduation rates have for many years masked the real level of achievement.Improvement and expansion to 12 years universal education will not deliver the desired individual or national outcomes if the quality is not really there.
A necessary step in improving learning outcomes should be careful consideration of the whole system and culture of learning assessment, including the exams, system monitoring of outcomes and school level assessment. The national exams appear to have reached a tipping point where the imperatives to maintain pass rates have seriously distorted the process and the results have little value. School marks are being awarded by teachers to ensure that all students pass and in doing so, provide a disproportionate bonus to the least able and lowest performing students. While some may see this as an equalizing strategy across the disparate regions of Indonesia, it is unfair to students who have worked hard and earned their marks. The imperative for all to pass is also what sustains cheating which in turn generates a high cost in human, social and fiscal terms and diminishes community confidence in the education system. The choices for government will be to reform, resource and significantly improve the existing system, or institute a new system of assessment. This is a hugely controversial area with many opposing ideologies but it will be very difficult, and maybe impossible, to drive effective reforms in teaching and learning in the absence of valid and reliable assessment on which to base improvement efforts and for monitoring progress.
If the quality of learning outcomes is not addressed with some urgency, and in a sustained and systematic way, the current low quality of learning outcomes could hold the nation back.For example, the potential of the anticipated demographic bonus will not be realized if the mass of students entering the workforce do not have adequate basic skills. The opening up of trade in the ASEAN community will create pressure for all countries to be more competitive and Indonesia must avoid the scenario in which it becomes primarily a source of semi-skilled labour in Asia, instead of leading in innovation, entrepreneurship and application of technologies.
surprisingly Kurikulum 2013 became highly controversial and is now subject to a review. In moving forward on curriculum and assessment it is most important that the new government recognises the prime role of national standards and the subsidiary roles of curriculum and assessment as tools for quality teaching, quality learning and system monitoring.
In preparing young people for the workforce and for productive lives, the education system must include deliberate teaching of non-cognitive skills including character skills and so-called 21st century learning
skills.A considerable body of educational research suggests that non-cognitive skills (e.g. persistence, self-discipline, effective communication) are equally if not more influential than academic skills in predicting post-school outcomes. While there are many different approaches in which schools can develop character skills, including religious education, a key message from meta-analysis of relevant research is that good teaching, effective leadership and a positive school climate can develop character skills naturally as part of the effective teaching of academic skills. The implication of this is that real reform in teaching can have a positive flow-on effect to the personal quality of school graduates , the well-being of the country and its economic status in the region.
The reform of the teaching process can happen school by school, day by day, through the way that individual teachers, principals, supervisors and district officials view their job and take responsibility for their actions. This approach is consistent with the Mental Revolution proposed by President Joko Widodo, which calls for a new mindset in which citizens, including teachers and education officials, are empowered to make moral choices and behave in ways that will improve teaching and learning.
Principals, school supervisors and teachers themselves must be the leaders of change in this organic school-by school process which reaches into to every classroom.
Principals and teachers however cannot do this alone. They must be supported by a system that values and supports teachers through its selection methods, pre-service training, induction, school-based development procedures and effective performance management. National and local government must work together to ensure more effective management and deployment of the teaching workforce. This will result in more students having quality teachers who feel valued and act as professionals.
Part of the system-change required is to focus on school improvement. There are several, disconnected systems and tools for school quality assurance and accreditation. These need to be streamlined, aligned and implemented more rigorously, with appropriate incentives for improvement, sanctions for inaction and positive support to change. A key tool, the Minimum Service Standards (MSS) is not well understood and needs to be reviewed and reinforced as a responsibility of local government. From the 2013 MSS survey, around 70% of all schools did not meet MSS for text books and enrichment books and 40% did not have the basic resources for teaching science. On these and other indicators, the MSS survey showed very large
differences between public and private schools, highlighting a serious issue of inequity between the systems which has yet to be addressed effectively.
Having qualified, competent and motivated teachers and leaders in every school is the key to improving learning. Given the huge investment in teacher upgrading nation-wide, this is clearly achievable if there can be system adjustments to the way that school staffing entitlements are calculated and the ways that teachers are distributed and supported.
by the poor, to good quality primary education. Students who have two years of good quality pre-primary education will start school prepared for learning and continue to achieve more highly than those who missed that opportunity. The results on PISA tests of 15 year olds in Indonesia show that having two years of pre-primary education confers a benefit of 41 points, equivalent to being one year ahead in schooling, or 29 points if adjusted for socio-economic status. But sadly, twice as many rich students as poor students have this advantage. Poor students are more likely to start school late, experience early learning failure and repeat a grade - all factors which are associated with subsequent learning failure, drop out and, as a consequence, will continue the cycle of poverty.
The lasting impacts of socioeconomic disadvantage on learning are also seen in analyses of the Indonesian PISA test results by equity quartile. The likelihood of adisadvantaged 15 year old “beating the odds” and scoring in the top performance quartile is described as an index of student resilience. On the Indonesian sample, a very low % of students, just 2.5 %, who are top scorers on the PISA tests come from the bottom socio-economic quartile.
Figure 4. PISA calculations of student resilience based on the percentage of top-scoring students coming from the lowest socio-economic quartile
Evidence of continuing inequity in the quality of education offered and in the learning outcomes of students suggests that the increased investment of the past 5 years has not delivered the desired results. The most disturbing example is the failure, thus far, of teacher reforms to demonstrate positive impacts on either teachers’ competence, or students’ learning: the majority of teachers fail the competence tests, and principals and supervisors as a group score even lower than the staff they must supervise. In retrospect, it appears that a high level of system inefficiency and weak accountability have prevented good reforms and policy instruments from being fully implemented as planned. The Joint Decree on teacher management provides a way forward for district governments to implement innovative solutions to address teacher needs and management issues. At the same time, improved remuneration and conditions for teachers are beginning to raise the quality of entrants to the profession. While the challenges of scale and the diversity in the operating environment are daunting, continued investment in improved teacher training and support to build the knowledge and skills of teachers will be associated with improvements in student learning.
2.5 2.6
6.3 6.5 12.8
18.2
15.1
Figure 5. Estimates of student learning over six years of Primary School based on teacher knowledge vs. degree
Source: De Ree, 2013
Clearly the higher education sub-sector in Indonesia has a key role in teacher improvement and quality improvement of the workforce in total. The higher education sector, like the school sector, has grown very rapidly. There are now over 3,500 institutions established, many of which are very small, private, poorly funded institutions which cannot provide quality programs and would in many other countries be regarded as unviable. A more rigorous approach to accreditation and quality assurance is needed to halt the proliferation of low quality institutions for higher education and to help improve the quality of all. There is also a problem of relevance in whichmany institutions (large and small) are not providing programs relevant to the skill needs of the country. Even in the area of teacher training, which has become a “cash-cow” for many institutions, many graduates emerge with little, if any, practical training in pedagogy and low subject knowledge, having been taught by lecturers who are not experts in classroom teaching. As is shown above in Figure 5, teachers’ subject knowledge has a direct relationship with improved student learning.
Although enrolments in higher education have climbed steeply in response to both supply and demand factors, the enrolment is highly skewed across socioeconomic profiles.While 66.6 % of young people from the highest socioeconomic quintile are enrolled in degree courses, just 2.5% of those from the lowest quintile are enrolled. These figures are an eerie reflection of the PISA resilience index of 15 year olds. Such inequity requires a range of affirmative actions, not just scholarships, to be applied throughout the full continuum of schooling in order to prepare young people from every social background to enter and be successful in higher education.
In addition to addressing inequity arising from factors such as poverty, isolation and cultural difference, the policy reforms needed to improve quality in higher education include rationalizing and strengthening the institutional focus and mission of institutions and strengthening their processes for quality assurance, which are currently weak. Institutional support is also needed to address management and administration, the quality and qualifications of lecturers and their teaching and research skills as well as the capacity of individuals and institutions to reach out and serve the needs of industry and the workforce.
Efforts and incentives to improve the relevance of higher education will enhance individual employability and the quality and competitiveness of Indonesian businesses and entrepreneurial ventures. Decisions about priorities and reforms in both governance and relevance need to be informed by consistent policy and research.More autonomy in governance and improved funds channeling could provide the impetus for locally-driven initiatives and reform to improve the quality of university teaching and research, extend partnerships with industry and business and reach out to remote areas.
Like the higher education sector, skills training in the technical and vocational sector (TVET) has also expanded rapidly and is poorly regulated. It is described as having an “aura of chaos” with many issues and
0 0.1 0.2 0.3 0.4 0.5 0.6
0 1 2 3 4 5 6
1 Standard Deviation increase in teacher knowledge
Remaining teachers upgrade to S1
skills of teachers need to be greatly improved. Good quality TVET has an important role in increasing equity of opportunity by ensuring multiple pathways, flexible entry and re-entry, lifelong learning and transportable qualifications and credits within a national qualifications framework. Within such a framework, a more entrepreneurial, demand-driven approach oriented to local needs and opportunities as well as regional and global opportunities should fairly quickly generate more positive outcomes for students and raise national productivity.
The agenda sketched briefly above requires intense effort and coordination from national and local government.As a consequence of both the rapid expansion of local government entities and for many, their remote location and isolation from expertise that could be provided by others, the result has beenlow capacity of local government to manage and weak systems for data collection, management and analysis.
The systematic use of evidence for decision-making at both national and local level is a dream yet to be realized. Around 30 % of local governments have been established in the last 10 years and many will need a decade to become fully effective. What is encouraging is that there is a strong link betweenbetter quality local governance and better education performance.
As the policy leader for education in Indonesia, the national government has huge responsibilities for management oversight of one of the largest education systems in the world. Understandably there are efficiency issues relating to timely disbursement of resources, ensuring that structures match functions, upgrading the workforce in qualifications, skills and work ethos, instituting performance management, reliable data collection and expert analysis to ensure a sound basis for decision-making. Planning for 12 years universal education, while at the same time improving the quality of the first nine years, is challenging and will require new ways of thinking and working. The greatest impact may come from developing systems with local government that will improve teacher allocation, distribution and support and identifying ways to free up misused resources and direct those to quality improvements. This will require systems improvement as well as a change in mindset.
Enhanced partnerships between levels of government and the public and private sectors is essential in this process. Given the imperative for quality improvement over the scale and diversity which characterizes Indonesia, it seems logical that provincial governments could take a stronger role in leading education monitoring and quality assurance. This may require enhancement or restructure of existing institutions and networks including partnership with universities that would focus on education improvement.More effective funds channeling will also require enhanced partnerships between levels of government, as well as reduction in the complexity and number of grants and reporting requirements in order to promote flexibility and responsiveness to local conditions.
Recognising the limited fiscal envelope for the desired expansion and quality improvements, there is a need for development of more innovative Private-Public partnerships and different ways of sharing the costs. These would need to include effective incentives for employers and community organisations to become engaged within agreed national frameworks and quality assurance mechanisms.
Quality assurance is going to be a key issue in moving forward on the expansion and policy agenda outlined in the Background Study. At school and institution level, the most effective approaches to quality assurance and quality improvement globally have been found to use both upward and downward pressure, and support. Increasing citizen demand, through more effective selection and training of School Committee Members, community stakeholders and employers, has been shown in many countries to be an effective way of accelerating improvement. Schools as learning communities flourish when they have both community and system support and a shared sense of vision and accountability.
Chapter 9. Achieving Universal 12 Years of Education
Introduction
The recently announced Universal 12 Year Education Program (Program Menengah Universal, PMU) has set an ambitious target of 97 percent Gross Enrolment Rate (GER) at senior secondary level by 2020. After achieving nearly universal access to 9 years compulsory education (Wajib Belajar 9 Tahun), this is seen as a natural next step to improve access to education for all. The 9 Year Compulsory Education began in 1994 and it was nearly met in 2010, after reaching gross enrollment rate of 98 percent. The move to increase access is a laudable one. Expanding enrollments in post-basic education is necessary to move from middle income to high income status.1 Beyond access, ensuring that children not only transition to senior
secondary, but that they graduate with the right skills is even more important. As countries develop, the jobs available become more complex and demand a higher level and complexity of skills from the workforce.2 Increasing access to senior secondary education is also equitable, since most of the drop-outs are from the lowest income quintiles and from rural areas. In a context of high returns to education, these increases in equity in access to education may contribute to reducing the fast increasing inequality in income distribution (Wai-Poi).
Achieving near universal senior secondary education by 2020 will be a challenge. In 2013 there were almost 10 million 7-19 year olds not enrolled in any form of education. The GER in 2013 for senior secondary is still 68 percent. Moreover, access to junior secondary education is still unequal as there are large disparities in enrollment rates between the poor and the rich. About ½ of the children from the lowest income quintile families are not completing junior secondary education. Further, disparities exist when comparing urban and rural areas. Over 60 percent of rural students not yet completing grade 9 (World Bank, 2012). There are evident signs that there are significant supply constraints, which mean that schools will need to be established (either built, converted or consolidated) and the facilities that come with it. Therefore, significant investment will be needed to achieve these goals.
Access will not be the only challenge - quality of basic education is still low in Indonesia. Judging by international tests, a majority of students who reach senior secondary education have not acquired the level of learning that is expected of them. Many students entering senior secondary lack the basic skills that the senior secondary curriculum assumes them to have, and there is evidence that a significant share of them do not have the skills needed to succeed in the labor market after graduating. These shortages may be accentuated by unequal quality of senior secondary schools, especially private ones. Expanding the system without addressing these quality shortcomings may only result in more graduates who access the labor market without the right skills, limiting the returns to the increased investment in senior secondary. Moreover, poor quality of education my drive drop out as parents may pull their children out of school if they know that the value of the education their children receive is low.
The GoI has already shown commitment to achieving this policy by increasing investment in senior secondary. In 2012, the government through the Universal Senior Secondary Program (Program Pendidikan Menengah Universal, Program PMU) initiated the disbursement of the School Operation Fund (Bantuan Operasional Sekolah, BOS) for students in senior secondary education. In 2013, the program provided a
1 Jimenez, Nguyen and Patrinos (2014), Stuck in the middle: Human Capital Development and Economic Growth in Malaysia and
Thailand
nominal amount of IDR 560.000 per student per year (Ministry of Education, 2013) to both public and private senior secondary schools. Starting from the academic year 2013/2014 the government has significantly increased the nominal amount of BOS for senior secondary education to IDR 1.000.000 per student per year for both public and private senior secondary schools in both the general (Sekolah Menengah Atas, SMA) and the vocational track (Sekolah Menengah Kejuruan, SMK) (Ministry of Education, 2013), covering around 8.9 million students. Complementing the funds from BOS, GoI also provides a subsidy directly to poor students (Bantuan Siswa Miskin, BSM) with IDR 1,000,000 per student per year, which covered over 2 million students attending both public and private schools in 2013. To further support the expansion of senior secondary education, the government is also committed to building new schools and classrooms, and improving the qualification and competency of teachers and education personnel.
As Indonesia implements the 12 years universal education policy, the main objective of this chapter is to provide some policy directions to meet the goals of expansion and quality in a context of limited growth in resources. This chapter is organized around 3 main questions: (i) Why should Indonesia expand enrollment in senior secondary? (ii) What are the existing challenges in senior secondary enrollment? (iii) What are the challenges in Universalizing? and (iv) What are some policy directions to address this challenges? In particular, the chapter argues that in a context of limited growth in resources there is a need to use resources strategically to leverage private spending and provision, offering 3 areas for possible policy intervention: a) targeting subsidies better through a program of scholarships for the poor; b) using public-private-partnerships strategically, and c) avoiding fixed ratio targets for general and vocational tracks while focusing on improving the quality and relevance of both tracks
1.
Why should Indonesia expand enrollment in senior secondary?
Indonesia has seen fast improvements in access to education. Gross enrollment rates have increased for all levels of post-primary education over the past decade. Between 2002 and 2013 the gross enrollment rates for primary education have been more or less stable. In contrast, the gross enrollment rate for junior secondary has increased from 77 to 91 percent, senior secondary has increased from 45 to 68 percent and tertiary education have increased from 13 percent to 26 percent. Junior secondary, senior secondary and tertiary education have been the fastest growing sub-sectors in terms of coverage during the past decade. It is clear that Indonesians, including the poorest segments of the population, are demanding more and better services for post-basic education. The Government’s ambitious goals for expansion are in line with this increased demand.
Figure 6. Trends in gross enrollment rates, 2001-2013
Source: SUSENAS (2000-2013)
These increases in enrollment are clearly visible in the attainment of the labor force. Indonesia’s labor force is rapidly becoming more educated. Most of the expansion of the labor force over the past decade has been in senior secondary and tertiary education graduates. As a result, while the majority of the population
0 20 40 60 80 100 120
2000 2001 2002 2003 2004 2005 2006 2007 2008 2009 2010 2011 2012 2013 GER Primary
GER Junior Secondary
graduates and more than 10 million tertiary education graduates in Indonesia’s labor force. Over the past five years, the labor force with tertiary education has increased by around 1 million annually and the labor force with senior secondary by around 2 million annually. These numbers are likely to increase in the near future, driven by the Government’s policies to provide universal access to senior secondary education through the universal 12 years of education program, and doubling enrollment in higher education by 2020. Under reasonable assumptions,3 the number of Indonesians with tertiary education will more than double
over the next 10 years.
Figure 7. Educational attainment of the labor force, 2001-12
Source: Sakernas
Despite this rapid influx of graduates, the average wages of more educated workers have not declined, suggesting that the demand for skilled workers is still outpacing the supply. Comparing hourly wages for different levels of education4 show largely constant differences across workers with different levels of education over the last decade. If anything, the differences in the wages of tertiary education graduates seem to be increasing faster than those with less education. The differences in wages for senior secondary and tertiary graduates relative to junior secondary graduates appear to be constant over time suggesting that despite increases in the supply of new graduates, there is still a large demand for them.
Figure 8. Trends in average wage by level of education, all labor force and younger than 35, 2001-10
a) All ages b) Age 35 and below
Source: Authors’ calculations using Sakernas, employed for wages.
The demand for skilled workers is likely to increase further. When asked in a survey conducted by the World Bank in 2008, employers almost universally considered that skill requirements will increase, identifying higher-quality standards, a more competitive business environment and export orientation as
3 Using linear growth in enrollment rates in higher education.
4 The picture looks very similar when running mincer equations, so we use comparison of hourly wages for easier reference.
0 20,000,000 40,000,000 60,000,000 80,000,000 100,000,000 120,000,000 140,000,000
2001 2002 2003 2004 2005 2006 2007 2008 2009 2010 2011 2012
Higher Education Senior Secondary Basic
less than primary
0 2000 4000 6000 8000 10000 12000 14000 16000 18000 20000
Higher Education
Senior Secondary
Basic
less than primary
0 2000 4000 6000 8000 10000 12000 14000 16000 18000 20000
less than primary
Basic
Senior Secondary
the main drivers for increased requirements. This is in line with Indonesia’s ambitions to become a high-income economy, macroeconomic trends (ASEAN, China’s raising wages) and the raising middle class (which will demand higher quality products and services).
In the context of a globalized economy with increasing international competitiveness, Indonesia’s expansion to senior secondary education is no longer an option but a necessity. The ASEAN Economic community is planned to be established in 2015, freeing the movement of labor across the 10 ASEAN countries. Vietnam, Malaysia, and Thailand have been investing heavily in expanding quality senior secondary and tertiary education, and Indonesia will need to ensure that it is not left behind. With this, the cost of not expanding senior secondary education, particularly in the long term may be higher than the cost of expansion itself.
Figure 9. The demand for skills is increasing
Expanding access to senior secondary is also important from an equity perspective, since a majority of the current drop-outs are from the poorest economic quintile. Many students drop-out before reaching senior secondary, therefore preventing drop-outs in junior secondary is crucial. According to SUSENAS 2013, ne