The Analysis of Effects of Good Corporate
Governance on Earnings Management in
Indonesia with Panel Data Approach
Iskandar Muda*1, Weldi Maulana2, Hasan Sakti Siregar3, Naleni Indra4
Received: September 10, 2017 Accepted: October 14, 2017
Abstract
he research was aimed to analyze effects of Good Corporate Governance, comprising of Composition of Commissioners & Audit Committee on earnings management an Empirical Study on Indonesia Stock Exchange with Panel Data Approach. The data collection method used was documentation. The samples in this research were in Indonesia registered in Indonesia Stock Exchange. The data analysis method employed panel data regression analysis with E-Views Software. The results demonstrate that Good Corporate Governance simultaneously affects earnings management. Partial testing indicates that Good Corporate Governance variable of Composition of Commissioners has no effect on earnings management & Audit Committee has no effect on Earnings Management.
Keywords: Audit Committee, Composition of Commissioners, Good Corporate Governance, Earnings Management.
JEL Classification:D53, G15, G32, L60. 1. Introduction
The issue of Good Corporate Governance is being hotly debated, especially among the economists & businessmen in Indonesia. The financial crisis happening in various countries, particularly in Indonesia in 1997, which eventually turned into an Asian financial
1. Department of Accounting, Faculty Economics and Business, Universitas Sumatera Utara, Medan, North Sumatera, Indonesia (Corresponding Author: [email protected]).
2. Faculty Economics and Business, Universitas Sumatera Utara, Medan, North Sumatera, Indonesia ([email protected]).
3. Department of Accounting, Faculty Economics and Business, Universitas Sumatera Utara, Medan, North Sumatera, Indonesia ([email protected]). 4. Department of Accounting, Faculty Economics and Business, Universitas Sumatera Utara, Medan, North Sumatera, Indonesia ([email protected]).
crisis, was seen as a result of the weakness in Good Corporate Governance practices in Asian countries. The failure of several companies & the emerging financial malpractice cases due to the crisis is the bad practice of Corporate Governance. Because of it, Good Corporate Governance finally became an important issue, especially in Indonesia which was worst affected by the crisis. In addition, many infringement cases committed by issuer companies in capital market being handled by Capital Market & Financial Institution Auditing Body Republic of Indonesia, show the low quality of good corporate governance practices in our country.
Based on several cases, financial statements have raised the question on the effectiveness of Good Corporate Governance implementation in a company for minimizing earnings management. The conflict of interest between the company owners & the management can be minimized by a monitoring mechanism capable of balancing the interests between the management & shareholders or other parties. Below is an example of a company that performs an earnings management.
It was indicated that PT. Kimia Farma Tbk. in 2002 had earning management practices by raising its earnings up to IDR 32.7 billions. PT. Indofarma in 2004 conducted an earnings management practice by presenting an overstated net profit of IDR 28.870 billions, as an impact of goods inventory assessment which is higher than expected, resulting in understated cost of sales for that year. Financial scandals also occurred in developed countries, such as such as Enron, Merck, World Com in United States (US) & the majority of other companies in United States (Cornett et al., 2006). Not long after the case, there were similar cases such as Tyco, Global Crossing & Xerox Corp. All these events defame the public accounting profession that should be independent. On that basis, the United States Parliament on 23 January 2001 issued a provision in the field of public accountant services known as the Sarbanes Oxley Act.
structure facilitating the determination of a company’s goals, as well
as a means of determining the work monitoring techniques (Darmawati et al., 2004 & Lutfi et al., 2016).
The agency theory describes that earnings management problem minimized by a monitoring through Good Corporate Governance. Corporate Governance is a concept to improve management performance in supervising or monitoring the management performance while guaranteeing the management accountability for the shareholders based on regulatory framework (Dalimunthe et al., 2016; Lubis et al., 2016; Muda et al., 2016). The concept of Corporate Governance is proposed for achieving more transparent company management for all financial statements users. If the concept is used properly, then the economic growth is expected to move forward in line with better transparent company management, which eventually gives benefits to many parties. (Nasution & Setiawan, 2007). The level Good Corporate Governance users can be measured, & it can be compared with each other. A number of methodologies for measuring Good Corporate Governance have been developed & can be used by users. The Forum Corporate Governance in Indonesia (FCGI), for example, developed a tool for assessing Good Corporate Governance which can also be used as an audit tool (FCGI 2003). In this research, the indicator of Good Corporate Governance mechanism used the mechanism of Composition of Commissioners & Audit Committee. In general, the Composition of Commissioners are given the tasks & responsibilities to monitor the information quality contained in the financial statements (Nurzaimah et al., 2016; Muda et al., 2016; 2017). Briefly, there are five aspects assessed in this FCGI GCG assessment scheme, namely: Shareholder rights, GCG Policy, GCG Practice, Disclosure & Audit. In Audit weights consist of having an effective internal audit, audited by an independent public accountant, having an effective audit committee, developing effective communication between internal audit, external audit & audit committee. It is very important, in the light of the management’s interests to implement earnings management which may put impact on
audit, as well as to monitor the follow-up of audit outcome for assessing the adequacy of the financial statement process.
One of methods conducted by the management in the process of preparing financial statements - which may affect the level of profit shown - is earnings management (Mahdaleta et al., 2016 & Lubis et al., 2016). It is expected to increase the company value at certain times. Earnings management conducted by company management will increase the company value, but then it will go down (Jansen et al., 2012). Earning management occurs when managers use their decisions in financial reporting & in preparing transactions to alter financial statements to either create a false picture for stakeholders about the company's economic performance, or to influence contractual results that depend on accounting figures reported.
In the concept of Earning Management that has signaling motivation to record discretionary accruals to better reflect the impact of the underlying economic events on the performance of the company. Management records discretionary accruals to convey private information about a company's ability to generate future profits, or to make profits a more reliable & timely measure of current company performance than non discretionary accruals, while Discretionary accruals are also called abnormal accruals are often used as a proxy for opportunistic profit management in some previous studies according to their respective contexts, but managers may have other motivations for recording discretionary accruals to signal the performance of the company today & the future.
The existence of Earning Management in business entity is inseparable from various or underlying motivation factors as for some motivations related to the implementation of Earning Management ie, bonus motivation, political motivation, taxation motivation, motivation of change of chief executive officer (CEO), motivation of initial public offering (IPO), debt-induced motivation, motivation to meet expectations & maintain reputation. In addition, there are several steps or ways in doing business entities related to earning management with Taking a bath, Income Minimization, Income Minimization & Income Smoothing. Based on the background described above, the
subject matter in this research is: “Does Good Corporate Governance,
Committee simultaneously & partially affect earnings management?”
2. Literature Review
2.1 Profit Management
Earnings management is an effort by corporate managers to intervene or affect information in financial statements with the aim of deceiving the stakeholders who want to know the performance & condition of the company (Sulistyanto, 2008). In the opinion of (Lutfie et al., 2016), the ways to understand the earnings management are divided into two. First, it is seen as manager opportunistic agent in maximizing its utility in the face of compensation contracts, debt contracts & political costs (Opportunistic Earnings Management). Second, viewing the earnings management from the perspective of efficient contracting (Efficient Earnings Management), where the earnings management gives flexibility to the manager to protect themselves & the company in the anticipation of unforeseen events for the benefit of the parties involved in the contract.
2.2 Agency Theory
In order to understand Corporate Governance, then it should use the basic perspective of agency relationship. (Jansen & Meckling, 1976 in Muda & Dharsuky, 2015) pointed out that agency relationship is a contract between the manager (agent) & the investor (principal). The owners expect high returns from their investments in company, whilst the management expects high compensation & fulfillment of their psychological needs. It leads to conflicts between the management & owners, as each of them will fulfill their own interests (opportunistic behavioral).
2.3 Good Corporate Governance
According to (Kausalty et al., 2013), it was revealed that corporate governance refers to the systems, principles & processes by which a company is governed. Corporate governance provides guidance on how to control & direct the company to fulfill the goals & objectives that is able to add the company value & usable for all stakeholders in the long term (Muda et al., 2017). Stakeholders in this regard include all parties of the board of directors, management, shareholders, employees & the public. The mechanism of Good corporate governance consists of several variable indicators. In the present research, the indicators used by researchers are the Composition of the Commissioners & Audit Committee.
2.4 Composition of Commissioners
In general, the board of commissioners is assigned and given responsibility for information quality monitoring as contained in the financial statements. This is important, given the importance of management to perform earnings management, resulting in poorer trust of the investors (Muda et al., 2017). In order to handle this, the board of commissioners is allowed to gain access to company information. The board of commissioners has no authority within the company. Therefore, the board of directors is responsible for delivering information related to the company to the board of commissioners (NCCG, 2001).
2.5 Audit Committee
2.6 The Five Aspects Assessed in the GCG Assessment Framework
Some tools for self-assessment of GCG conditions in companies in a spreadsheet file consist of: (Internal Audit, 2017)
1. Shareholder rights
In shareholder rights may provide an evaluation, whether the company has:
a. Holds a General Meeting of Shareholders (GMS) within 6 months after the end of the fiscal year,
b. Submit to shareholders notices concerning the Annual Shareholder Meeting at least 28 days before the General Meeting of Shareholders is held;
c. Encouraging shareholders to attend GMS and utilize their voting rights;
d. Provide sufficient opportunities for shareholders to submit questions at the GMS.
2. GCG Policy
In the GCG policy is assessed whether the company has:
a.Have written rules on GCG in which the rights of shareholders, duties and responsibilities of the Board of Directors and Board of Commissioners are explained;
b.Providing access for the public to know the company's policy regarding public investors;
c.Establishing a responsible organ (e.g. the Board of Commissioners) to ensure that the company complies with established GCG rules;
d.Have rules of conduct / ethics for employees in writing; e.Inform and implement properly the rules of conduct/ethics.
3. GCG Practice
In practice this GCG is tested whether within the company:
a.The Board of Directors holds regular meetings with the Board of Commissioners;
c.The Board of Directors and Board of Commissioners have been trained or have appropriate backgrounds, enabling them to perform their duties;
d.Members of the Board of Commissioners and Board of Directors are not involved in a conflict of interest;
e.There is a performance appraisal system of the Board of Directors and the Board of Commissioners.
4. Disclosure
In this section it can assess whether the company has:
a.Providing equal access to shareholders and financial analysts; b.Provide a proper explanation of business risks;
c.To express the remuneration of the Board of Directors and Board of Commissioners correctly;
d.Disclose related party transactions;
e.Presents the results of financial performance and analysis management via the internet.
5. Audit
In this section it should be assessed whether the company is: a.Has an effective internal audit,
b.Audited by an independent public accountant, c.Develops an effective audit committee,
d.Develops effective communication between internal audit, external audit and audit committee.
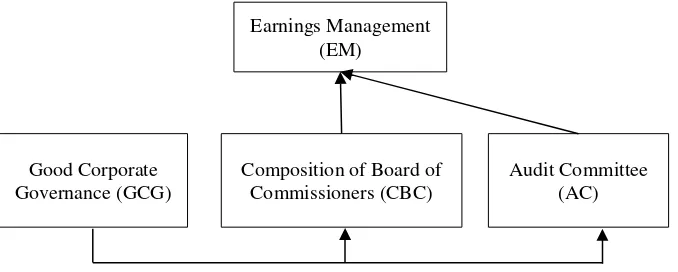
The conceptual framework can be described as follows:
Figure 1: Conceptual Framework Good Corporate
Governance (GCG)
Composition of Board of Commissioners (CBC)
Audit Committee (AC) Earnings Management
From the conceptual framework above, the researchers had the intention to examine the analysis of effects of Good Corporate Governance, which consists of the composition of commissioners and audit committee, on earnings management. The composition of commissioners is generally given with tasks and responsibilities to monitor the information quality contained in financial statements. It is highly important, given the importance of management to conduct earnings management that may impact on poorer trust of the investors. In order to handle this, the board of commissioners is allowed to gain access to company information.
The audit committee is a committee set up by the board of commissioners for carrying out the monitoring task over company management. The presence of the audit committee is highly crucial for the company management. The audit committee is deemed as a connection between the shareholders, the board of commissioners and the management in handling control issues. The audit committee is a committee established by the board of commissioners to carry out supervisory duties in the management of the company. The existence of the audit committee is very important for the management of the company. Earnings management is done with a specific purpose. Earnings management is made by accruals that increase profits for the purpose of obtaining relatively high stock prices at the time of issue issuance. Earnings management can also be done with the aim of gaining profits related to the ownership of management shares. This can be done, for example, in the employee stock option program. In this program, the price of an option is usually determined at the time of the program offer. This encourages management to make earnings management before the option grant date i.e. lowered earnings in order to affect stock prices and thus management can accept the option at the time of relative stock price.
3. Material and Method
3.1 Type and Site of the Research
3.2 Research Population and Samples
Population is a combination of the entire data elements in the form of events, objects or people having similar characteristics which become the focus of a researcher for being viewed as a universe of research (Muda, 2017). The population in this research was 325 manufacturing companies listed on Indonesia Stock Exchange which are grouped based on sub-sector of the companies. The sample is part of the population (in part or representative population) to be employed in the research (Gusnardi et al., 2016). The sampling in this research was performed by using Slovin formula: (Sirojuzilam et al., 2016)
n =
where:
n: The number of sample’s members N: Total population
e: error tolerance at 10%, therefore :
n = = 76,47 or 77, thereby, the number of samples
in this research is being rounded into 78 company sectors
3.3 Data Analysis Method
The data were analyzed using regression method of panel data, & were sectioned using Eviews software tool. The panel data means statistical methods with regression using panel data or pooled data was a combination between time series & cross section data. In the opinion of (Tarmizi et al., 2016 & 2017), there are 2 ways to arrange a panel data structure, i.e. Independent Pooled Data and Longitudinal Data.
3.4 Data Testing
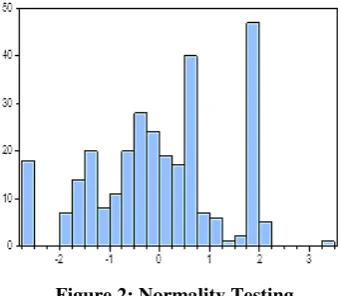
The residual normality testing in formal OLS method can show whether or not the residual is normally distributed, by means of comparing the Jarque-Bera (JB) value with chi-Square α = 0.05 and df = 2 of 5.9915:
1.If JB value > 5.9915 then the residual is not normally distributed 2.If JB value < 5.9915 then the residual is normally distributed.
3.5 Estimation of Panel Data Regression Model
The panel data equation model is a combination of cross section data and time series data:
Yit = α + β1X1it+ β2X2it+ εit
where:
Yit : Dependent variables
Xit : Independent variables
α : Constant
β1,β2, : Coefficients Regressions
i : ith entity t : tth entity
€ : error
In panel data analysis, there are several analytical methods, such as Common Effects Model (CEM), Fixed Effect Model (FEM) and Random Effect Model (REM). Common Effect Model (CEM) refers to a model with non-different (constant) intercept and slope coefficients, thus ignoring the site and time dimensions of the panel data and using the OLS Regression Estimation for the estimation (Gujarati, 2004). This method can be analyzed using two approach models, i.e. Fixed Effect Model (FEM) and Random Effects Model (REM).
Fixed Effects Model (FEM) refers to models with non-different slopes (constant) but with varying or different intercepts based on cross-section (in this case is the company). Although intercepts may vary between companies, each of these intercepts does not differ from time to time (Gujarati, 2004). The estimation with OLS makes this estimation into General Least Square Fixed Effect, thus the resulted data are unbiased and consistent.
3.6 Selection of Panel Data Regression Model
3.6.1 Chow Test
The chow test is undertaken to select whether the model used should be Common Effect Model (CEM) or Fixed Effect Model (FEM). This testing was performed with the following hypotheses:
Ho: Probability > 0.05, then Common Effect Model (CEM) is valid to be used.
Ha: Probability < 0.05, then Fixed Effect Model (FEM) is valid to be used.
3.6.2 Hausman Test
The Hausman test is used as the basis for consideration in selecting whether the model used is Fixed Effect Model (FEM) or Random Effect Model (REM).
This testing was conducted with hypotheses as follows:
Ho: Probability > 0.05, then Random Effect Model (REM) is valid to be used.
Ha: Probability < 0.05, then Fixed Effect Model (FEM) is valid to be used.
3.6.3 Hypothesis Testing
The hypothesis testing was conducted using panel data regression analysis model which aims to predict the extent of the strength of effects of independent variable on dependent variable through t test and F test using static regression equation model:
EM = a + b1CBC+ b2AC + e Description :
EM : Earnings Management
a : Constants
b1,b2 : Coefficient Regression
CBC : Composition of Board of Commissioners AC : Audit Committee
e : Error
3.6.4 Coefficient of Determination
determination ranges from 0 to 1 (0≤R2≤1)
(Sadalia et al., 2017; Azlina et al., 2017; Nasir et al., 2017). The adjusted R2 value is said to be good if it is above 0.5 becaus it ranges from 0 to 1.
4. Results And Discussion
4.1 Result
4.1.1 Descriptive Statistical Analysis
Descriptive statistics are the process of collecting, presenting, and summarizing which serve to provide a sufficiently examined data. The illustration or description of data can be seen from the mean, maximum, and standard deviation values. It can be seen in the following Table:
Table 1: Descriptive Statistics
EM CBC AC
Mean 0.042682 0.375390 2.633898
Median 0.030740 0.333000 3.000000
Maximum 0.652810 0.750000 5.000000
Minimum -1.223345 0.100000 0.000000
Std. Dev. 0.166357 0.112074 1.125555
Skewness -1.505356 -0.030866 -1.611532
Kurtosis 16.74276 4.705446 4.634667
Jarque-Bera 2432.862 35.79773 160.5325
Probability 0.000000 0.000000 0.000000
Sum 12.59129 110.7400 777.0000
Sum Sq. Dev. 8.136367 3.692834 372.4610
Observations 390 390 390
Source: Eviews Results (2017).
4.1.2 Data Testing
Based on the table above, it can be concluded that concluded that the earnings management being observed is normally distributed.
4.1.3 Estimation of Panel Data Regression Model
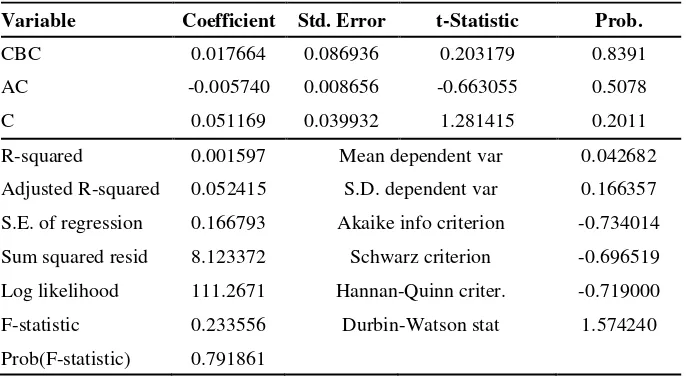
4.1.3.1 Common Effect Model (CEM)
Table 2: Cammon Effect Model (CEM) Dependent Variable: EM
Method: Panel Least Squares
Date: 04/08/17 Time: 18:41
Sample: 2011 2015
Periods included: 5
Cross-sections included: 78
Total panel (balanced) observations: 390
Variable Coefficient Std. Error t-Statistic Prob.
CBC 0.017664 0.086936 0.203179 0.8391
AC -0.005740 0.008656 -0.663055 0.5078
C 0.051169 0.039932 1.281415 0.2011
R-squared 0.001597 Mean dependent var 0.042682
Adjusted R-squared 0.052415 S.D. dependent var 0.166357
S.E. of regression 0.166793 Akaike info criterion -0.734014
Sum squared resid 8.123372 Schwarz criterion -0.696519
Log likelihood 111.2671 Hannan-Quinn criter. -0.719000
F-statistic 0.233556 Durbin-Watson stat 1.574240
Prob(F-statistic) 0.791861 Source: Eviews Results (2017)
Common Effect Model (CEM) generates the following equation:
EM = 0,051169 + 0,017664CBC – 0,005740AC
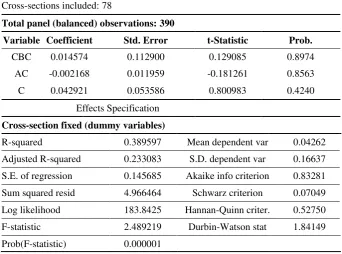
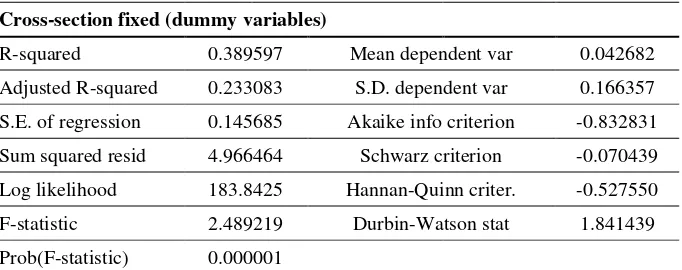
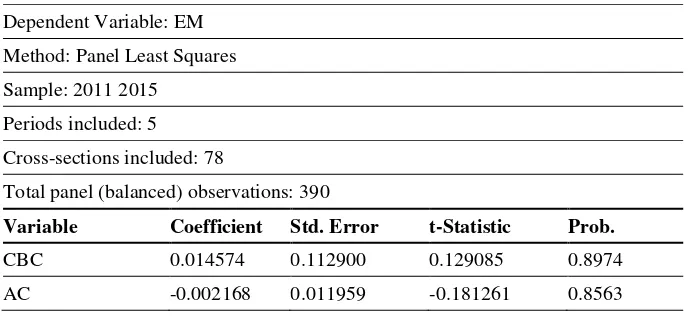
4.1.3.2 Fixed Effect Model (FEM)
Table 3:Fixed Effect Model (FEM) Dependent Variable: EM
Method: Panel Least Squares
Date: 04/08/17 Time: 18:31
Sample: 2011 2015
Periods included: 5
Cross-sections included: 78
Total panel (balanced) observations: 390
Variable Coefficient Std. Error t-Statistic Prob. CBC 0.014574 0.112900 0.129085 0.8974
AC -0.002168 0.011959 -0.181261 0.8563
C 0.042921 0.053586 0.800983 0.4240
Effects Specification
Cross-section fixed (dummy variables)
R-squared 0.389597 Mean dependent var 0.04262
Adjusted R-squared 0.233083 S.D. dependent var 0.16637
S.E. of regression 0.145685 Akaike info criterion 0.83281
Sum squared resid 4.966464 Schwarz criterion 0.07049
Log likelihood 183.8425 Hannan-Quinn criter. 0.52750
F-statistic 2.489219 Durbin-Watson stat 1.84149
Prob(F-statistic) 0.000001 Source: Eviews Results (2017)
Fixed Effect Model (FEM) generates the following equation:
EM = 0,0429216 + 0.0145740CBC - 0.0021689AC + [CX=F]
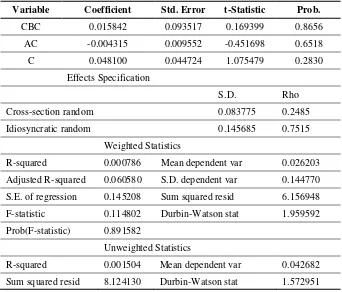
4.1.3.3. Random Effect Model (FEM)
Table 4 :Random Effect Model (REM) Dependent Variable: EM
Method: Panel EGLS (Cross-section Randomeffects)
Date: 04/08/17 Time: 18:32
Sample: 2011 2015
Periods included: 5
Cross-sections included: 78
Total panel (balanced) observations: 390
Swamy and Arora estimator of component variances
Variable Coefficient Std. Error t-Statistic Prob. CBC 0.015842 0.093517 0.169399 0.8656
AC -0.004315 0.009552 -0.451698 0.6518
C 0.048100 0.044724 1.075479 0.2830
Effects Specification
S.D. Rho
Cross-section random 0.083775 0.2485
Idiosyncratic random 0.145685 0.7515
Weighted Statistics
R-squared 0.000786 Mean dependent var 0.026203
Adjusted R-squared 0.060580 S.D. dependent var 0.144770
S.E. of regression 0.145208 Sum squared resid 6.156948
F-statistic 0.114802 Durbin-Watson stat 1.959592
Prob(F-statistic) 0.891582
Unweighted Statistics
R-squared 0.001504 Mean dependent var 0.042682
Sum squared resid 8.124130 Durbin-Watson stat 1.572951 Source: Eviews Results (2017)
Random Effect Model (REM) generates the following equation:
EM = 0,048100 + 0,015842CBC – 0,004315AC + [CX=R]
0,060580. That is, GCG variable consisting of CBC and AC simultaneously is able to explain EM variable at -6,05%, whist the 93,95 % is explained by other selection variables.
4.1.4 The Selection of Panel Data Regression Model
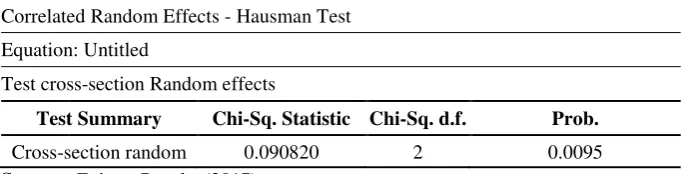
4.1.4.1 Hausman Test
Table 6: Correlated Random Effect - Hausman Test Correlated Random Effects - Hausman Test
Equation: Untitled
Test cross-section Random effects
Test Summary Chi-Sq. Statistic Chi-Sq. d.f. Prob. Cross-section random 0.090820 2 0.0095 Source : Eviews Results (2017).
From the table above, it shows that prob= 0.0095 which is smaller
than α = 0.05, thus model used is Fixed Effect Model (FEM). Based on the test to select the model, using Chow and Hausman tests, it can be concluded that the model is more appropriate to follow the Fixed Effect Model (FEM), than the Common Effect Model (CEM) and Random Effect Model (REM).
4.2.4 Hypothesis Testing
The selected model in hypothesis testing which is in line with the selection of panel data regression model is Fixed Effect Model (FEM). The Fixed Effect Model (FEM) generates the following equation:
EM = 0,0429216 + 0.0145740CBC - 0.0021689AC
Below is an analysis of the equation results above:
1.This result indicates that if there is no independent variable - GCG which consists of CBC and AC then EM will be 0,0429216.
2.CBC regression coefficient on the test is 0.0145740, which means that CBC has a positive effect on EM. Thereby, if CBC increases by 1 unit then EM will increase by 0.0145740 units. 3.AC regression coefficient of the test is - 0,0021689, which
4.1.5 Coefficient Determination Test
The coefficient determination in statistical test was conducted by observing the Adjusted R-squared value in the Table as follows:
Table 7:Coefficient Determination Test Dependent Variable: EM
Method: Panel Least Squares
Sample: 2011 2015
Periods included: 5
Cross-sections included: 78
Total panel (balanced) observations: 390
Variable Coefficient Std. Error t-Statistic Prob. CBC 0.014574 0.112900 0.129085 0.8974
AC -0.002168 0.011959 -0.181261 0.8563
C 0.042921 0.053586 0.800983 0.4240
Effects Specification
Cross-section fixed (dummy variables)
R-squared 0.389597 Mean dependent var 0.042682
Adjusted R-squared 0.233083 S.D. dependent var 0.166357
S.E. of regression 0.145685 Akaike info criterion -0.832831
Sum squared resid 4.966464 Schwarz criterion -0.070439
Log likelihood 183.8425 Hannan-Quinn criter. -0.527550
F-statistic 2.489219 Durbin-Watson stat 1.841439
Prob(F-statistic) 0.000001 Source: Eviews Results (2017).
From the table above, the Adjusted R-squared value is 0.233083. It means 23.30% of EM variables can be explained by CBC and AC, the remaining 76.70% is explained by other variables not found in the equation.
4.1.6 F Test
Table 8: F Model Test Dependent Variable: EM
Method: Panel Least Squares
Sample: 2011 2015
Periods included: 5
Cross-sections included: 78
Total panel (balanced) observations: 390
R-squared 0.389597 Mean dependent var 0.042682
Adjusted R-squared 0.233083 S.D. dependent var 0.166357
S.E. of regression 0.145685 Akaike info criterion -0.832831
Sum squared resid 4.966464 Schwarz criterion -0.070439
Log likelihood 183.8425 Hannan-Quinn criter. -0.527550
F-statistic 2.489219 Durbin-Watson stat 1.841439
Prob(F-statistic) 0.000001 Source: Eviews Results (2017)
Based on the table above, the value of F count is 2,489219, the F table value is 1.37978 with the Prob significance value (F-statistic) of 0.00001 <0.05 (Hasan et al., 2017; Handoko et al., 2017). It shows independent variable, i.e. good corporate governance, consisting of Composition of Commissioners and Audit Committee, simultaneously affects the dependent variable, namely the earnings management.
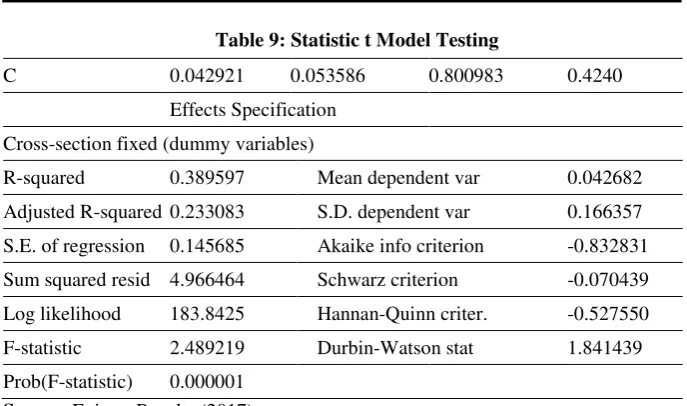
4.1.7 t Test
Table 9: Statistic t Model Testing Dependent Variable: EM
Method: Panel Least Squares
Sample: 2011 2015
Periods included: 5
Cross-sections included: 78
Total panel (balanced) observations: 390
Variable Coefficient Std. Error t-Statistic Prob. CBC 0.014574 0.112900 0.129085 0.8974
Table 9: Statistic t Model Testing
C 0.042921 0.053586 0.800983 0.4240
Effects Specification
Cross-section fixed (dummy variables)
R-squared 0.389597 Mean dependent var 0.042682
Adjusted R-squared 0.233083 S.D. dependent var 0.166357
S.E. of regression 0.145685 Akaike info criterion -0.832831
Sum squared resid 4.966464 Schwarz criterion -0.070439
Log likelihood 183.8425 Hannan-Quinn criter. -0.527550
F-statistic 2.489219 Durbin-Watson stat 1.841439
Prob(F-statistic) 0.000001 Source: Eviews Results (2017)
Based on the test results in the table, partial effects of each independent variable - GCG comprising of CBC and AC on Earnings Management (EM) dependent variable can be described as follows:
1.CBC has a tstatistic value of 0.129085 < t table of 1.968178 with
significant prob. = 0.8974> α = 0.05, thus it can be concluded
that CBC variable has no effect on EM in manufacturing companies listed on Indonesia Stock Exchange in 2011-2015. 2.AC has tstatistic value of -0.002168 < t table of 1,968178 with
significant prob. = 0.8563> α= 0.05, thus it can be concluded that
the AC variable has no effect on EM in manufacturing companies listed on Indonesia Stock Exchange in 2011-2015.
5. Discussion
5.1 GCG Effects of Composition of Commissioners on Earnings Management
The partial test results indicate that the Composition of Commissioners shows a positive regression coefficient at 0.014574 with tstatistic value of 0.129085 < t table of 1.968178 with significant
theory developed by Johnson (1979), it views that the Composition of the Company’s Board of Commissioners as agents for shareholders will act with full awareness for its own interests, not as a wise and fair party to shareholders. It shows that regardless the large or small size of Composition of Independent Board of Directors in the company, it
won’t be a guarantee that there is no fraud in the financial statements. The monitoring conducted by an independent board of commissioners
has yet to reduce the managers’ behavior which puts their personal interests to the maximum.
The research results are in line with the research by (Mawardi and Cholid, 2011), stating that partially, the Composition of Commissioners has no effect on earnings management. However, the research results are not in line with previous research undertaken by (Midiastuty and Machfoedz, 2003), saying that Composition of
Commissioners partially has positive effects on company’s earnings
management in a significant manner.
5.1.1 GCG Effects of Audit Committee on Earnings Management
The partial test results indicate that the audit committee shows negative regression coefficient of -0.002168 with a tstatistic value of -0.181261 < t table of 1.968178 with significant prob.= 0.8563 which
is greater than α = 0.05. From the testing results, empirical evidence is obtained that audit committee has no effect on earnings management. The result obtained from this research is that audit committee is not
capable of protecting the shareholders’ interest from the earnings
management conducted by the management. Based on the Circular Letter from JSE, SE-008/BEJ/12-2001, it says that the membership of audit committee should at least consist of three persons, including the chairperson of the audit committee. There should only one member of this committee coming from the commissioners. The committee member from the commissioners should be a recorded independent commissioner who is also serving as the chairperson of the audit committee. Other members who are not included as independent commissioners must come from independent external parties.
Nevertheless, it is in contrast with the research results by (Nasution and Setiawan, 2007), arguing that the audit committee has negative effects on earnings management in banking companies.
6. Conclusion
Based on simultaneous analysis results, the independent good corporate governance variable which consists of the Composition of Commissioners and audit committee, affects the manufacturing
companies’ earning management in Indonesia Stock Exchange.
Partially, GCG composition variable on Board of Commissioners has no effect on earnings management; and audit committee has no effects on earnings management. The present research is only limited to manufacturing companies listed on Indonesia Stock Exchange. However, it is advisable to be conducted to all companies listed on Indonesia Stock Exchange.
References
Arikunto, S. (2010). Research Procedure a Practice Approach. Yogyakarta: Rinneka Cipta Publishers.
Azlina, N., Amir, H., Desmiyawati, & Muda, I. (2017). The Effectiveness of Village Fund Management (Case Study at Villages in Coastal Areas in Riau). International Journal of Economic Research, 14(12), 325–336.
Cornet, M., & Alan, J. M., Tehranian, H., & Saunders, A. (2006). Earnings Management, Corporate Governance, & True Financial Performance. Retrieved from http://papers.ssrn.com/.
Dalimunthe, D. M. J., Fadli, I. M., & Muda, I. (2016). The Application of Performance Measurement System Model Using Malcolm Baldrige Model (MBM) to Support Civil State Apparatus Law (ASN) Number 5 of 2014 in Indonesia. International Journal of Applied Business & Economic Research, 14(11), 7397–7407.
Erlina, Z. A. T., Ari, S., & Muda, I. (2017a). Antecedents of Budget Quality Empirical Evidence from Provincial Government in Indonesia. International Journal of Economic Research, 14(12), 301– 312.
--- (2017b). The Analysis of the Influencing Factors of Budget Absorption. International Journal of Economic Research, 14(12), 287–300.
Forum Corporate Governance in Indonesia/FCGI. (2017). Good Corporate Governance, Retrieved from
http://www.fcgi.or.id/corporate-governance/about-good-corporate-governance.html.
Gujarati, D. (2004). Basic Econometric (Trans. S. Zain). Jakarta: Erlangga Publishers.
Gusnardi, R. R. M., & Muda, I. (2016). Competency Mapping & Analysis of Students Competency Based on Economics Subject National Examination & Its Alternative Solutions in State High Schools at Pekanbaru. International Journal of Economic Research, 3(5), 2133–2148.
Internal, A. (2017). Calculate Your Own GCG Score. Retrieved from http://auditorinternal.com/2010/02/03/menghitung-sendiri-skor-gcg-kita/.
Handoko, B., Sunaryo, M. & Muda, I. (2017). Difference Analysis of Consumer Perception of Motorcycle Product Quality. International Journal of Economic Research. 14(12), 363–379.
Jansen, I. P., Sundaresh, R., Yohn, T. L., & Teri, M. (2012). A Diagnostic for Earnings Management Using Changes in Assets Turnover & Profit Margin. Contemporary Accounting Research, 29(1), 89–97.
Lubis, A., Torong, Z. B., & Muda, I. (2016a). The Urgency of Implementing Balanced Scorecard System on Local Government in North Sumatra – Indonesia. International Journal of Applied Business & Economic Research, 14(11), 7575–7590.
--- (2016b). The Role of Enterprise Resource Plan (ERP) Configuration to the Timeliness of the Financial Statement Presentation. International Journal of Applied Business & Economic Research, 14(11), 7591–7608.
Lutfi, M., Nazwar, C., & Muda, I (2016). Effects of Investment Opportunity Set, Company Size & Real Activity Manipulation of Issuers in Indonesia Stock Exchange on Stock Price in Indonesia. International Journal of Economic Research, 13(5), 2149–2161.
Mahdaleta, E., Muda, I., & Gusnardi, M. N. (2016). Effects of Capital Structure & Profitability on Corporate Value with Company Size as the Moderating Variable of Manufacturing Companies Listed on Indonesia Stock Exchange. Academic Journal of Economic Studies, 2(3), 30–43.
Muda, I., Dharsuky. A., Siregar, H. S., & Sadalia, I. (2017). Combined Loading & Cross-Dimensional Loadings Timeliness of Presentation of Financial Statements of Local Government. IOP Conference Series: Materials Science & Engineering, Retrieved from
http://iopscience.iop.org/article/10.1088/1757-899X/180/1/012099/pdf.
Muda, I., Marlon, S., Erni, J., & Abikusno, D. (2016). Critical Success Factors Downstream Palm Oil Based Small & Medium Enterprises (SME) In Indonesia. International Journal of Economic Research. 13(8), 3531-3538.
Muda, I., Dharsuky, A., Sadalia, I., & Siregar, H. S. (2016). Impact of Capital Investments & Cash Dividend Policy on Regional Development Bank (BPD) PT. Bank Sumut to the district own source revenue & economic Growth. International Journal of Applied Business & Economic Research. 14(11),7863–7880.
Muda, I., Deni, Y. W., Erlina, A. M., Ade, F. L., & Rina, B. (2017). The Influence of Human Resources Competency & The Use of Information Technology on The Quality of Local Government Financial Report with Regional Accounting System as an Intervening. Journal of Theoretical & Applied Information Technology. 95(19), 1432–1451.
Muda, I., Mutia, I., & Marhayanie, M. (2017). Impact Allocation Capital Expenditure on the Improvement of the Local Government Assets in North Sumatra & Effect on Local Revenue Sustainability. International Journal of Economic Perspectives, 11(2), 151–164.
Muda, I. (2017). The Effect of Supervisory Board Cross-Membership & Supervisory Board Members' Expertise to The Disclosure of
Nasir, A., Yesi, M. B., Kamaliah & Muda, I. (2017). Effectiveness of Potential Tax Region as the Real Local Revenue Sources in Riau Coastal Area. International Journal of Economic Research, 14(12), 313–324.
Nurzaimah, Rasdianto & Muda, I. (2016). The Skills & Understanding of Rural Enterprise Management of the Preparation of Financial Statements Using Financial Accounting Standards (IFRs) Financial Statement on the Entities without Public Accountability (ETAP) Framework on the Implementation of Village Administration Law. International Journal of Applied Business & Economic Research. 14(11), 7417–7429.
Sadalia, I., Nur, A. B. R., & Muda, I. (2017). The Significance of
Internet Based Financial Information Disclosure on Corporates’
Shares in Indonesia. International Journal of Economic Research. 14(12), 337–346.
Sirojuzilam, Hakim, S., & Muda, I. (2016). Identification of Factors of Failure of Barisan Mountains Agropolitan Area Development in North Sumatera– Indonesia. International Journal of Economic Research. 13(5), 2163–2175.
Sugiyono, M. (2007). Educational Research Methods Quantitative, Qualitative R & D Approaches. Bandung: Alfabeta Publishers.
Tarmizi, H.B., Daulay, M & Muda, I. (2016). The influence of population growth, economic growth & construction cost index on the local revenue of tax on acquisition of land & building after the implementation of law no. 28 of 2009. International Journal of Economic Research, 13(5), 2285–2295.