International Journal of Economic Research
ISSN : 0972-9380
available at http: www.serialsjournal.com
© Serials Publications Pvt. Ltd.
Volume 14 • Number 8 • 2017
The Influence of Human Resource on Income in Regional Development
Hasman Hasyim
Agribusiness Studies Program, Faculty of Agriculture, Universitas Sumatera UtaraMedanIndonesia E-mail : hasman@usu.ac.id
Abstract: Regional development is determined by human resource since it is the determining factor of economic progress in an area. Empirical evidences show that availability of human resource has significant relationship with economic growth. Therefore, investment in human research becomes more prominent to increase long term return to scale. The objective of the research is to analyze the influence of human resource, especially regarding labor allocation, training, and labor productivity, both directly and by means of main agribusiness activity in regional development to increase income of paddy rice farmer.This research uses primary data from 100 farmers which are obtained by using simple random sampling. The data are analyzed by employing structural equation model (SEM) method.The result of SEM estimation shows that human resource, especially regarding labor allocation, training, and labor productivity, has indirect significant effect on the income of paddy rice farmers. In addition, main agribusiness activities have significant effect on the income of paddy rice farmers. Keywords: Human Resource, Farmers’ Income and Regional development.
I. INTRODUCTION 1.1. Research Background
and transfer payment as well as social welfare and unemployment insurance (Samuelson andNordhaus, 1997).According to the Central Bureau of Statistics, the area of irrigated land for rice paddy in the last five years (2008-2012) has been decreased due to land conversion. As a result, rice production and farmers’ income are also decreased. Next, the researcher states the problem formulation in the next section based on the description above.
1.2. Problem
Is there any influence of human resource, especially regarding labor allocation, training and labor productivity, directly and by means of main agribusiness activities in regional development to increase the income of paddy rice farmers?
1.3. Research Objective
The objective of the research is to analyze the influence of human resource, especially regarding labor allocation, training and labor productivity, directly and by means of main agribusiness activities in regional development to increase the income of paddy rice farmers.
2. LITERATURE REVIEW 2.1. Regional development
Regional development is a broad term but basically it involves various efforts to improve prosperity level in a certain region. The objectives of regional development include two interrelated sides (Triutomo, 2001).According to Sukirno (2001), from economic perspective, regional development can be seen as a process which increases people’s income in a long period of time. From the definition, it can be observed that economic development has a number of characteristics, such as:
a) a process of continuous changes b) an effort to increase people’s income
c) the increasing income happens continuously in a long period of time.
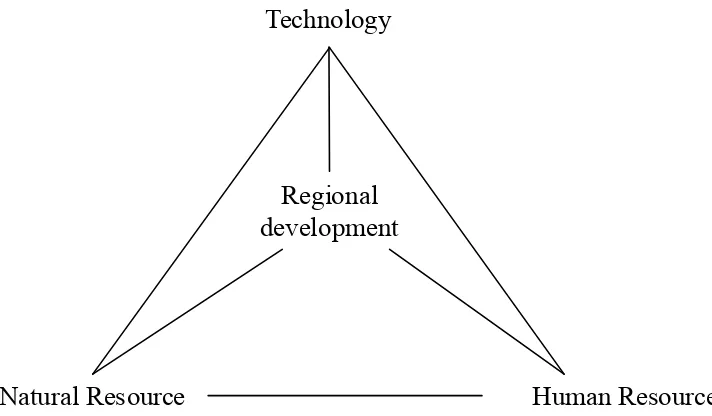
The target of long term regional development is economic growth and welfare improvement. Certain scenario is made based on the target in order to overcome possible obstacles by the use of resources. In Indonesian context, the problems of regional development usually deal with technological shortcomings to manage plentiful resources. Meanwhile, people as human resources are more related to social dimension. It is essential since each community has its own pattern to respond to technological advancement (Sasmojo, 2001).According to Zen (1980), Indonesian development in the following twenty or thirty years will depends much on three major elements namely (1) availability of natural resources, (2) competence of human resources, and (3) the use of technology. All of those elements have to be intended for community welfare. The relationships between the three elements are represented in Figure 1.
2.2. HumanResource in Regional Development
an effort to increase the standard of living. Frequently, more emphasis is given to the first aspect with assumption that the second aspect will be achieved once the first aspect has been well-developed. The human resource development begins in the family, improves through education and formal training and develops in the community, especially at the working place (Simanjuntak, 1982).
2.2.1.Labor Allocation
Labor is manpower to do an effort. The effort is an intention to produce goods. Enhancing production of agricultural products can be done by improve labor productivity. Additional labor is a common thing in agribusiness. Farmers usually employ more labors from outside of their families. However, this addition need to g hand in hand with more production (Simanjuntak, 1985).
Labor distribution along the year is an essential matter for farmers. Work distribution ensures the farmers that the income will be higher. Fairly distributed work according to the labor’s potential will decrease the need of additional labor from outside of the family (Soekartawi, 1995).Most farming labors are the member of the farmers’ family consisting of the father as the head of the family, the mother and their children. Children over 12 years old can become productive labors for farming. Labors from the farmers’ family are contributions of the family for overall farming production and never rated with money (Mubyarto, 1989).
The use of additional labors from outside of the farmers’ family is still inevitable in farming since it is needed to cover the lack of labors. Labor, especially labor from members of farmers’ family, is an important factor in farming (Tohir, 1983).
Labor allocation in farming includes seeding, tillage, planting, weed control, pest control, harvesting, and post-harvesting. In this case, the unit is men working day in every planting season which influences the production and income of paddy rice farmers and the effect of the variable itself.Farming labors are categorized into 1 working day of men labor: 8 hours of men working day, 1 working day of women labor:
Figure 1: Three Pillars of Regional development Study
Technology
Regional
development
0.8 hours of men working day, and 1 working day of children labor: 0.5 hours of men working day. Human labor can do all kinds of farming work according to their capability. Farming human labor is influenced by age, education, skill, welfare and natural factor (Hernanto, 1993).
2.2.2.Training
According to Law of Republic of Indonesia Number 16 of 2006, farming training is a process of learning for main actors of farming (actors of agricultural activities) and business actors so that they want and are capable of helping and organizing themselves to access information regarding market, technology, capital, and other resources as an effort to increase business efficiency productivity, income and welfare as well as to improve awareness of environment preservation (Human Resource Development Agency of Agricultural Department, 2007).
Training is not a production factor (Dalimuntheet al., 2016 and Lubiset al., 2016). It indirectly functions through individual change of attitudes. Trainer becomes an external factor which influences attitude of an individual in a way that the individual attitude towards technology will change whether the individual realizes it or not. Farmers’ appreciation of the technology encourages proper implementation of technology which will improve the production (Mardikanto, 1996).
According to Hasyim (2003), there is a positive relationship between the frequency of attending training and the success of training. If the frequency of attending training is high, the success will be high. The frequency of attending training increases because the training is interesting and the materials are useful. Training agent can help farmers to understand the great effect of social economic structure and technology in order to achieve a better life and to alter structure in order to overcome situations that hinder the achievement (Soekartawi, 1999). Training equips agricultural society with science, skills, technology and new farming innovations. It also creates diligent, cooperative, innovative, and creative human resources. Moreover, training changes attitudes and behaviors of agricultural society so that they are knowledgeable and willing to apply suggested information from trainers (Kartasapoetra, 1994; Muda and Dharsuky, 2015). P4Sstands forPusatPelatihanPertaniandanPerdesaanSwadaya(Agricultural and Rural Training Self-improvement Center). It is an educational or training institution owned and managed by farmers, both individually or in groups. This institution develops because of their success in farming. The objective of the training is to assist the participants in implementing principles of agribusiness entrepreneurship management in the activities of P4S (Agribusiness Entrepreneurship Development Center, Agricultural Human Resource Development Agency Jakarta, 2002).In order to improve the capability of human resources in seeding, the Technical Implementation Unit BalaiBenihIndukMurniTanjungMorawa, agriculture office of North Sumatra province has conducted trainings for farmers and breeders of all cities/regencies in North Sumatra.
The trainings which have been held by the Technical Implementation Unit Balai Benih Induk Murni Tanjung Morawa, agriculture office of North Sumatra province are as follows:
1. Human Resources Development for the Technical Implementation Unit Balai Benih Induk Murni Tanjung Morawa officers.
2. Human Resources Development Training for farmers/breeders groups in the Technical Implementation Unit Balai Benih Induk Murni Tanjung Morawa.
The aim of this activity was to integrate different perceptions and to improve the quality of paddy rice farming and breeding human resources in order to produce quality and certified rice in maintaining the flow of frozen seed. This activity was followed by farmers and breeders/farmers and breeders groups from all cities/regencies in North Sumatra with 16 batches consisted of more or less 500 people. 3. Integrated Rice Seed Field School (Sekolahla pangbenih paditerpadu/SLBPT)
The aim of this activity was to directly introduce new technology of rice plant farming and to provide a learning center for producing quality and certified rice seed, pest controlling and recording from tillaging until harvesting and seed selling in farming analysis book. The activity was followed by farmers/ farmers groups from five regencies (Langkat, Deli Serdang, SerdangBedagai, Batubara and Asahan) with 25 participants per regency.
4. Training of partnership meeting of farmers
This meeting aimed to improve farmers’ knowledge so that they can establish partnership in rice seed agribusiness with seeding business (PT, SHS, PT. Pertani, and the like).
5. Training for Farmers Group Coordinators
It was training on entrepreneurship, agribusiness, and management for human resources development in 2009. The participants were 150 people from 15 regencies/cities.
6. Workshop Partner Training
This training was followed by 56 participants from 27 regencies/cities. The aim was to improve skill in making standard organic fertilizer machine.
7. Training of Farming Statistical Data Gathering
The training was followed by farming trainers and farming statistical data management staff from all regencies/cities. There were 200 participants in 4 batches. This training aimed to assist the participants in understanding methodology of statistical data gathering method.
8. Quality Development of Assessment and Operational Testing Staff BPMA Depok
This training was followed by five Technical Implementation Unit laboratory staff. The aim of this training was to improve laboratory staff ’s skill in agricultural machines quality testing (North Sumatra Agricultural Office, 2011).
Paddy rice agribusiness is closely related to human resources development through training. In this case, paddy rice farming urgently requires skillful, knowledgeable and broadminded human resources to adopt technology. Therefore, farmers are required to take part in trainings or field school in districts, regencies, provinces or national training. These variables are calculated for each planting season. The unit is how many times the farmers join in trainings or the frequency which influences the production and income of paddy rice farmers and the effect of the variable itself.
2.2.3. Labor Productivity
participation per time unit. In order to increase income or welfare, the productivity of each area and time unit need to be increased and the labor need to be distributed optimally.
The operational definition of productivity is the comparison between the results (output) and resources (input) used per time unit. This operational definition involves measurement method. Even though it is theoretically possible, the implementation will be difficult. The main reason is the resources consist of a number of different types of resources with different proportions.The third definition implies that productivity enhancement can be manifested in four following forms:
a) The same number of production achieved by using fewer resources. b) More production achieved by using fewer resources.
c) More production achieved by using the same number of resources. d) Much more production achieved by few additional resources.
Increasing productivity and income needs an integrated program which aims to develop appropriate technology and purposeful human resources development. In this case, the goal is change in farmer households which consist of men, women and children who are capable to contribute in the process of production and other activities which generate income (Sajogyo, et al., 1980).
2.3. Income
The aim of farming is to generate income in order to fulfill needs and cost of other activities. In order to gain the desired income, farmers need to consider the selling price of their products. However, most farmers cannot calculate elements of production costs and determine selling price of their products, resulting in low effectiveness (Hernanto, 1993).Farming income is the difference between farming output and input. Income is very much influenced by the number of productions; if the production is high, the income will be high (Soekartawi, 1995 and Tarmizi et al, 2017).
2.4. Conceptual Frameworkof the Research
Regional development is an action to develop an area or region in order to improve community prosperity level. Its goal has to be translated into the national development framework of the Unitary State of the Republic of Indonesia which is to achieve rapid income per capita development, provide sufficient job opportunity, equitable distribution of income, reduce gap between income levels, welfare, development, and regional capability and build balanced economic structure (Hadjisaroso, 1994).
In order to increase farmers’ income in regional development, farmers need to increase value added activities in their farming so that their income will increase. Therefore, it is necessary to regulate and develop a paddy rice agribusiness system.The variables of this research for analyzing the influence of human resources in regional development consist of labor allocation, training and labor productivity to increase paddy rice farmers’ income.This research employs Structural Equation Modelingwhich is a statistical model using hypothesis testing approach or known as Confirmatory. The program used for the analysis is AMOS 19 (Analysis of Moment Structure).
3. RESEARCH METHODOLOGY
and price of unhulled rice) to increase paddy rice farmers income in regional development, this research employs Structural Equation Modeling which is a statistical model using hypothesis testing approach or known as Confirmatory. The program used for the analysis is AMOS 19 (Analysis of Moment Structure).
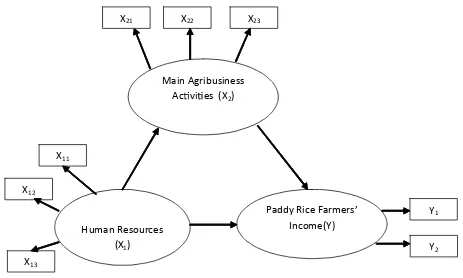
Figure 2: Positive significant relationship of human resources directly and by means of main agribusiness activities in regional development to increase paddy rice farmers income
Main Agribusiness Ac vi es (X2)
Human Resources (X1)
Paddy Rice Farmers’ Income(Y)
Y2
X22 X23
X11
X12
X13
Y1 X21
3.1. Structural Measurement Equation and Specification
The influence of natural resources, on developing area, toward paddy rice farmers’ income in SerdangBerdagai North Sumatera could be described in these equations:
3.1.1. Structural Measurement Equation
3.1.2. Exogenous Variable Measurement Equation
1. Natural resources (X1),consisted of water volume height (X11), the area of irrigated land (X12) and the length of farming road (X13)
X11 = �=11�11 + e1 X12 = �=12�12 + e2 X13 = �=13�13 + e3
3.1.3. Endogenous Variable Measurement Equation
X21 = �=11�1 + e1 X22 = �21�1 + e2 X23 = �31�1 + e3
2. The income of paddy rice farmer (Y) consisted of production (Y1)and land productivity (Y2)
y1= �4.2ή2 + �4
y2 = �5.2ή2 + �5
3.2. Measurement Model Specification for Each Construct / Latent Variable
Confirmatory factor analysis for measurement model would result a coefficient called loading standard or lambda value ( The lambda value is used to assess the matching, the suitability, or the undimensionality of the instruments in the form of factor.
3.3. Evaluation Test of Structural Model Assumption
3.3.1. Data Normality Evaluation
Normality evaluation was carried out using the criteria of critical ratio skewness value by ± 2,58at significance level of 0,01. The distribution is normal if critical ratio skewness value is below the absolute value of 2,58 (Sirojuzilam, et al, 2016 and Tarmizi, et al, 2016). Normality could be tested by looking at the figure of data histogram or could be tested by using statistic test by observing Skewness value and kurtosis which was Z-value resulted by this equation :
6
Skewness Nilai z
N
� �
Information : N = Sample size
If Z-value > , it is suspected that the distribution is not normal. Critical value can be used based on the desired significance level, for example if the critical value is ± 2,58 (significance level of 0,01 (1%) means that we can object normality assumption on probability level (Hair et al, 1998).
3.3.2. Outliers Evaluation
3.3.3.Multicollinearity Evaluation
Small determinant value or close to 0 indicates multicollinearity or singularity which means the data cannot be used for research. Multicollinearity can be observed through covariance matrix determinant.
3.3.4.Residual Value Evaluation
The essence of SEM is conformity between restricted covariance matrix[“ (0)] and covariance matrix sample (S). The difference between those two values is reflected in the value of residual covariance matrix. AMOS 19 gives the output of unstandardized dan standardized residual value. Standardized residual value is fitted residualvalue divided by standard error, so that for analog with Z value, the standardized residual value > 2,58 (Ghozali, 2008).
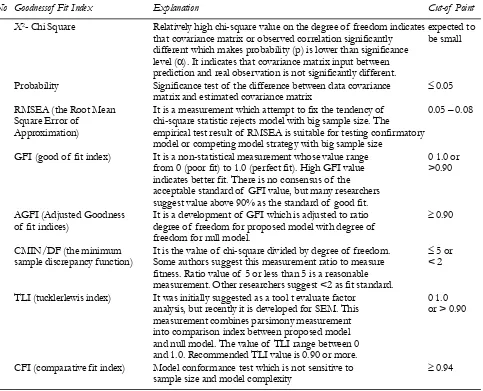
3.4. Model Conformance Testand Statistical Test Table 1 Goodness of fit test
No Goodnessof Fit Index Explanation Cut-of Point
1 X2- Chi Square Relatively high chi-square value on the degree of freedom indicates expected to
that covariance matrix or observed correlation significantly be small different which makes probability (p) is lower than significance
level (�). It indicates that covariance matrix input between prediction and real observation is not significantly different.
2 Probability Significance test of the difference between data covariance � 0.05
matrix and estimated covariance matrix
3 RMSEA (the Root Mean It is a measurement which attempt to fix the tendency of 0.05 –0.08 Square Error of chi-square statistic rejects model with big sample size. The
Approximation) empirical test result of RMSEA is suitable for testing confirmatory model or competing model strategy with big sample size
4 GFI (good of fit index) It is a non-statistical measurement whose value range 01.0 or from 0 (poor fit) to 1.0 (perfect fit). High GFI value >0.90 indicates better fit. There is no consensus of the
acceptable standard of GFI value, but many researchers suggest value above 90% as the standard of good fit.
5 AGFI (Adjusted Goodness It is a development of GFI which is adjusted to ratio � 0.90 of fit indices) degree of freedom for proposed model with degree of
freedom for null model.
6 CMIN/DF (the minimum It is the value of chi-square divided by degree of freedom. � 5 or sample discrepancy function) Some authors suggest this measurement ratio to measure < 2
fitness. Ratio value of 5 or less than 5 is a reasonable measurement. Other researchers suggest <2 as fit standard.
7 TLI (tucklerlewis index) It was initially suggested as a tool t evaluate factor 01.0 analysis, but recently it is developed for SEM. This or > 0.90 measurement combines parsimony measurement
into comparison index between proposed model and null model. The value of TLI range between 0 and 1.0. Recommended TLI value is 0.90 or more.
8 CFI (comparative fit index) Model conformance test which is not sensitive to � 0.94
sample size and model complexity
After the model is estimated, the residual has to be small or close to zero and the frequency distribution of residual covariance has to be symmetrical (Muda, et al, 2016). In this context, the residual is not the residual of score like in other multivariance modeling, but it refers to residual of covariance. Asymmetrical residual frequency distribution indicates that it is a poorly fitting model and it is in the process of estimation. After the model is accepted, the researcher can consider model modification to fix theoretical explanation or goodness of fit. Modification must be done based on a number of considerations. If the model is modified, the model must be cross-validated (estimated with separated data) before the model modification is accepted.
Model measurement can be done with modification indices. The value of modification indices equals the decrease of Chi-square if the coefficient is estimated. Value of 3.85 or less indicates that there is significant decrease of chi-square. Indication of a misfit model can be observed from the value of modification index (MI) which can be perceived as statistic chi-square (X-2) with degree of freedom = 1. It is specific for each fixed parameter. AMOS gives MI which is the value of X2 statistic which will decrease if the parameter is covarianced. It needs to be noted that covariancing error has to theoretical or logic; without any theoretical basis, the model will not be meaningful. If the researcher decides to repeat the model estimation, the research is no longer a confirmatory analysis. Instead, it is an exploratory research. Confirmatory analysis only analyze whether proposed hypothesis is empirically rejected or cannot be rejected (Ghozali, 2008).
3.5. Hypothesis and Causal Relationship Testing
Direct effect is observed from standardized regression weight with significance of comparison value CR (Critical Ratio) which shows equal value of t-count and t-table. If t-count is bigger than t-table, it means that the effect is significant. Casual relationship between variables can be observed from the output of AMOS 4.01 by observing direct effect, indirect effect and total effect.
FINDINGS AND DISCUSSION
4.1.1. Structural Measurement Equation
� = �x1�x1 + �x2�x2 + �
4.1.2.Exogenous Variable Measurement Equation
1. Natural resources (X1),consists of water volume height (X11), the area of irrigated land (X12) andthe length of farming road (X13)
X11= �1.1 � 1 + �1
X12= �2.1 � 1+ �2
X13= �3.1 � 1+ �3
4.1.3.Endogenous Variable Measurement Equation
X21= �1.1ή1 + �1
X22= �2.1ή1 + �2
X23= �3.1ή1 + �3
2. The income of paddy rice farmer (Y) consists of production(Y1)andland productivity (Y2)
y1= �4.2ή2 + �4
y2 = �5.2ή2 + �5
The path analysis model can be written in mathematical/structural equation as follow: Information
� = Loading Standard = the coefficient showing influence
� = Measurement error of exogenous variable (independent variable)
� = Measurement error of endogenous variable (dependent variable) can be expressed in following equations :
ή1 : �1.1 �1 + �1.2 �2+ �1.3 �3+ �1.5 �5+�1 (2.1) ή1 :0,767+ 0,213+-0,025+0,002 +0,000 +�1 (2.1) ή2 : �2.1 �1 + �2.2 �2+ �3.3 �3+ �4.5 �5+ �2.1ή1+ �2 (2.2) ή2 :0,280+ 0,686+ -0,274+ 0,023+ 0,103 +- 0,146 + �2 (2.2) Information :
X11X12 = Natural resources variable X21X23=Main farming agribusiness activity Y1Y2 = Income of paddy rice farmer
� (lambda) = the magnitude of exogenous variable influence toward endogenous variable
� (Zeta) = Regression residual value
� (sigma) = the magnitude of vector error in the relationship between variables.
4.2. Measurement Model Specification for Each Construct / Latent Variable
Analysis of confirmatory factor for measurement model will result in coefficient called standard loading or lambda value (Lambda value is used to asses conformity, suitability or unidimensionality of instruments which construct a factor.
Regression Weight Result
Some indicators shows estimate value above 0.5 and some others are under 0.5. The p values are p > 0.1 and p < 0.1. It means that each indicator from X11 to X12 has positive and significant effect on technology. Next, technology (X1) has significant positive effect on income through main farming agribusiness activities with estimate value of 1.618 and has non-significant positive effect with indicators from X11 to X12 having non-significant positive estimate value.
4.3. Evaluation Testing of Structural Model Assumption
4.3.1.Data Normality Evaluation Result
There are two main parts of output regarding data normality test. The first part is c.rskewness value and c.r kurtosis value. Distribution is considered normal when the data is not deviated to the right or the left (symmetrical; the skewness value is 0) and having ideal peak (kurtosis value is 0). However, the ideal value is difficult to obtain in the real situation. Therefore, data distribution is considered normal if the values of c.r.skewness and c.r kurtosis from X1 until X30 are between -2.58 and +2.58. In this research, the values of c.r.skewness and c.r kurtosis from X1 until X30 are between-2.58 and +2.58. The multivariate value is also within the acceptable range (2.223). It means that the data is in normal distribution.
4.3.2.Outliers Evaluation Result
The numbers in outlier evaluation table indicates the distance between a single data to a certain central point. A data has outlier if its p1 and p2 values are below 0.1. The mahalanobis distance value of data in this research is (34.0.0001) = 66.25. The outlier evaluation table shows that the values of p1 and p2 are above 0.1 which means there is no outlier in the data.
4.3.3.Multicollinearity Evaluation Result
Multicollinearity can be observed from covariance matrix determinant. The determinant value shows indication of multicollinearity or singularity problem which means the data cannot be used for research. AMOS output shows the value of determinant of sample covariance matrix = 171,685 which means there is no multicollinearity or singularity problem in the analyzed data.
4.3.4. Residual Value Evaluation Result
Residual value evaluation indicates that the model can be accepted significantly and the residual value is between -2.58 and +2.58.AMOS output shows unstandardized and standardized residual values. However, fitted residual depends on measurement unit. Standardized residual value is fitted residual value divided by standard error. Therefore, analog with Z value score > 2.58. It can be concluded from the result of standardized error value that the residual value (attached) is in good value (>2.58).
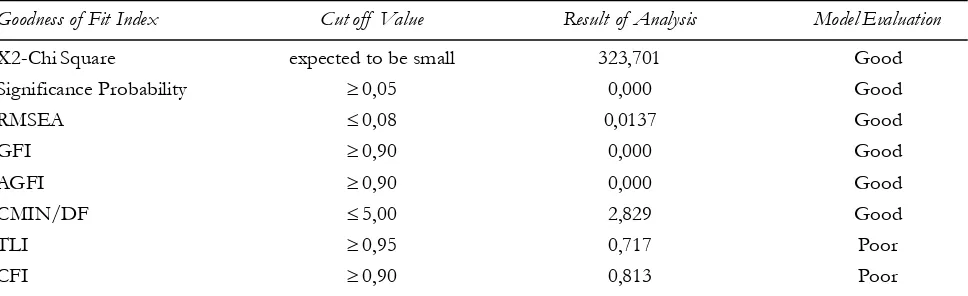
4.4. Model Conformance Test and Statistical Test Results
4.5. Hypothesis 6 Test Result. Analyzing the Influence of Natural Resource Directly and by Means of Main agribusiness activity in Regional development on Increasing Income of Paddy rice farmers
Table 3 Hypotheses
Effect/Relationship Value Positive Significant Direct effect of natural resources on increasing income 0,330 Positive No Effect of natural resources by means of main agribusiness activities in 0,330 + 1,214 Positive *** regional development on increasing income = 1,544
Table 3 indicates that the direct effect of natural resources which consist of height of water volume/ Ha, areaof irrigated land and length of farming way in regional development have positive non-significant effect on increasing income of paddy rice farmers. The table shows value of 0.330 which means if the initial income was Rp 10,000, it will be increased to Rp 10,330. By means of main agricultural activities, natural resources have positive significant effect. The value shows 1.544. It means that if the initial income is Rp 10,000, the income will increase Rp 1,544.
4.5. Hypothesis Testing Result. Analyzing the Influence of Human Resource Directly and by Means of Main Agribusiness activity in Regional development on Increasing Income of Paddy Rice farmers
Table 4 Hypotheses
Effect/Relationship Value Positive Significant Direct effect of human resources on increasing income -0.194 Negative No Effect of human resources by means of main agribusiness activities in -0.194+ 1.214 Positive *** regional development on increasing income = 1.020
Table 2
Goodness of Fit Test Result
Goodness of Fit Index Cut off Value Result of Analysis Model Evaluation
X2-Chi Square expected to be small 323,701 Good
Significance Probability � 0,05 0,000 Good
RMSEA � 0,08 0,0137 Good
GFI � 0,90 0,000 Good
AGFI � 0,90 0,000 Good
CMIN/DF � 5,00 2,829 Good
TLI � 0,95 0,717 Poor
Table 4 indicates that the direct effect of human resources which consist of labor allocation, training and labor productivity in regional development have negative non-significant effect on increasing income of paddy rice farmers. The table shows value of -0.194 which means if the initial income was Rp 10,000, it will be increased to Rp. 10,194. By means of main agricultural activities, human resources have positive significant effect on increasing income. The value shows 1.020. It means that if the initial income is Rp 10,000, the income will increase Rp. 1,020.
4.5.1. Hypotheses Testing Results
Human resources (X1) have negative non-significant effect on increasing income (Y) directly with value of -0.914. By means of main agricultural activities, human resources have positive significant effect (X2) on increasing income with value of 1.020 and variance above 0.5.The next is human resources (X7). Therefore, the seventh hypothesis which states that human resources have significant positive effect on increasing income by means of main agribusiness activities in farming (X2) is accepted.
Natural resources (X6) have positive non-significant effect on increasing income (Y) directly with value of 0.330. By means of main agricultural activities, natural resources have positive significant effect (X2) on increasing income with value of 1.544 and variance above 0.5.The next is natural resources (X1). Therefore, the hypothesis which states that natural resources (X1) have significant positive effect on increasing income by means of main agribusiness activities in farming (X4) is accepted.
4.5.2. Direct Effect, Indirect Effect and Total Effect 4.5.2.1. Direct Effect
X1 X2 = 0,210
Direct relationship between natural resources and main agribusiness activities increases income in the amount of 0.210
4.5.2.2. Indirect Effect
X1 X2 - 0,255
Indirect relationship between natural resources and main agribusiness activities increases income in the amount of -0.255
4.5.2.3. Total Effect = Direct Effect + Indirect Effect 0,465 = 0,210+- 0,255
Direct effect plus indirect effect of natural resources result in the total effect of0.465.
4.6. Discussion
Neo classical regional development theory, which is pioneered byBorts Stein (1964) and developed by Roman (1965) and Siebert (1969), states that regional economic development depends on labor, capital and technology advancement. This theory does not emphasize the importance of demand. The research findings indicate that the direct effect of human resources which consist of labor allocation, training and labor productivity in regional development have negative non-significant effect on increasing income of paddy rice farmers. The table shows value of -0.194 which means if the initial income was Rp 10,000, it will be increased to Rp 10,194 (see table 5.81 on appendix). It is supported by Daniel et al. (2014) who state that paddy rice farming labor allocation does not have significant effect on family income. In line with this statement, Harianto and Dwi Astuti Bertha Susila (2008) argue that the recent use of labor is not efficient, which can be observed from negative number of production elasticity. Additional labor will decrease the production of rice.The research findings show that by means of main agricultural activities, human resources have positive significant effect on increasing income. The value shows 1.020. It means that if the initial income is Rp 10,000, the income will increase Rp 1,020.
The present study supports the finding from Sutrisno (2009) which finds that the analysis of Pearson correlation shows strong correlation between labor cost and farmer income. It can be observed from the correlation coefficient which is 0.994 with probability value of 0.000. It means that there is a very strong relationship between labor cost and farmer income.
Similarly, Arianti, et al. (2010) suggest that factor of production which has significant effect on farming production in rice central area is the use of labor from outside of family members. On the other hand, factor of production which has significant effect on farming production in non-central area is the use of labor from the family members. Average income of farmer in central area in Lebong Regency is Rp6,951,169,83/ut/mtand average income of farmer in non-central area in Lebong Regency is Rp, 1,657,611,41/ut/mt.
Regarding to farming training, Hasyim (2009) argues that training method has a significant effect on farmer income. Significance of t-count 3.354 is bigger than t-table 1.701 (� = 0.05). It means that training method has significant effect on farmer income.In line with the previous statement, Saadah et al. (2011) state that training of jajarlegowoplanting system increases farmer income to Rp 8,093,865.50 or 65% after the farmers implement the planting system. Chi-square (X2) analysis shows that there is a relationship between the role of
farming training as the independent variable and farmer income as the dependent variable. The result of coefficient of contingency (C) = 0.75 which means that the relationship is closely related.
Similarly, Stanton (2000) argues that local agribusiness enterprises offer opportunity to obtain adding value so it will increase local income. Since most of the farmers rely on government to buy their products, private companies cannot directly fill in the place after the service has been revoked.Fan (2000) argues that China has great potential to increase production by reducing regional differences in local efficiency. Stagnant technical efficiency after 1984 may be a result from ineffective training after reformation. Therefore, training system need to be strengthened in order to be more efficient in production.
Table 4 shows that the biggest labor productivity is in the range of � 2 quintal for every men working day (32 samples / 32%)and the smallest labor productivity is in the range of � 0.99 quintal for every men working day (29 samples / 29%).
This finding is supported by Rusastra and Suryadi (2004) who state that labor contribution determines the performance of rice farming which needs a lot of labors. Labor shortage and uncontrolled increase of wage have to be prevented. Main income sources of farming labors are farming and non-farming activities. Farming laboring contributes 78.60% of total laboring income and total laboring income contributes 44.80% of total family income. Non-farming activities contribute 23.30% of income. The success in maintaining reasonable wage level and establishing opportunity and accessibility of non-farming activities play an important role in improving welfare of farming labors.
In line with previous statement, Daniel et al. (2014) argue that labor productivity is a comparison between income and total number of labors allocated for farming (Rp/man-day). Labor efficiency or labor productivity can be measured by considering the number of production, income each day, and land area. The productivity is the comparison between income (Rp. 3,563,148) and labor (50 man-days). The average productivity of labor allocation is 1.6635 quintal for each men working day. It shows that the productivity Rp. 92.293/man-day.Based on the finding, it can be concluded that the influence of human resources in regional development on income need to be utilized in line with the effort to increase farmer income in Serdang Bedagai regency, North Sumatra.
The research findings indicate that the direct effect of natural resources which consist of the height of water volume/Ha, area of irrigated land, and the length of farming way in regional development have positive non-significant effect on increasing income of paddy rice farmers. The table shows value of 0.330 which means if the initial income was Rp 10,000, it will be increased to Rp 10,330. (see table 5.81 on appendix). The research findings also show that by means of main agricultural activities, natural resources have positive significant effect on increasing income. The value shows 1,544. It means that if the initial income is Rp 10,000, the income will increase Rp 1,544.
It is supported by Hayati (2013) who states that inundation of 0.25 and 2.5 cm will not affect the growth of the plant, number of tillers, grain production and production component. Average productivity of Ciherang variety rice in every inundation treatment range between 6.6 ton/Ha and 6.9 ton/Ha. The need of land water for the plant growth is fulfilled which is shown by the fact that availability of land water before irrigation is not significantly different from all inundation treatments. Inundation f 2.5 can be implemented in rice cultivation.
Similarly, Chapagain and EiiYamaji (2010) finds that Alternate Wet and Dry Irrigation method save 28% of water without significant influence on rice production.It is supported by Rajagukguk (2011) who suggests that there is a significant difference between productivity and income before and after the establishment of irrigation channel. Productivity and income after the establishment of irrigation channel is higher compared to before the establishment of irrigation channel.Next, Damayanti (2013) argues that farmer income is influenced by land area, price of seed, price of urea, price of phonska fertilizer, price of pesticide, farmer’s education, wage, and irrigation. The last factor, irrigation, increases 1.44% of farmer income.
the managers of their own farming certainly need transportation infrastructure to facilitate mobility of farming machines, transportation from home to the field, carrying production to the market. The unit of farming way is meter.If the farming way is not in a good condition, then the farmers’ mobility will be disturbed. This will influence the production and decrease the farmer income.It is supported by KMK RejangLebong (2011) that state that road construction will reduce transportation cost. Before the construction of farming road, the farmers carried their production through a pathway which was only accessible by humans. The cost of transportation of one sack of rice was Rp 5,000. After they carried the rice sack to the main road, they will need another public transportation to carry the rice sack to their home. After the road has been constructed, the cost of transportation can be reduced up to Rp 4,000 per sack which means the transportation cost of one sack is only Rp 1,000.
The road is constructed to serve 300 Ha of rice paddy owned by 275 families. Each family owns approximately 1.09 Ha of rice paddy. In average, each Ha produces 60 sacks of rice. It means that the transportation cost saving for each family can be calculated as follows:
The transportation cost before road construction is Rp 5,000 x 60 sacks = Rp 3,00,000. The transportation cost after road construction is Rp 1,000 x 60 sacks = Rp 60,000. So each family saves Rp 240,000. There are two harvesting seasons in one year. It means each family earns additional income of Rp 480,000 for each year.It is in line with Ruauw, et al. (2010) who state that the benefits of farming road can be observed from farmer income before and after the road construction. The income of cabbage and carrot farmer is raised from Rp 11,155,566 to Rp 12,062,334 after the road construction. It means there is an 8.13% increase of income which is caused by reduction of transportation cost.Based on the finding, it can be concluded that the influence of natural resources in regional development on income need to be utilized in line with the effort to increase farmer income in SerdangBedagai regency, North Sumatra.
5. CONCLUSIONS AND SUGGESTIONS 5.1. Conclusion
Natural resources which include the height of water volume/Ha, the area of irrigated land, and the length of farming way do not significantly influence income of paddy rice farmers. On the other hand, main agricultural activities havesignificant effect in increasing income of paddy rice farmers.
5.2. Suggestions
Based on the research findings, the researcher suggests the following suggestions for both practical and academic purposes:
REFERENCES
Authority, I ketutTrisna., And I Nyoman Mahaendra Yasa. (2013), Effectiveness and Impact Program AgainstSimantri Revenue and Employment Opportunities In Rural Farmer Households Kelating District of KerambitanTabanan.
E-Journal of Development Economics UNUD.2(7). pp. 1-34.
Azwirand Ridwan. (2009), Increasing Productivity With Improved Rice Cultivation Technology. Deeds Journal Agrosia.12(2). pp. 212-218.
Dalimunthe, D. M. J., Fadli, and Muda, I. (2016), The application of performance measurement system model using Malcolm Baldrige Model (MBM) to support Civil State Apparatus Law (ASN) number 5 of 2014 in Indonesia.International Journal of Applied Business and Economic Research.14(11), pp.7397-7407.
Ghozali, Imam. (2008), Structural Equation Modeling. Concepts & Applications With AMOS Program 16.0. Agency Diponegoro University Publisher. Semarang.
Gumbira, Said., E. Rahmayanti and M.Z. Muttaqin. (2001), Agribusiness Technology Management, Global Product Key Agribusiness
Competitiveness. Agriculture Mandiri.Governmental spreader. Jakarta.
Hadi, Nasrul. (2004), Replace Rice With Palm. Jambi.Department of Forestry and Plantation East Tanjung Jabung. Hadjisaroso. (1994), Basic Concepts of Regional Development, Indonesia. In Prisms No. 8. August 1994. Jakarta. Hair, Jr., Joseph F., Rolph E. Anderson, Ronald., L Taatham and William C. Black. (1998), Multivariate Data Analysis with
Readings, (Third Eds), New York. McMillan Publishing Company.
Hernanto, F. (1993), Farming Sciences.Governmental spreader. Jakarta.
Husodo, S.Y., et al. (2004), Agriculture Mandiri.Outlook Strategy for Advancement of Agricultural Experts Indonesia.Governmental spreader. Jakarta.
Irianto, A. (2004), Statistics Basic Concepts And Applications. Kencana. Jakarta.
Isaac, Andi., Bunaiyah Honorita., and Yesmawati. (2013), Effect of Rice Cultivation Technology Application Improvement Against
Farmer Income In the village of Taba Penanjung Central Bengkulu Regency. BPTP Bengkulu.
Lubis, A.,Torong, Z.B., and Muda, I. (2016), The urgency of implementing balanced scorecard system on local government in North SumatraIndonesia. International Journal of Applied Business and Economic Research.14(11). pp,7575-7590. Maryatmo and Susilo. (1996), Small Business Problems to Macro Economic Issues. Atma Jaya University, Yogyakarta.
Muda, I, Marlon Sihombing, Erni Jumilawati and Abikusno Dharsuky. (2016), Critical Success Factors Downstream Palm Oil Based Small and Medium Enterprises (SME) in Indonesia. International Journal of Economic Research. 13(8), pp. 3531-3538.
Muda, I and AbykusnoDharsuky (2015), Impact of Region Financial Information System (SIKD) Quality, Role Ambiguity And Training on Precision of Financial Statement of Local Government Presentation In North Sumatra. International
Journal of Applied Business and Economic Research, 13(6). pp. 4283-4304.
Nugraha, S. Udin and Bambang Sayaka. (2003), Industrial and Institutional Seeding Rice. Economy Rice and Rice Indonesia.Agency for Agricultural Research and Development.Pertaniasn Department, Jakarta.
Pramono, Joko., Seno Basuki., and Widarto. (2005), Efforts Penigkatkan Rice Productivity Through Crop Management Approach And Integrated Resource. Agrosains 7(1). pp.1-6.
Prayoga, Adi. (2010), Productivity and Technical Efficiency of Organic Rice Farming Wetland. Agro Economic Journal.
28(1). pp. 1-19.
Samuelson, Paul A. and Nordhaus, William D. (1997), Macroeconomic.Translation.Erlangga Publishers.
Sasmojo, Saswinadi. (2001), Wisdom Technology for Development Region: Basic Principles Thought in the Three Pillars of Regional
Development, Natural Resources, Human Resources, Technology, Editor. Alkadri, Muchdie and Suhandoyo.Publisher Center
for Policy Studies BPP Technology Technological Development Area. Jakarta.
Singh, Inderjit., Lyn Squire., John Strauss. (1986), Agricultural Household Models, Extensions. Applications and Policy.Published for the World Bank.The John Hopkins University Press.Baltimore and London.
Sirojuzilam, Hakim, S., and Muda, I. (2016), Identification of factors of failure of Barisan Mountains Agropolitan area development in North SumateraIndonesia. International Journal of Economic Research. 13(5). pp. 2163-2175.
Slamet, M. (2003), Establishing Human Behavior Pattern Development.First Edition.IPB Press. Bandung. Soekartawi. (1995), Analysis of Farming. UI.Press. Jakarta.
Sukirno, Sadono. (2001), Process of Economic Development. Problems and Policies Basis Issuing Faculty of Economics.University of Indonesia. Jakarta.
Tarmizi, H.B.,Daulay, M and Muda, I. (2016), The influence of population growth, economic growth and construction cost index on the local revenue of tax on acquisition of land and building after the implementation of law No. 28 of 2009. International Journal of Economic Research.13(5). pp. 2285-2295.
Tarmizi,HB.,Daulay, M., and Muda, I. (2017), Impact of The Economic Growth and Acquisition of Land to The Construction Cost Index in North Sumatera. IOP Conference Series : Materials Science and Engineering. 180. doi: 10.1088/ 1757-899X/180/1/012004.
Triutomo, Sugeng. (2001), Formation of Regional Development Through Integrated Economic Development Zone in the Three Pillars of
Regional Development, Natural Resources, Human Resources, Technology, Editor. Alkadri, Muchdie and Suhandoyo.Publisher
Center for Policy Studies BPP Technology Technological Development Area. Jakarta.