Lampiran 1
Daftar Populasi, Kriteria dan Sampel
NO KODE NAMA PERUSAHAAN KRITERIA SAMPEL
NO KODE NAMA PERUSAHAAN KRITERIA SAMPEL
1 2 3
114 GGRM Gudang Garam Tbk √ √ √ Sampel 12
115 HMSP Hanjaya Mandala Sampoerna Tbk √ √ × -
116 RMBA Bentoel International Investama Tbk √ √ × -
117 WIIM Wismilak Inti Makmur Tbk √ × × -
118 DVLA Darya Varia Laboratoria Tbk √ √ × -
119 INAF Indofarma Tbk √ √ × -
120 KAEF Kimia Farma Tbk √ √ √ -
121 KLBF Kalbe Farma Tbk √ √ √ Sampel 13
122 MERK Merck Indonesia Tbk √ √ √ Sampel 14
123 PYFA Pyridam Farma Tbk √ √ × -
124 SCPI Merck Sharp Dohme Pharma Tbk √ × × -
125 SIDO Industri Jamu dan Farmasi Sido Muncul Tbk √ × × -
126 SQBB Taisho Pharmaceutical Indonesia Tbk √ × × -
127 TSPC Tempo Scan Pasific Tbk √ √ × -
128 MBTO Martina Berto Tbk √ √ × -
129 MRAT Mustika Ratu Tbk √ × × -
130 TCID Mandom Indonesia Tbk √ √ √ Sampel 15
131 UNVR Unilever Indonesia Tbk √ √ √ Sampel 16
132 KDSI Kedawung Setia Industrial Tbk √ √ × -
133 KICI Kedaung Indag Can Tbk √ √ × -
Lampiran 2
Daftar Sampel Penelitian
No Kode Perusahaan Nama Perusahaan
1 INTP Indocement Tunggal Prakasa Tbk
2 SMCB Holcim Indonesia Tbk
3 SMGR Semen Gresik Tbk
4 TOTO Surya Toto Indonesia Tbk
5 TRST Trias Sentosa Tbk
6 CPIN Charoen Pokphand Indonesia Tbk
7 ASII Astra International Tbk
8 AUTO Astra Auto Part Tbk
9 ICBP Indofood CBP Sukses Makmur Tbk
10 INDF Indofood Sukses Makmur Tbk
11 ROTI Nippon Indosari Corporindo Tbk
12 GGRM Gudang Garam Tbk
13 KLBF Kalbe Farma Tbk
14 MERK Merck Indonesia Tbk
15 TCID Mandom Indonesia Tbk
Lampiran 3
Data Variabel Penelitian Tahun 2010
NO Kode Perusahaan Variabel
TAG DER DPR PBV
Data Variabel Penelitian Tahun 2011
NO Kode Perusahaan Variabel
Lampiran 5
Data Variabel Penelitian Tahun 2012
NO Kode Perusahaan Variabel
TAG DER DPR PBV
Data Variabel Penelitian Tahun 2013
NO Kode Perusahaan Variabel
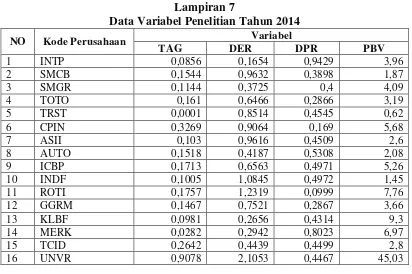
Lampiran 7
Data Variabel Penelitian Tahun 2014
NO Kode Perusahaan Variabel
TAG DER DPR PBV
TABEL PERHITUNGAN t-TABEL
Derajat Bebas
Tingkat
Signifikansi T Tabel
75 0,05 1.99210
76 0,05 1.99167
77 0,05 1.99125
LAMPIRAN 8
HASIL PENGUJIAN EVIEWS
1.1Statistika Deskriptif
PBV TAG DER DPR
Sumber: Hasil Penelitian 2016 (data diolah)
1.2 Uji Normalitas
Sumber: Hasil Penelitian 2016 (data diolah)
1.3 Uji Multikolinieritas
1.4 Uji Heterokedastisitas dengan Uji White
Heteroskedasticity Test: White
F-statistic 0.575904 Prob. F(9,70) 0.8124
Obs*R-squared 5.515215 Prob. Chi-Square(9) 0.7873 Scaled explained SS 22.59648 Prob. Chi-Square(9) 0.0072
Sumber: Hasil Penelitian 2016 (data diolah)
1.5 Uji Autokorelasi dengan Uji Durbin-Watson
Dependent Variable: PBV Method: Least Squares Date: 04/14/16 Time: 10:32 Sample: 1 80
Included observations: 80
F-statistic 3.534316 Durbin-Watson stat 1.913431 Prob(F-statistic) 0.006402
Sumber: Hasil Penelitian 2016 (data diolah)
2.1 Common Effect Model (CEM)
Dependent Variable: PBV? Method: Pooled Least Squares Date: 04/14/16 Time: 10:58 Sample: 2010 2014
Included observations: 5 Cross-sections included: 16
Total pool (balanced) observations: 80
Variable Coefficient Std. Error t-Statistic Prob.
TAG? 3.152340 6.745937 0.467295 0.6416
DER? 6.768253 2.603862 2.599313 0.0112
DPR? 7.278269 3.009717 2.418257 0.0180
R-squared 0.175233 Mean dependent var 7.731750
2.2 Fix Effect Model (FEM)
Dependent Variable: PBV? Method: Pooled Least Squares Date: 04/14/16 Time: 11:01 Sample: 2010 2014
Included observations: 5 Cross-sections included: 16
Total pool (balanced) observations: 80
Variable Coefficient Std. Error t-Statistic Prob.
C 4.328381 0.861774 5.022640 0.0000
Cross-section fixed (dummy variables)
R-squared 0.975841 Mean dependent var 7.731750
2.3 Uji Chow
Redundant Fixed Effects Tests Pool: Untitled
Test cross-section fixed effects
Effects Test Statistic d.f. Prob.
Cross-section F 130.842218 (15,61) 0.0000
Cross-section Chi-square 280.142077 15 0.0000
Cross-section fixed effects test equation: Dependent Variable: PBV?
Method: Panel Least Squares Date: 04/14/16 Time: 11:02 Sample: 2010 2014
Included observations: 5 Cross-sections included: 16
Total pool (balanced) observations: 80
Variable Coefficient Std. Error t-Statistic Prob.
C -4.999270 3.361632 -1.487156 0.1411
TAG? 8.861849 7.716361 1.148449 0.2544
DER? 8.078703 2.729750 2.959503 0.0041
DPR? 12.57351 4.647180 2.705621 0.0084
R-squared 0.198556 Mean dependent var 7.731750
Adjusted R-squared 0.166920 S.D. dependent var 10.34002 S.E. of regression 9.437671 Akaike info criterion 7.376002 Sum squared resid 6769.292 Schwarz criterion 7.495104 Log likelihood -291.0401 Hannan-Quinn criter. 7.423753 F-statistic 6.276260 Durbin-Watson stat 0.211097 Prob(F-statistic) 0.000731
2.4 Random Effect Model (REM)
Dependent Variable: PBV?
Method: Pooled EGLS (Cross-section random effects) Date: 04/14/16 Time: 11:02
Sample: 2010 2014 Included observations: 5 Cross-sections included: 16
Total pool (balanced) observations: 80
Swamy and Arora estimator of component variances
Variable Coefficient Std. Error t-Statistic Prob.
C 4.187618 2.533236 1.653070 0.1024
Cross-section random 9.533100 0.9645
Idiosyncratic random 1.828966 0.0355
Weighted Statistics
R-squared 0.206512 Mean dependent var 0.660955
F-statistic 6.593206 Durbin-Watson stat 1.350085 Prob(F-statistic) 0.000509
Unweighted Statistics
R-squared 0.097622 Mean dependent var 7.731750
Sum squared resid 7621.816 Durbin-Watson stat 0.045765
Sumber: Hasil Penelitian 2016 (data diolah)
2.5Uji Hausman
Correlated Random Effects - Hausman Test Pool: Untitled
Test cross-section random effects
Test Summary
Chi-Sq.
Statistic Chi-Sq. d.f. Prob.
Cross-section random 4.236575 3 0.2370
Cross-section random effects test comparisons:
Variable Fixed Random Var(Diff.) Prob.
TAG? 3.388093 3.419035 0.008264 0.7336
DER? 2.541807 2.663270 0.009789 0.2196
DPR? 2.441278 2.568674 0.007787 0.1488
Cross-section random effects test equation: Dependent Variable: PBV?
Method: Panel Least Squares Date: 04/14/16 Time: 11:03 Sample: 2010 2014
Included observations: 5 Cross-sections included: 16
Total pool (balanced) observations: 80
Variable Coefficient Std. Error t-Statistic Prob.
C 4.328381 0.861774 5.022640 0.0000
TAG? 3.388093 1.737802 1.949643 0.0558
Effects Specification
Cross-section fixed (dummy variables)
R-squared 0.975841 Mean dependent var 7.731750
Adjusted R-squared 0.968713 S.D. dependent var 10.34002 S.E. of regression 1.828966 Akaike info criterion 4.249226 Sum squared resid 204.0522 Schwarz criterion 4.814958 Log likelihood -150.9691 Hannan-Quinn criter. 4.476044 F-statistic 136.8879 Durbin-Watson stat 1.695520 Prob(F-statistic) 0.000000
Sumber: Hasil Penelitian 2016 (data diolah)
2.6Nilai Statistik dari Uji F, Uji t, dan Koefisien Determinasi
Dependent Variable: PBV?
Method: Pooled EGLS (Cross-section random effects) Date: 04/14/16 Time: 11:02
Sample: 2010 2014 Included observations: 5 Cross-sections included: 16
Total pool (balanced) observations: 80
Swamy and Arora estimator of component variances
Variable Coefficient Std. Error t-Statistic Prob.
C 4.187618 2.533236 1.653070 0.1024
TAG? 3.419035 1.735423 1.970145 0.0525
DER? 2.663270 0.866935 3.072052 0.0029
DPR? 2.568674 1.178155 2.180251 0.0323
R-squared 0.206512 Mean dependent var 0.660955
Adjusted R-squared 0.175190 S.D. dependent var 2.030175 S.E. of regression 1.843786 Sum squared resid 258.3655 F-statistic 6.593206 Durbin-Watson stat 1.350085 Prob(F-statistic) 0.000509